Team:Cambridge/Lab book/Week 14
From 2012.igem.org
| Week: | 3 | 4 | 5 | 6 | 7 | 8 | 9 | 10 | 11 | 12 | 13 | 14 |
|---|
Contents |
Monday (24/09/12)
Ratiometrica - Lux
Colonies grew. However colony PCR using the sequencing primers revealed them to be transformed with recircularised backbone.The digestions and ligations were reattempted, this time treating the backbone with alkaline phosphatase in order to reduce or eliminate self-ligation.
Instrumentation
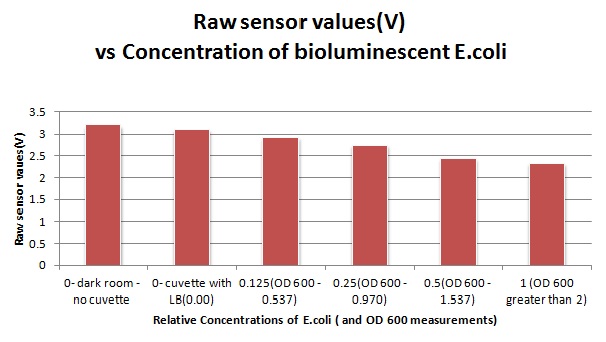
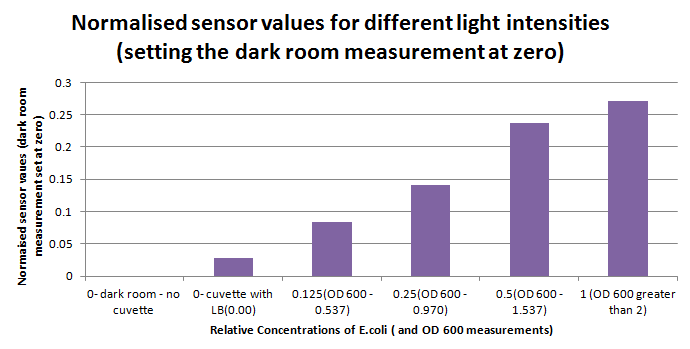
The sensitivity of the sensor concerning light intensities was tested using a dilution series of luciferase-producing bacteria. 20ml Cultures were grown overnight from single colonies. The cultures were induced with 40ul of 1.5M arabinose (for a final concentration of 3mM). Cultures were left for 2 1/2 hours for full induction. Subsequently, a culture was pelleted and resuspended in 4ml LB. Doubling dilutions, of volume 2ml, were made from this concentrate, down to 1/8th concentration. 1ml of each 2ml dilution was analysed in each cuvette, which was placed in the cuvette holder we made ourselves.
Tuesday (25/09/12)
General
a few colonies obtained on each plates. cultures made at the same time as preparing a colony PCR. Unfortunately, similar results were obtained to yesterday, showing no insert.
Ratiometrica - Lux
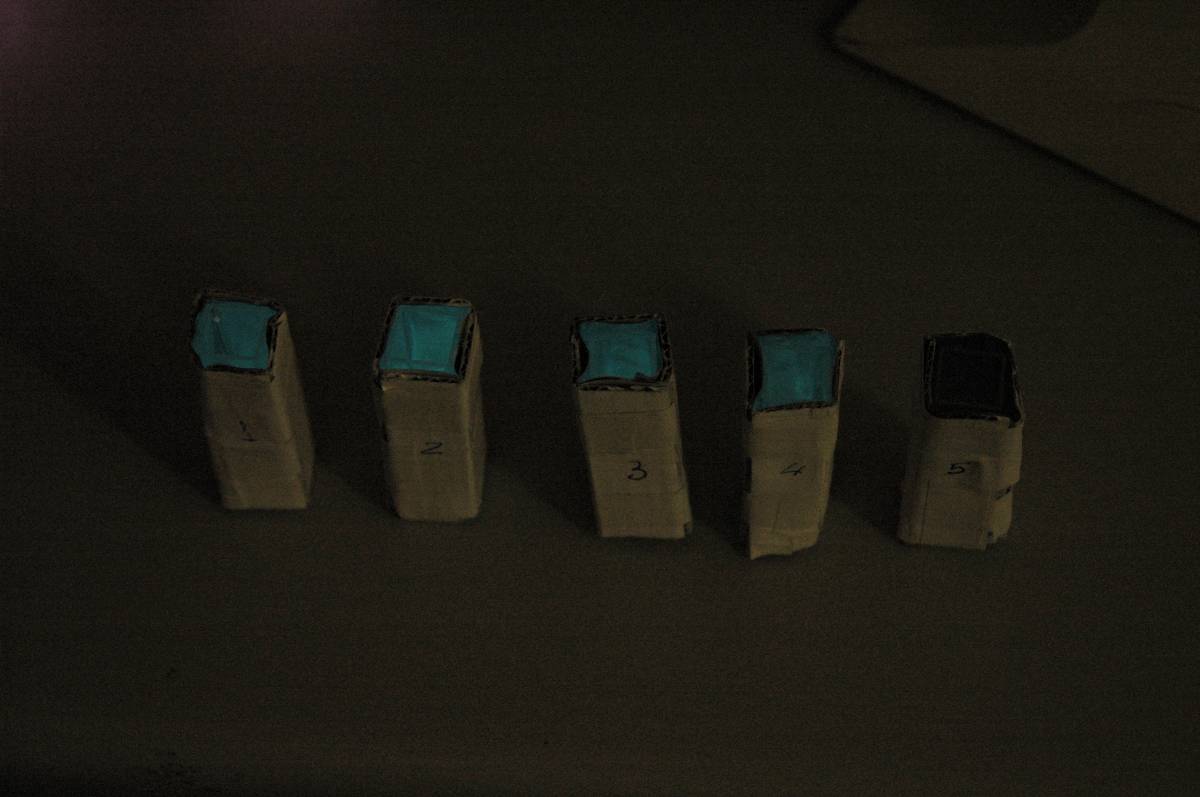
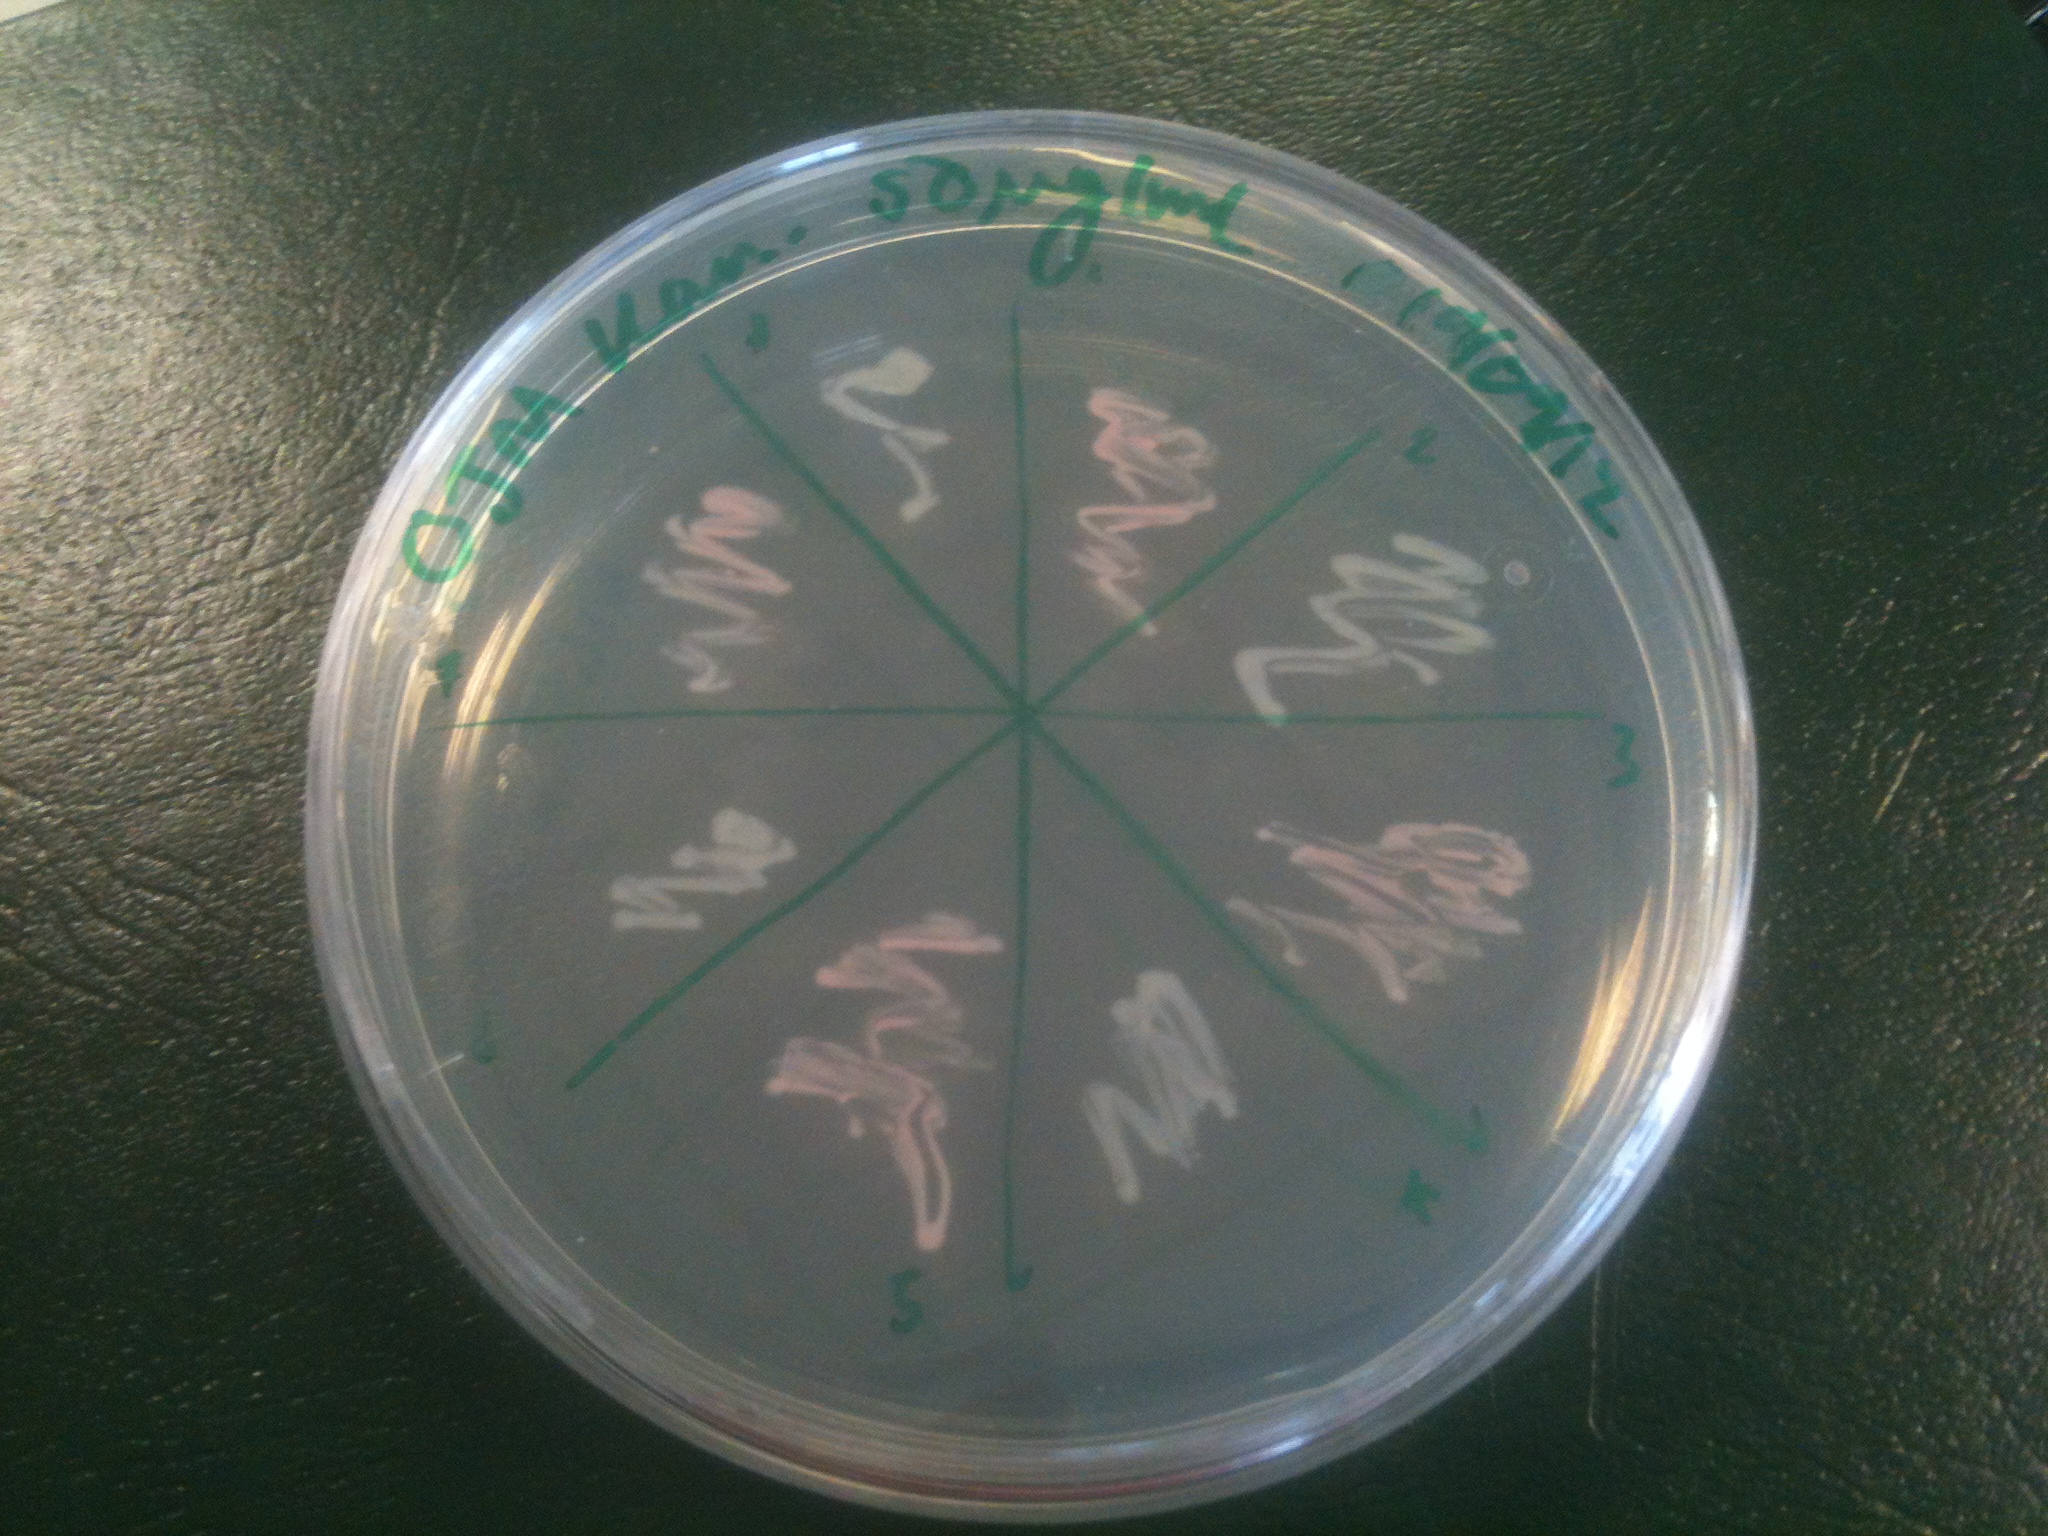
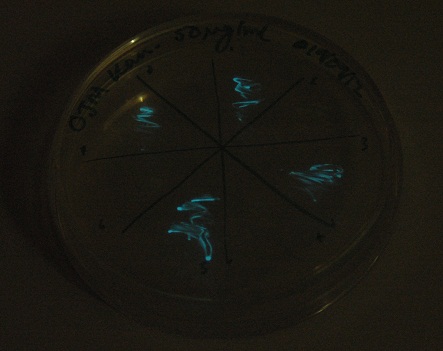
Images were taken to show cosegregation of orange colour and luminescence. Additionally, images were taken of the luciferase construct with a gel filter in order to indicate if there was a difference in the emission spectra.
See results page for more details and interpretation.
Instrumentation
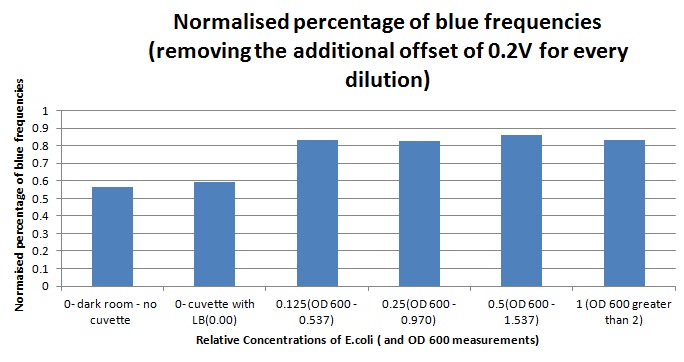
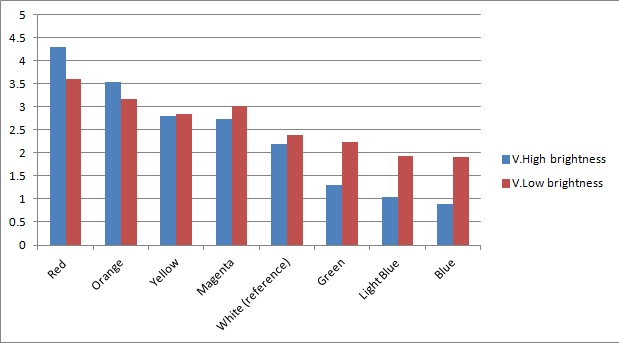
The sensitivity of the sensor concerning different frequencies (colours) of light was tested as well. As can be seen below, measurements taken from orange and blue light yield values respectively above and below those from white light (our reference point). The data was taken using a constant intensity of light for each case (V.High and V.Low brightness). This was done with the aid of an Android phone and a specialised software application, called Color Flashlight, downloaded from the official Market.
Wednesday (26/09/12)
RiboSense: Miller Assay of Fluoride construct
- colonies picked from overnight and Miller assay run again as directed on protocols page
- 2 colonies each of E. coli, 168 strain, and crcB knockout strain Bacillus assayed
- Greater resolution at lower fluoride concentrations to test theory from previous assay
- Lack of filters meant that only A450 data recorderd
Thursday (27/09/12)
RiboSense: Miller run 2 data analysis
- Data analysed and can be found here.
- Nicely replicates data from previous run, seems to confirm our theories about its function, for more information see the results page linked above.
Friday (28/09/12)
 "
"

