"
"
Team:UNITN-Trento/Project/Terminators
From 2012.igem.org
| Line 84: | Line 84: | ||
</div> | </div> | ||
</li> | </li> | ||
| + | <li><a href="https://2012.igem.org/Team:UNITN-Trento/DataPage">Data Page</a></li> | ||
<li class="folder"><a href="javascript:void(0);">Parts</a> | <li class="folder"><a href="javascript:void(0);">Parts</a> | ||
<div class="notch"></div> | <div class="notch"></div> | ||
| Line 128: | Line 129: | ||
</div> | </div> | ||
</li> | </li> | ||
| - | <li><a href="https://2012.igem.org/Team:UNITN-Trento/Safety">Safety</a></li> | + | <li class="folder"><a href="javascript:void(0);">Safety</a> |
| + | <div class="notch"></div> | ||
| + | <div class="subnav" > | ||
| + | <ul> | ||
| + | <li><a href="https://2012.igem.org/Team:UNITN-Trento/Safety">Safety</a></li> | ||
| + | <li><a href="https://2012.igem.org/Team:UNITN-Trento/H2S">H<sub>2</sub>S</a></li> | ||
| + | </ul> | ||
| + | </div> | ||
| + | </li> | ||
<li><a href="https://2012.igem.org/Team:UNITN-Trento/Outreach">Outreach</a></li> | <li><a href="https://2012.igem.org/Team:UNITN-Trento/Outreach">Outreach</a></li> | ||
| - | + | <li><a href="https://2012.igem.org/Team:UNITN-Trento/Art">Art&Science</a></li> | |
</ul> | </ul> | ||
</div> | </div> | ||
| Line 166: | Line 175: | ||
<div class="chapter intro visible"> | <div class="chapter intro visible"> | ||
<h2 style="text-align: center;">INTRODUCTION</h2> | <h2 style="text-align: center;">INTRODUCTION</h2> | ||
| - | |||
| - | |||
| - | |||
| - | |||
| - | |||
| - | |||
| - | |||
| - | |||
| - | |||
| - | |||
| - | |||
| - | |||
| - | |||
| - | |||
| - | |||
| - | |||
| - | |||
| - | <p> | + | <p>Despite the prevalence of T7 driven systems in recombinant technology and the fact that one of the first synthetic biology studies exploited T7 genomics [1], parts derived from the T7 bacteriophage have been underused and poorly standardized. We feel that the neglect of T7 represents a missed opportunity, since T7 RNA polymerase, for example, is much simpler than bacterial counterparts. Therefore, we set out to better characterize T7 transcriptional termination and to compare transcriptional termination efficiencies between T7 and Escherichia coli systems. More specifically, we sought to:</p> |
| - | < | + | <ol> |
| + | <li><p>Determine the efficiency of a T7 transcriptional terminator with T7 RNA polymerase.</p></li> | ||
| + | <li><p>Determine the efficiency of a T7 transcriptional terminator with E. coli RNA polymerase.</p></li> | ||
| + | <li><p>Determine the efficiency of an E. coli transcriptional terminator with T7 RNA polymerase.</p></li> | ||
| + | <li><p>Determine the efficiency of an E. coli transcriptional terminator with E. coli RNA polymerase.</p></li> | ||
| + | </ol> | ||
| + | <br /> | ||
| + | <p> <img src="http://www.science.unitn.it/~igem/img/project/Phage.png" style="float: left; width: 200px; margin-right: 20px;" alt="" /> | ||
| + | We chose to investigate the most commonly used T7 transcriptional terminator and the most common T7 promoter. The tested E. coli parts consisted of a strong transcriptional terminator (T1 rrnB) and a standard tacI promoter, which is well recognized by sigma–70 E. coli RNA polymerase. We wanted to compare T7 with E. coli parts, because (1) E. coli is the natural host of T7 bacteriophage and the most common synthetic biology chassis; (2) it would be useful to understand which terminators are compatible with which polymerases so as to increase the available options to synthetic biologists.</p> | ||
| + | <br /><br /> | ||
| + | <p> <img src="http://www.science.unitn.it/~igem/img/project/Ecoli.jpg" style="float: right; width: 200px; margin-left: 20px;" alt="" /> | ||
| + | Ideally, transcriptional termination efficiencies would be measured by directly quantifying truncated and full length transcripts. In practice, due to the difficulties in accurately determining in vivo RNA levels, fluorescence deriving from messages encoding fluorescent proteins are used as a proxy for RNA levels. We are aware that protein levels are not the same as transcript concentrations. Nevertheless, protein concentrations typically are related to RNA concentrations, and fluorescent protein measurements are much more amenable to high-throughput technologies. Additionally, as the final goal is often times the control of protein ratios, such fluorescent protein based assays directly evaluates the influence of RNA elements on protein expression levels.</p> | ||
| - | + | <p>In order to measure transcriptional termination efficiencies, we exploited a bicistronic message encoding the fluorescent proteins mCherry and A206K Venus (mVenus) separated by a BioBrick cloning region. This BioBrick compatible plasmid backbones were deposited under the names <a href="http://partsregistry.org/Part:BBa_K731700">BBa_K731700</a> and <a href="http://partsregistry.org/Part:BBa_K731710">BBa_K731710</a>. The ratio of mVenus to mCherry was then used as an indicator of transcriptional termination efficiency. The T7 promoter - T7 terminator system was also evaluated through in vitro transcription-translation.</p> | |
| - | <p> | + | |
| - | + | ||
| - | <p> | + | <p>We hope that this work will contribute to the use of T7 parts and help aid synthetic biologists in building systems that precisely encode gene product ratios. |
| - | + | ||
| - | + | ||
| - | + | ||
| - | + | ||
| - | + | ||
| - | + | ||
| - | + | ||
| - | + | ||
| - | + | ||
| - | + | ||
| - | + | ||
| - | + | ||
| - | + | ||
| - | + | ||
| - | + | ||
| - | |||
| - | |||
| - | |||
| - | |||
| - | |||
| - | |||
</p> | </p> | ||
| - | + | ||
| - | + | ||
| - | + | ||
| - | + | ||
| - | + | <div class="internalLink" style="text-align: center; width: 800px;" id="method"><a href="javascript:void(0);"><h3>READ ABOUT OUR METHOD</h3></a></div> | |
| - | + | ||
| - | + | ||
| - | <div class="internalLink" style=" | + | |
</div> | </div> | ||
| - | <div class="chapter | + | <div class="chapter method"> |
| - | <h2 style="text-align: center;"> | + | <h2 style="text-align: center;">OUR METHOD</h2> |
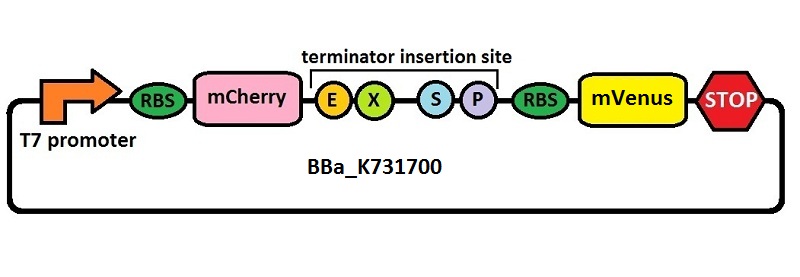
| - | + | <p>The first thing we did was to build a platform from which we could measure transcriptional termination efficiencies through fluorescence. We started with a previously constructed plasmid backbone (RL024A) from the Mansy lab that was built by Roberta Lentini. RL024A is essentially <a href="http://www.merckmillipore.it/life-science-research/vector-table-novagen-pet-vector-table/c_HdSb.s1O77QAAAEhPqsLdcab?PortalCatalogID=merck4biosciences&CountryName=Italy">pET21b</a> with the genes coding for mCherry and mVenus separated by a 20 bp linker inserted into the polyclonal region. pET21b contains a T7 transcriptional promoter. RL024A and the parent plasmid pET21b also contain three illegal sites, which had to be removed. Finally, the prefix-suffix sequence was inserted between the mCherry and mVenus genes in order to give rise to our first construct, <a href="http://partsregistry.org/Part:BBa_K731700">BBa_K731700</a>. In summary, <a href="http://partsregistry.org/Part:BBa_K731700">BBa_K731700</a> is a plasmid backbone with a T7 transcriptional promoter in which transcriptional terminators can be inserted in between genes coding for mCherry and mVenus through standard BioBrick assembly. | |
| - | + | </p> | |
| - | + | ||
| - | + | ||
| - | + | ||
| - | + | ||
| - | < | + | <div style="width: 700px; margin: 0 auto;"><img style="width: 700px;" src="http://www.science.unitn.it/~igem/img/project/K731700image.jpg" /></div> |
| + | |||
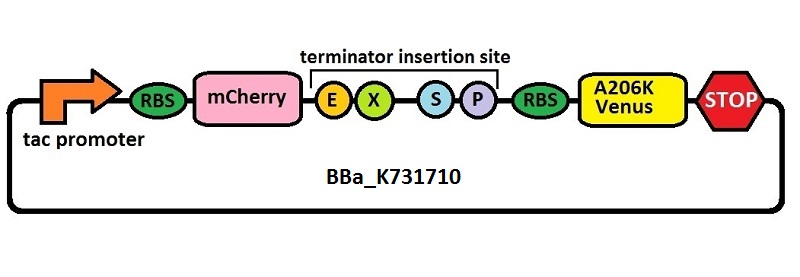
| + | <P>Subsequently, an analogous system with an <em>E. coli</em> transcriptional promoter in place of the T7 promoter was constructed. More specifically, a type of insertion-deletion PCR was used to insert an <em>E. coli</em> <em>tacI</em> transcriptional promoter and remove the T7 promoter (<a href="http://partsregistry.org/Part:BBa_J64997">BBa_J64997</a>). This plasmid backbone is hereafter referred to as <a href="http://partsregistry.org/Part:BBa_K731710">BBa_K731710</a>. </p> | ||
| - | < | + | <div style="width: 700px; margin: 0 auto;"><img style="width: 700px;" src="http://www.science.unitn.it/~igem/img/project/K731710image.jpg" /></div> |
| - | + |  | |
| + | <P>The T7 transcriptional terminator utilized in this study is the same wild type (WT) T7 transcriptional terminator found in most commercial vectors designed for recombinant expression. We amplified this terminator sequence directly from pET21b and subcloned it into pSB1C3, giving <a href="http://partsregistry.org/Part:BBa_K731721">BBa_K731721</a>.</p> | ||
| + | <p>The <em>E. coli</em> transcriptional terminator used for our experiments is T1 rrnB. Just as for the T7 terminator, the T1 rrnB terminator operates through a rho independent mechanism. Although the T1 rrnB transcriptional terminator is present in the Registry as a component of several double terminator constructs and individually in <a href="http://partsregistry.org/Part:BBa_B0010">BBa_B0010</a>, we were unable to obtain the part from either the 2011 or 2012 distribution kits. Our difficulties seem to be shared with several iGEM teams before us. Therefore, we extracted the <em>E. coli</em> T1 rrnB terminator from the double terminator <a href="http://partsregistry.org/Part:BBa_B0015">BBa_B0015</a> present inside of<a href="http://partsregistry.org/Part:BBa_E0840"> BBa_E0840</a>. We confirmed the construct by sequencing and re-deposited the terminator as <a href="http://partsregistry.org/Part:BBa_K731722">BBa_K731722</a>.</p> | ||
| - | + | <div style="width: 700px; margin: 0 auto;"><img style="width: 700px;" src="http://www.science.unitn.it/~igem/img/project/secondarystructurespanel.png" /></div> | |
| - | + | ||
| - | + | ||
| - | + | ||
| - | + | ||
| - | <div style="width: | + | |
<p class="caption"> | <p class="caption"> | ||
| - | <i> | + | <i>Examples of secondary structures assumed by the T7 terminator (A) and the <em>E. coli</em> (B) terminator tested. |
| + | </i> | ||
</p> | </p> | ||
| - | <p> | + | <p>Our experiments exploited an <em>E. coli</em> lysogen strain carrying T7 RNA polymerase and lacIq. Additionally, the cells, i.e. <em>E. coli</em> BL21(DE3) pLysS, also contained a plasmid encoding T7 lysozyme and chloramphenicol resistance. T7 lysozyme is a natural inhibitor of T7 RNA polymerase activity, thus reducing background expression of the target genes. The T7 RNA polymerase is a behind a lacUV5 promoter.</p> |
| - | |||
| - | |||
| - | |||
| - | |||
| - | + | <p>The apparent termination efficiency (Ea) was calculated using the following equation, <br /> | |
| - | + | <br /> | |
| - | + | ||
| - | + | ||
| - | + | ||
| - | + | ||
| - | + | ||
| - | + | ||
| - | + | ||
| - | + | ||
| - | + | ||
| - | + | ||
| - | + | ||
| - | + | ||
| - | + | ||
| - | + | ||
| - | + | ||
| - | + | ||
| - | + | ||
| - | + | ||
| - | + | ||
| - | + | ||
| - | + | ||
| - | + | ||
| - | + | ||
| - | + | ||
| - | + | ||
| - | + | ||
| - | + | ||
| - | + | ||
| - | + | ||
| - | + | ||
| - | + | ||
| - | + | ||
| - | + | ||
| - | + | ||
| - | + | ||
| - | + | ||
| - | + | ||
| - | + | ||
| - | + | ||
| - | + | ||
| - | + | ||
| - | + | ||
| - | + | ||
| - | + | ||
| - | + | ||
| - | + | ||
| - | + | Where Vs is the intensity of mVenus when behind the terminator of interest, Vc is the intensity of mVenus in the absence of a preceding terminator (that is, the control), Cs is the intensity of mCherry when followed by the terminator of interest intensity, and Cc is the intensity of mCherry in the absence of the terminator of interest, i.e. the control.</p> | |
| - | + | ||
| - | + | ||
| - | + | <div class="internalLink" style="text-align: center; width: 800px;" id="results"><a href="javascript:void(0);"><h3>GO TO OUR RESULTS</h3></a></div> | |
| - | + | </div> | |
| - | + | ||
| - | + | <div class="chapter results"> | |
| - | + | <h2 style="text-align: center;">RESULTS</h2> | |
| - | + | ||
| - | + | <p>The T7 transcriptional terminator was tested with both T7 and E. coli tac transcriptional promoters. We found that the apparent transcriptional termination efficiencies for the T7 terminator was 0.915 ± 0.008 and 0.80 ± 0.01 with T7 and E. coli RNA polymerases, respectively (Figure 5). Similar experiments with the E. coli T1 rrnB terminator gave apparent transcriptional termination efficiencies of 0.976 ± 0.005 and 0.985 ± 0.001 with T7 and E. coli RNA polymerases, respectively. The data suggest that the T7 terminator is more sensitive to the RNA polymerase than the E. coli terminator. Further, the E. coli terminator tested is significantly stronger than the tested T7 terminator. The results were obtained from several replicates and by exploring a large window of incubation times. Further details can be found here [[link]]. </p> | |
| - | + | ||
| - | + | <div style="width: 700px; margin: 0 auto;"><img style="width: 700px;" src="http://www.science.unitn.it/~igem/img/project/Term-Fig5.jpg" /></div> | |
| - | + | <p class="caption"> | |
| - | + | <i>Figure 5: Transcriptional termination efficiencies of T7 and E. coli terminators with T7 and E. coli RNA polymerases (RNAP). | |
| - | + | </i> | |
| - | + | </p> | |
| - | + | ||
| - | + | <p>While collecting the above data, we noticed that the raw fluorescence intensities for mCherry seemed to increase in the presence of the T7 transcriptional terminator when using the T7 RNA polymerase. This effect was previously described by H. Abe and H. Aiba [2]. To further explore this potential influence, we repeated the experiment but this time ensured that all measurements were taken from cultures that were induced at the same optical density (O.D.), more information can be found [here]. The mCherry fluorescence was then analyzed with the following equation, that represent the Relative Increase in the upstream gene expression, where Cs is the intensity of mCherry when followed by the terminator of interest, and Cc is the intensity of mCherry of the control construct that did not contain the terminator. | |
| - | </ | + | |
| - | + | The data showed that the combination of a T7 transcriptional promoter and a T7 transcriptional terminator increased mCherry levels two-fold with respect the same construct in the absence of an intervening terminator. This effect was not observed for the remaining three combinations tested. Since the apparent transcriptional termination efficiencies were calculated as a ratio of mVenus over mCherry levels, an increase in mCherry fluorescence would result in an over estimation of the termination efficiency.<br/> | |
| - | + | To investigate whether our values were, indeed, over estimated, we calculated raw termination efficiencies from the same samples used for the mCherry measurements. The fluorescence intensities of mVenus were evaluated without considering mCherry emissions with the following equation:</p> | |
| - | + | ||
| - | + | <p>formula</p> | |
| - | + | ||
| - | + | <p>where Vs is the intensity of mVenus when preceded by the terminator of interest, and Vc is the intensity of mVenus control, i.e. in the absence of the preceding terminator.<br/> | |
| - | + | When the contribution of mCherry was removed, the data suggested that the RNA polymerase did not influence the transcriptional termination efficiency (Figure 6).</p> | |
| - | + | ||
| - | + | ||
| - | + | <div style="width: 700px; margin: 0 auto;"><img style="width: 700px;" src="http://www.science.unitn.it/~igem/img/project/Term-Fig6.jpg" /></div> | |
| - | + | <p class="caption"> | |
| - | + | <i>Figure 6: The raw termination efficiencies of T7 and E. coli terminators with T7 and E. coli RNA polymerases (RNAP). | |
| - | + | </i> | |
| - | + | </p> | |
| - | + | ||
| - | + | <p>One potential reason for the increased mCherry levels could be that the terminator protects the transcript from the activity of cellular RNases. Although RNases would not explain why the effect was only observed for the T7 promoter - T7 terminator combination, we decided to test some of the constructs in a purified system that lacked the presence of nucleases. Therefore, we exploited the PURExpress kit from New England BioLabs, which consists of purified transcription - translation machinery, including T7 RNA polymerase and E. coli ribosomes. First, the data showed that the transcriptional termination efficiencies, both apparent and raw, were significantly lower in the purified, in vitro system for both T7 and E. coli terminators than the data obtained from the in vivo experiments (Figure 7). This is consistent with the fact that T7 lysozyme, which was not present in our in vitro experiments but was present in vivo, aids in transcriptional termination [3]. Second, the stabilization effect was significantly diminished in vitro, suggesting that RNases or other unidentified cellular factors were involved. Some kinetic profiles of the reaction can be found below (Figure 8).</p> | |
| - | + | ||
| - | + | <div style="width: 700px; margin: 0 auto;"><img style="width: 700px;" src="http://www.science.unitn.it/~igem/img/project/Term-Fig7.jpg" /></div> | |
| - | + | <p class="caption"> | |
| - | + | <i>Figure 7: The activity of T7 and E. coli terminators in vitro with purified T7 RNA polymerase and E. coli translation machinery. Left, right and bottom panels show apparent termination efficiencies, raw termination efficiencies, and normalized mCherry expression. | |
| - | + | </i> | |
| - | + | </p> | |
| - | + | <div style="width: 700px; margin: 0 auto;"><img style="width: 700px;" src="http://www.science.unitn.it/~igem/img/project/Term-Fig8.jpg" /></div> | |
| - | + | <p class="caption"> | |
| - | + | <i>Figure 8: In vitro kinetic measurements. Left panel shows the raw peaks kinetic of BBa_K731700 with T7 terminator, right panel represents the raw termination efficiency kinetic of both terminators. | |
| - | + | </i> | |
| - | + | </p> | |
| - | + | ||
| - | + | ||
| - | + | <div class="internalLink" style="text-align: center; width: 800px;" id="future"><a href="javascript:void(0);"><h3>OUR FUTURE DIRECTIONS</h3></a></div> | |
| - | + | ||
| - | + | ||
| - | + | ||
| - | + | ||
| - | + | ||
| - | + | ||
| - | + | ||
| - | + | ||
| - | + | ||
| - | + | ||
| - | + | ||
| - | + | ||
| - | + | ||
| - | + | ||
| - | + | ||
| - | + | ||
| - | + | ||
| - | + | ||
| - | + | ||
| - | + | ||
| - | + | ||
| - | + | ||
| - | + | ||
| - | + | ||
| - | + | ||
| - | + | ||
| - | + | ||
| - | + | ||
| - | + | ||
| - | + | ||
| - | + | ||
| - | + | ||
| - | + | ||
| - | + | ||
| - | + | ||
| - | + | ||
| - | + | ||
| - | + | ||
| - | + | ||
| - | + | ||
</div> | </div> | ||
<div class="chapter future"> | <div class="chapter future"> | ||
| - | <h2 style="text-align: center;"> | + | <h2 style="text-align: center;">FUTURE DIRECTIONS</h2> |
| - | < | + | <p>In the future, we feel that the exploration of the influences of T7 lysozyme on termination efficiencies would be informative and perhaps could provide for an additional platform to control protein ratios. For example, the suppression of one protein could be achieved by simply inducing the expression of T7 lysozyme. Additionally, the apparent stabilization effect resulting in increased mCherry levels in the presence of the T7 terminator should be explored. If the result proves to be real, then such influences would need to be accounted for when exploiting transcriptional terminators to modulate protein levels arising from polycistronic messages. </p> |
| - | + | ||
| - | + | ||
| - | + | ||
| - | + | ||
| - | + | ||
| - | + | ||
| - | + | ||
| - | + | ||
| - | + | ||
| - | + | ||
| - | + | ||
| - | + | ||
| - | + | ||
| - | + | ||
| - | + | ||
| - | + | ||
| - | + | ||
| - | + | ||
| + | <p>The main aim of this project was to build a functioning platform to easily characterize terminators. We, therefore, hope that this part will be useful in the future to analyze many different terminators, and that such analyses will improve the number of characterized terminators in the Registry. We also hope that others will extend these studies to include the investigation of termination efficiencies associated with other RNA polymerases. Most importantly, we hope that many teams will have fun discovering new applications for transcriptional terminators!</p> | ||
| - | + | <h3>REFERENCES:</h3> | |
| - | + | ||
| - | + | <ol> | |
| - | + | <li>Leon Y Chan, Sriram Kosuri and Drew Endy, Refactoring bacteriophage T7. Mol. Syst. Biol. 2005; 1: 2005.0018. [PMC]</li> | |
| - | + | <li>Lyakhov DL, He B, Zhang X, Studier FW, Dunn JJ, McAllister WT, Pausing and termination by bacteriophage T7 RNA polymerase. J. Mol. Biol. 1998; 280(2): 201–13.</li> | |
| - | + | </ol> | |
| - | + | ||
| - | + | ||
| - | + | ||
| - | + | ||
| - | + | ||
| - | + | ||
| - | + | ||
| - | + | ||
| - | + | ||
| - | + | ||
| - | + | ||
| - | + | ||
| - | + | ||
| - | + | ||
| - | + | ||
| - | + | ||
| - | + | ||
| - | + | ||
| - | + | ||
</div> | </div> | ||
| Line 499: | Line 345: | ||
| - | <p>Design by Jason Fontana. Powered by <a href="http://www.mediawiki.org/wiki/MediaWiki">MediaWiki</a>. This website is under the <a href="http://creativecommons.org/licenses/by/3.0/">CC Attribution licence</a>. | <span class="toggle">Toggle controls</span></p> | + | <p>Design by Jason Fontana. Powered by <a href="http://www.mediawiki.org/wiki/MediaWiki">MediaWiki</a>. This website is under the <a href="http://creativecommons.org/licenses/by/3.0/">CC Attribution licence</a>.<!-- | <span class="toggle">Toggle controls</span>--></p> |
</div> | </div> | ||
| Line 508: | Line 354: | ||
<script src="http://www.science.unitn.it/~igem/js/project.js" type="text/javascript"></script> | <script src="http://www.science.unitn.it/~igem/js/project.js" type="text/javascript"></script> | ||
| - | <script> | + | <!--<script> |
(function() { | (function() { | ||
var $mw = $('div#mw'); | var $mw = $('div#mw'); | ||
| Line 516: | Line 362: | ||
}); | }); | ||
})(); | })(); | ||
| - | </script> | + | </script> --> |
<script type="text/javascript"> | <script type="text/javascript"> | ||
Revision as of 18:03, 20 September 2012
Terminator 5

INTRODUCTION
Despite the prevalence of T7 driven systems in recombinant technology and the fact that one of the first synthetic biology studies exploited T7 genomics [1], parts derived from the T7 bacteriophage have been underused and poorly standardized. We feel that the neglect of T7 represents a missed opportunity, since T7 RNA polymerase, for example, is much simpler than bacterial counterparts. Therefore, we set out to better characterize T7 transcriptional termination and to compare transcriptional termination efficiencies between T7 and Escherichia coli systems. More specifically, we sought to:
Determine the efficiency of a T7 transcriptional terminator with T7 RNA polymerase.
Determine the efficiency of a T7 transcriptional terminator with E. coli RNA polymerase.
Determine the efficiency of an E. coli transcriptional terminator with T7 RNA polymerase.
Determine the efficiency of an E. coli transcriptional terminator with E. coli RNA polymerase.
 We chose to investigate the most commonly used T7 transcriptional terminator and the most common T7 promoter. The tested E. coli parts consisted of a strong transcriptional terminator (T1 rrnB) and a standard tacI promoter, which is well recognized by sigma–70 E. coli RNA polymerase. We wanted to compare T7 with E. coli parts, because (1) E. coli is the natural host of T7 bacteriophage and the most common synthetic biology chassis; (2) it would be useful to understand which terminators are compatible with which polymerases so as to increase the available options to synthetic biologists.
 Ideally, transcriptional termination efficiencies would be measured by directly quantifying truncated and full length transcripts. In practice, due to the difficulties in accurately determining in vivo RNA levels, fluorescence deriving from messages encoding fluorescent proteins are used as a proxy for RNA levels. We are aware that protein levels are not the same as transcript concentrations. Nevertheless, protein concentrations typically are related to RNA concentrations, and fluorescent protein measurements are much more amenable to high-throughput technologies. Additionally, as the final goal is often times the control of protein ratios, such fluorescent protein based assays directly evaluates the influence of RNA elements on protein expression levels.
In order to measure transcriptional termination efficiencies, we exploited a bicistronic message encoding the fluorescent proteins mCherry and A206K Venus (mVenus) separated by a BioBrick cloning region. This BioBrick compatible plasmid backbones were deposited under the names BBa_K731700 and BBa_K731710. The ratio of mVenus to mCherry was then used as an indicator of transcriptional termination efficiency. The T7 promoter - T7 terminator system was also evaluated through in vitro transcription-translation.
We hope that this work will contribute to the use of T7 parts and help aid synthetic biologists in building systems that precisely encode gene product ratios.
OUR METHOD
The first thing we did was to build a platform from which we could measure transcriptional termination efficiencies through fluorescence. We started with a previously constructed plasmid backbone (RL024A) from the Mansy lab that was built by Roberta Lentini. RL024A is essentially pET21b with the genes coding for mCherry and mVenus separated by a 20 bp linker inserted into the polyclonal region. pET21b contains a T7 transcriptional promoter. RL024A and the parent plasmid pET21b also contain three illegal sites, which had to be removed. Finally, the prefix-suffix sequence was inserted between the mCherry and mVenus genes in order to give rise to our first construct, BBa_K731700. In summary, BBa_K731700 is a plasmid backbone with a T7 transcriptional promoter in which transcriptional terminators can be inserted in between genes coding for mCherry and mVenus through standard BioBrick assembly.
Subsequently, an analogous system with an E. coli transcriptional promoter in place of the T7 promoter was constructed. More specifically, a type of insertion-deletion PCR was used to insert an E. coli tacI transcriptional promoter and remove the T7 promoter (BBa_J64997). This plasmid backbone is hereafter referred to as BBa_K731710.
The T7 transcriptional terminator utilized in this study is the same wild type (WT) T7 transcriptional terminator found in most commercial vectors designed for recombinant expression. We amplified this terminator sequence directly from pET21b and subcloned it into pSB1C3, giving BBa_K731721.
The E. coli transcriptional terminator used for our experiments is T1 rrnB. Just as for the T7 terminator, the T1 rrnB terminator operates through a rho independent mechanism. Although the T1 rrnB transcriptional terminator is present in the Registry as a component of several double terminator constructs and individually in BBa_B0010, we were unable to obtain the part from either the 2011 or 2012 distribution kits. Our difficulties seem to be shared with several iGEM teams before us. Therefore, we extracted the E. coli T1 rrnB terminator from the double terminator BBa_B0015 present inside of BBa_E0840. We confirmed the construct by sequencing and re-deposited the terminator as BBa_K731722.
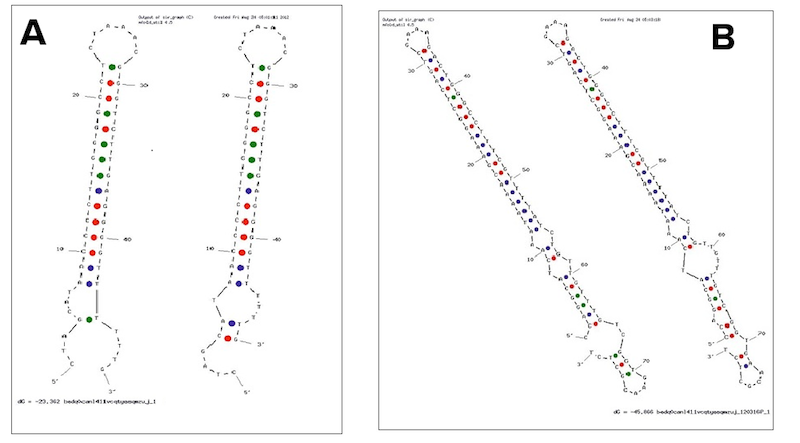
Examples of secondary structures assumed by the T7 terminator (A) and the E. coli (B) terminator tested.
Our experiments exploited an E. coli lysogen strain carrying T7 RNA polymerase and lacIq. Additionally, the cells, i.e. E. coli BL21(DE3) pLysS, also contained a plasmid encoding T7 lysozyme and chloramphenicol resistance. T7 lysozyme is a natural inhibitor of T7 RNA polymerase activity, thus reducing background expression of the target genes. The T7 RNA polymerase is a behind a lacUV5 promoter.
The apparent termination efficiency (Ea) was calculated using the following equation,
Where Vs is the intensity of mVenus when behind the terminator of interest, Vc is the intensity of mVenus in the absence of a preceding terminator (that is, the control), Cs is the intensity of mCherry when followed by the terminator of interest intensity, and Cc is the intensity of mCherry in the absence of the terminator of interest, i.e. the control.
RESULTS
The T7 transcriptional terminator was tested with both T7 and E. coli tac transcriptional promoters. We found that the apparent transcriptional termination efficiencies for the T7 terminator was 0.915 ± 0.008 and 0.80 ± 0.01 with T7 and E. coli RNA polymerases, respectively (Figure 5). Similar experiments with the E. coli T1 rrnB terminator gave apparent transcriptional termination efficiencies of 0.976 ± 0.005 and 0.985 ± 0.001 with T7 and E. coli RNA polymerases, respectively. The data suggest that the T7 terminator is more sensitive to the RNA polymerase than the E. coli terminator. Further, the E. coli terminator tested is significantly stronger than the tested T7 terminator. The results were obtained from several replicates and by exploring a large window of incubation times. Further details can be found here [[link]].
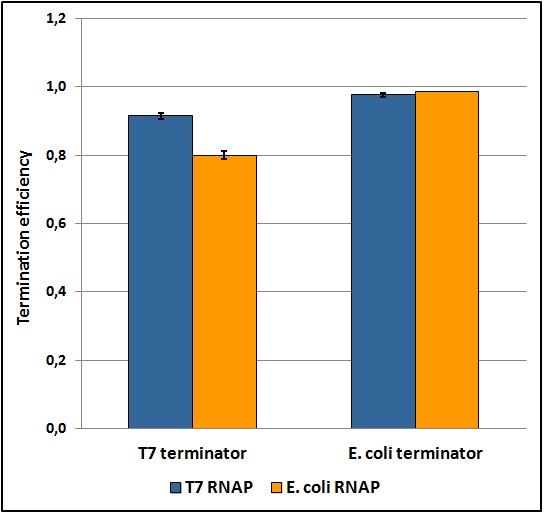
Figure 5: Transcriptional termination efficiencies of T7 and E. coli terminators with T7 and E. coli RNA polymerases (RNAP).
While collecting the above data, we noticed that the raw fluorescence intensities for mCherry seemed to increase in the presence of the T7 transcriptional terminator when using the T7 RNA polymerase. This effect was previously described by H. Abe and H. Aiba [2]. To further explore this potential influence, we repeated the experiment but this time ensured that all measurements were taken from cultures that were induced at the same optical density (O.D.), more information can be found [here]. The mCherry fluorescence was then analyzed with the following equation, that represent the Relative Increase in the upstream gene expression, where Cs is the intensity of mCherry when followed by the terminator of interest, and Cc is the intensity of mCherry of the control construct that did not contain the terminator.
The data showed that the combination of a T7 transcriptional promoter and a T7 transcriptional terminator increased mCherry levels two-fold with respect the same construct in the absence of an intervening terminator. This effect was not observed for the remaining three combinations tested. Since the apparent transcriptional termination efficiencies were calculated as a ratio of mVenus over mCherry levels, an increase in mCherry fluorescence would result in an over estimation of the termination efficiency.
To investigate whether our values were, indeed, over estimated, we calculated raw termination efficiencies from the same samples used for the mCherry measurements. The fluorescence intensities of mVenus were evaluated without considering mCherry emissions with the following equation:
formula
where Vs is the intensity of mVenus when preceded by the terminator of interest, and Vc is the intensity of mVenus control, i.e. in the absence of the preceding terminator.
When the contribution of mCherry was removed, the data suggested that the RNA polymerase did not influence the transcriptional termination efficiency (Figure 6).

Figure 6: The raw termination efficiencies of T7 and E. coli terminators with T7 and E. coli RNA polymerases (RNAP).
One potential reason for the increased mCherry levels could be that the terminator protects the transcript from the activity of cellular RNases. Although RNases would not explain why the effect was only observed for the T7 promoter - T7 terminator combination, we decided to test some of the constructs in a purified system that lacked the presence of nucleases. Therefore, we exploited the PURExpress kit from New England BioLabs, which consists of purified transcription - translation machinery, including T7 RNA polymerase and E. coli ribosomes. First, the data showed that the transcriptional termination efficiencies, both apparent and raw, were significantly lower in the purified, in vitro system for both T7 and E. coli terminators than the data obtained from the in vivo experiments (Figure 7). This is consistent with the fact that T7 lysozyme, which was not present in our in vitro experiments but was present in vivo, aids in transcriptional termination [3]. Second, the stabilization effect was significantly diminished in vitro, suggesting that RNases or other unidentified cellular factors were involved. Some kinetic profiles of the reaction can be found below (Figure 8).
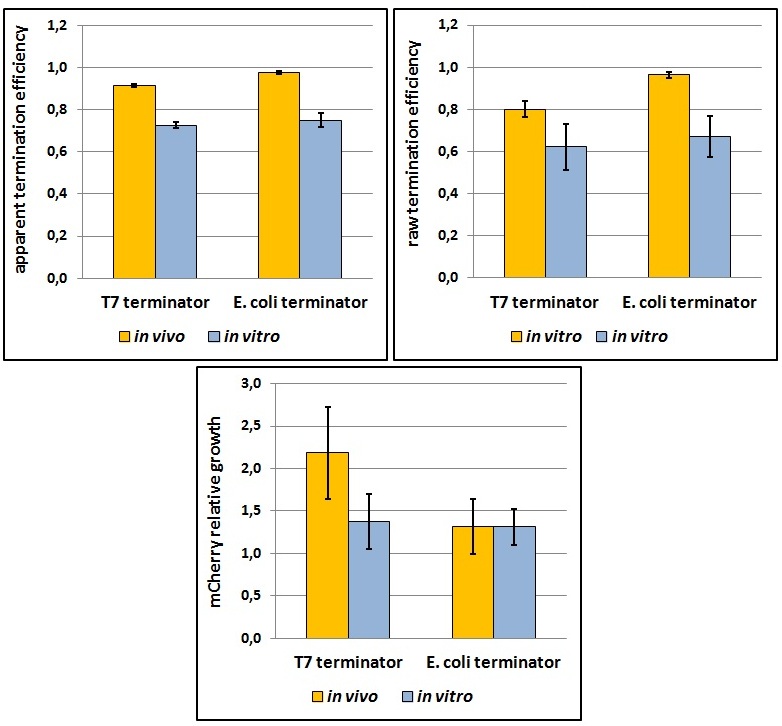
Figure 7: The activity of T7 and E. coli terminators in vitro with purified T7 RNA polymerase and E. coli translation machinery. Left, right and bottom panels show apparent termination efficiencies, raw termination efficiencies, and normalized mCherry expression.

Figure 8: In vitro kinetic measurements. Left panel shows the raw peaks kinetic of BBa_K731700 with T7 terminator, right panel represents the raw termination efficiency kinetic of both terminators.
FUTURE DIRECTIONS
In the future, we feel that the exploration of the influences of T7 lysozyme on termination efficiencies would be informative and perhaps could provide for an additional platform to control protein ratios. For example, the suppression of one protein could be achieved by simply inducing the expression of T7 lysozyme. Additionally, the apparent stabilization effect resulting in increased mCherry levels in the presence of the T7 terminator should be explored. If the result proves to be real, then such influences would need to be accounted for when exploiting transcriptional terminators to modulate protein levels arising from polycistronic messages.
The main aim of this project was to build a functioning platform to easily characterize terminators. We, therefore, hope that this part will be useful in the future to analyze many different terminators, and that such analyses will improve the number of characterized terminators in the Registry. We also hope that others will extend these studies to include the investigation of termination efficiencies associated with other RNA polymerases. Most importantly, we hope that many teams will have fun discovering new applications for transcriptional terminators!
REFERENCES:
- Leon Y Chan, Sriram Kosuri and Drew Endy, Refactoring bacteriophage T7. Mol. Syst. Biol. 2005; 1: 2005.0018. [PMC]
- Lyakhov DL, He B, Zhang X, Studier FW, Dunn JJ, McAllister WT, Pausing and termination by bacteriophage T7 RNA polymerase. J. Mol. Biol. 1998; 280(2): 201–13.