Team:Buenos Aires/Results/BBsTesting
From 2012.igem.org
m (→Co-Culture of strains) |
(→Tryptophan secretion at increasing histidine concentrations) |
||
| Line 85: | Line 85: | ||
==== Tryptophan secretion at increasing histidine concentrations ==== | ==== Tryptophan secretion at increasing histidine concentrations ==== | ||
| - | We carried on this test in order to | + | We asked ourselves which was the dependance of tryptophan secretion on the amount of histidine in medium. We carried on this test in order to determine the necessary amount of histidine in medium for the start of our system. |
'''Protocol''' | '''Protocol''' | ||
Revision as of 19:11, 26 October 2012

Contents |
After the Jamboree!
When we returned from the Latin America Jamboree we focused all our efforts on completing the neccesary transformations to test our devices and our projet as a whole.
We devided this task in three sections
Week 1&2 : Yeast expression vectors & Transformations
Plasmids
| YFP_TRP+++_TRPZipper | details | |
| YFP_TRP+_TRPZipper | details | |
| YFP_TRP+++_PoliWb | details | |
| YFP_TRP+_PoliWb | details | |
| CFP_HIS+_PoliHa | details | |
| CFP_HIS+_PoliHb | details |
Week 3: synthetic Ecology Characterization
xxoo
BB characterization
xxoo
Secretion Rate of Trp as a function of culture growth
The first step was to actually check if the construct works: do the transformed yeast strains - with the TRP BB - actually secrete TRP into the medium?
To test this we used the following strains:
- YFP_TRP+++_TRPZipper
- YFP_TRP+++_PolyWb
- YFP_TRP+++
- YFP_TRP+_TRPZipper
- YFP_TRP+_PolyWb
- YFP_TRP+
- YFP
Protocol
- We started 5ml cultures with 3 replica until they reached exponential phase, overnight, using a -T medium.
- Starting OD for the assay 0.1 (exponential phase).
- We measured OD every hour until they reached an OD: 0.8 (5 hs approximately).
- We measured the Trp signal for each culture medium using the spectrofluorometer.
We used a simple model to measure the export rate for all the strains. Since the cultures are in exponential phase, we take
After a few calculations, we find that
Next we show the average temporal evolution for each strains used,
Figure X. check
Tryptophan secretion at increasing histidine concentrations
We asked ourselves which was the dependance of tryptophan secretion on the amount of histidine in medium. We carried on this test in order to determine the necessary amount of histidine in medium for the start of our system.
Protocol We started cultures of strains YFP transformed with the tryptophan devices and with an empty plasmid(control)in medium that lacks tryptophan and left the cultures to grow overnight.
After 12 hs, we replaced the medium in each tube for one with increasing concentrations of histidine (dilutions 1X, 1/4; 1/8). We afterwards set cultures at an initial OD: 0.1.
We left the cultures in shaker at 30ºC for 5 hours. After that time, we measured the final OD reached by cultures with the use of a spectrophotometer and amount of tryptophan present in medium with a spectrofluorometer.
Strain characterization
Experimental determination of strains death rate
We set out to determine how long can auxotrophic cells[link] survive in media that lacks both Trytophan and Histidine. These values are the death parameters for CFP and YFP strains used in our model[link]. These were taken as equal in the mathematical analysis for simplicity, we'll test whether this approximation is accurate.
Given that our system most likely will present a lag phase until a certain amount of both AmioAcids is accumulated in the media, will the cells be viable until this occurs? This is a neccesary check of our system's feasability.
Protocol
- We set cultures of the two auxotrophic strains without being transformed (YFP and CFP) in medium –HT at an initial OD of 0.01.
- Each day we plated the same amount of µl of the culture and counted the number of colonies obtain in each plate. We set 3 replica of each strain.
Table: Number of colonies counted per plate. We expect to see a decrease in the number of colonies - because of cell death. We found that this was not the case, in the experiment's time lapse. However we observed that the size of the colonies was smaller everyday. We can infer from this data that though they have not died, they may have enter into a ...Alan state.
FigureX. Growth rate in function of the concentration of Trp and HisWe aimed to test the growth of the strains in different concentrations of external Trp and His in order to determine the amount of aminoacid at which the culture reaches half of the maximum growth (parameter K in the modeling of our system). We therefore made a series of cultures with increasing concentrations of Trp (Series 1)and His (Series 2). We set the cultures of the different strains at a low initial OD:0.001 with the following scheme: Series 1: strain YFP in each Trp concentration (dilutions 1/32; 1/16; 1/8; 1/4; 1/2; 1x) Series 2: strain CFP in each His concentration (dilutions 1/32; 1/16; 1/8; 1/4; 1/2; 1x) Controls: As control we started cultures of each strain in complete medium. Cultures were left overnight (12 hs) and we measured OD reached with the use of spectrophotometer.
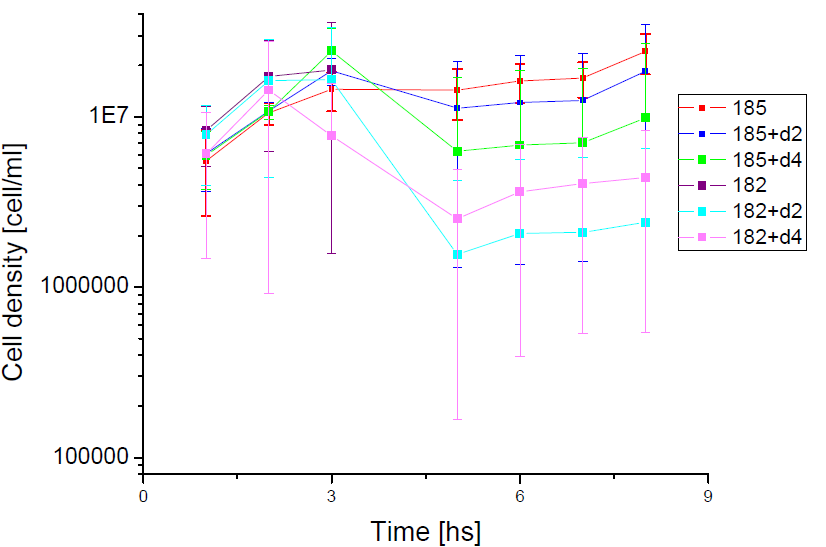
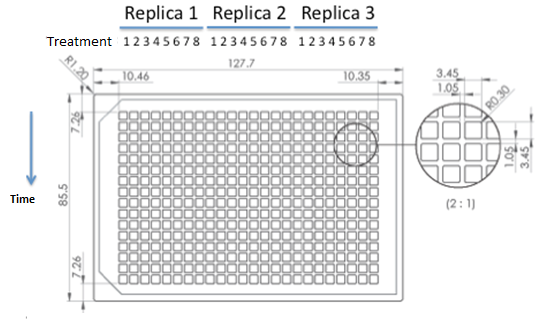
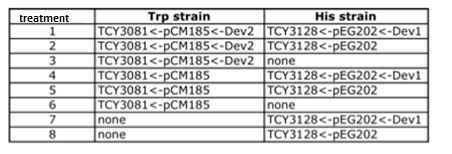
ANALISIS DE VERO Co-Culture of transformed strainsWe designed an assay to observe how any two transformed strains grow together growth of transformed strains with devices vs transformed strains with empty plasmids. Due to a time constrain, we proceeded to test our devices by coculture 1 and 2. Starters of each strain were done in medium complementary to the auxotrophy of the strain so that they would maintain their plamids (medium –H for pEG202; medium –T for pCM182/5 and medium SC for cells without plasmid), then sonicated briefly in low power and then washed with medium –H-T . When they are in exponential phase, we set the coculture of strains was at OD 600: 0.02 (Total, 1:1), in 5 ml of medium –H-T. We used epifluorescence microscope in order to determinate the strain proportion of each coculture. We used a 384 wells plate , with 20 µl of cyclohexamide 2x (CHX 2x) in each of the wells where we placed a sample. The density of the culture was calculated based on the cell density at in each wells.
Graph: 384 wells plate to be used for epifluorescence microscope.
Table: Coculture planification for number 1.
Table: Coculture planification. Color indicates level of priority of the experiment. |
 "
"


