Team:Buenos Aires/Results/BBsTesting
From 2012.igem.org
m (→Secretion Rate of Trp as a function of culture growth) |
(→Growth rate in function concentration of Trp and His) |
||
| Line 107: | Line 107: | ||
| - | ==== Growth rate in function concentration of Trp and His ==== | + | ==== Growth rate in function of the concentration of Trp and His ==== |
ESTO NO DEBE SER UNA SECCION DE ACA, SINO DE STRAIN CHARACTERIZATION, COMO UNA CONTINUACIÒN DEL EXPERIMENTO DE ALAN | ESTO NO DEBE SER UNA SECCION DE ACA, SINO DE STRAIN CHARACTERIZATION, COMO UNA CONTINUACIÒN DEL EXPERIMENTO DE ALAN | ||
| - | We aimed to test the growth of the strains in different concentrations of external Trp and His. | + | We aimed to test the growth of the strains in different concentrations of external Trp and His in order to determine the amount of aminoacid at which the culture reaches half of the maximum growth (parameter K in the modeling of our system). |
We therefore made a series of cultures with increasing concentrations of Trp (Series 1)and His (Series 2). We set the cultures of the different strains at a low initial OD:0.001 with the following scheme: | We therefore made a series of cultures with increasing concentrations of Trp (Series 1)and His (Series 2). We set the cultures of the different strains at a low initial OD:0.001 with the following scheme: | ||
Revision as of 15:55, 26 October 2012

Contents |
After the Jamboree!
When we returned from the LatinAmerican Jamboree we focused all our effords on completing the neccesary transformations to test our devices and our projet as a whole.
We devided this task in three sections
Week 1&2 : Yeast expression vectors & Transformations
| YFP_TRP+++_TRPZipper | details | |
| YFP_TRP+_TRPZipper | details | |
| YFP_TRP+++_PoliWb | details | |
| YFP_TRP+_PoliWb | details | |
| CFP_HIS+_PoliHa | details | |
| CFP_HIS+_PoliHb | details |
Week 3: synthetic Ecology Characterization
xxoo
BB characterization
xxoo
Secretion Rate of Trp as a function of culture growth
The first step was to actually check if the construct works: do the transformed yeast strains - with the TRP BB - actually secrete TRP into the medium?
To test this we used the following strains:
- YFP_TRP+++_TRPZipper
- YFP_TRP+++_PolyWb
- YFP_TRP+++
- YFP_TRP+_TRPZipper
- YFP_TRP+_PolyWb
- YFP_TRP+
- YFP
Protocol
- We started 5ml cultures with 3 replica until they reached exponential phase, overnight, using a -T medium.
- Starting OD for the assay 0.1 (exponential phase).
- We measured OD every hour until they reached an OD: 0.8 (5 hs approximately).
- We measured the Trp signal for each culture medium using the spectrofluorometer.
We used a simple model to measure the export rate for all the strains. Since the cultures are in exponential phase, we take
After a few calculations, we find that
Next we show the average temporal evolution for each strains used.
Figure X. check
Trp Secretion at different His concentrations in medium and His secretion at different Trp concentrations in medium
We started cultures in -T of the following strains:
i. strain TCY3081+pCM185 containing device2 ii. strain TCY3081+pCM185 containing device4 iii. strain TCY3081+pCM185 (empty plasmid)
We measured the OD of the cultures after 12 hs. We prepared cultures with increasing concentrations of His in medium (1X, 1/4; 1/8; 0X)and set cultures at initial OD: 0.1. After 5 hours we measured the final OD and Trp in medium.
Strain characterization
Experimental determination of K death
In order to determinate the K death used in the modeling section of our wiki, we set cultures of the two auxotrophic strains without being transformed (TCY3081 and TCY3128) in medium –HT at an initial OD of 0.01.
Taking into account that an OD:1 is approximately 3.10 7 cells/ml, we plated 133 µl in order to have around 200 colonies in the first day. Each following day we plated the same amount of µl of the culture and counted the number of colonies obtain in each plate. We set 3 replica of each strain.
TABLA CON EL NUMERO DE CELULAS POR DIA
Growth rate in function of the concentration of Trp and His
ESTO NO DEBE SER UNA SECCION DE ACA, SINO DE STRAIN CHARACTERIZATION, COMO UNA CONTINUACIÒN DEL EXPERIMENTO DE ALAN
We aimed to test the growth of the strains in different concentrations of external Trp and His in order to determine the amount of aminoacid at which the culture reaches half of the maximum growth (parameter K in the modeling of our system).
We therefore made a series of cultures with increasing concentrations of Trp (Series 1)and His (Series 2). We set the cultures of the different strains at a low initial OD:0.001 with the following scheme:
Series 1: strain TCY3081 (non transformed)in each Trp concentration (dilutions 1/32; 1/16; 1/8; 1/4; 1/2; 1x)
Series 2: strain TCY3128 (non transformed)in each His concentration (dilutions 1/32; 1/16; 1/8; 1/4; 1/2; 1x)
Controls: As control we started cultures of each strain in complete medium.
Cultures were left overnight (12 hs) and we measured OD reached with the use of spectrophotometer.
RESULTADOS:
ANALISIS DE VERO
Co-Culture of strains
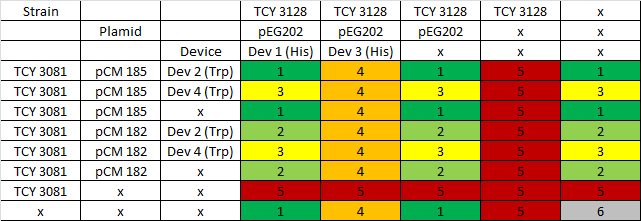
We proceeded then to test the coculture growth of transformed strains with devices vs transformed strains with empty devices and non transformed strains.

|
Table: Coculture planification. Number indicates level of priority of the experiment for characterization of devices.
Due to a time constrain, we ordered the experiments by level of priority and proceeded to test our devices by cocultures 1 and 2.
Starters of each strain were done in medium complementary to the auxotrophy of the strain so that they would maintain their plamids (medium –H for pEG202; medium –T for pCM182/5 and medium SC for cells without plasmid), then sonicated briefly in low power and then washed with medium –H-T . When they are in exponential phase, we set the coculture of strains was at OD 600: 0.02 (Total, 1:1), in 5 ml of medium –H-T.
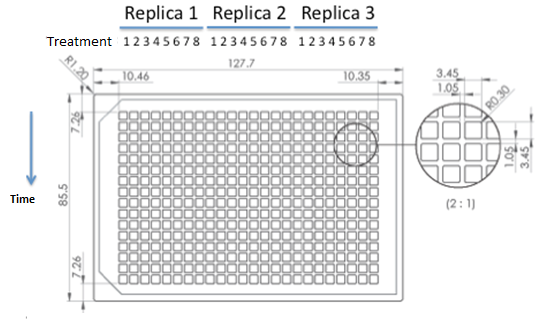
We used epifluorescence microscope in order to determinate the strain proportion of each coculture. We used a 384 wells plate , with 20 µl of cyclohexamide 2x (CHX 2x) in each of the wells where we placed a sample. The density of the culture was calculated based on the cell density at in each wells.

|
Graph: 384 wells plate to be used for epifluorescence microscope.

|
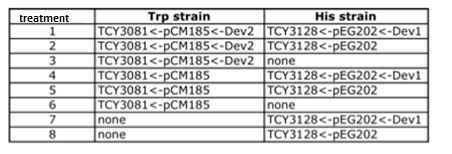
Table: Coculture planification for number 1.
 "
"


