Team:UC Chile/Results/Growthcurve
From 2012.igem.org
(Difference between revisions)
| (19 intermediate revisions not shown) | |||
| Line 1: | Line 1: | ||
{{UC_Chile4}} | {{UC_Chile4}} | ||
| - | |||
| - | + | <h2>Growth curve for Synechocystis PCC 6803</h2> | |
| - | |||
| - | + | While we managed to acquire an inoculum of Synechocystis PCC 6803, no conditions were set for working with Synechocystis PCC 6803 in our faculty. We proceeded to standardize our own growth conditions by building a custom made cyanobacterial incubator and setting the growth conditions based on what the majority of the literature specified () | |
<br> | <br> | ||
| + | Here we show our growth curve for Synechocystis PCC 6803 using the conditions set in our [[Team:UC_Chile2/DIY | DIY]] shaking incubator (40uE/s/m²), 90 RPM, 30°C. | ||
| + | <br> | ||
Methods for the growth curve characterization of Synechocystis PCC 6803 over [[Team:UC_Chile2/Protocols#SyneGrowth | here]]. | Methods for the growth curve characterization of Synechocystis PCC 6803 over [[Team:UC_Chile2/Protocols#SyneGrowth | here]]. | ||
| + | |||
<font size="3">Results</font> | <font size="3">Results</font> | ||
| + | |||
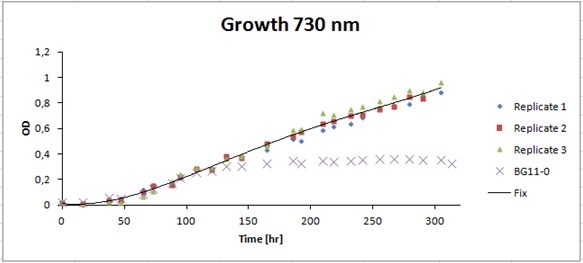
Model for Synechocystis growth at OD 600 nm and 730 nm | Model for Synechocystis growth at OD 600 nm and 730 nm | ||
| Line 19: | Line 21: | ||
After analyzing the experimental data, a polinomial growth model was obtained by function curve fitting. We used Excel's Solver tool for data processing | After analyzing the experimental data, a polinomial growth model was obtained by function curve fitting. We used Excel's Solver tool for data processing | ||
| - | Model at 600 nm : | + | Model at 600 nm : [[File:growth1curve1_uc_chile.jpg|center]] |
| + | |||
| - | |||
[[File: Figure for the growth curve.jpg| 500px |center]] | [[File: Figure for the growth curve.jpg| 500px |center]] | ||
| - | |||
| - | |||
| - | Exponential phase growth curve | + | Model at 730 nm : [[File:growth2curve1_uc_chile.jpg|center]] |
| + | |||
| + | |||
| + | [[File: Figure for the growth curve222.jpg| 500px |center]] | ||
| + | |||
| + | |||
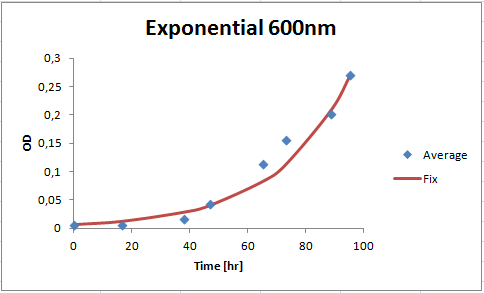
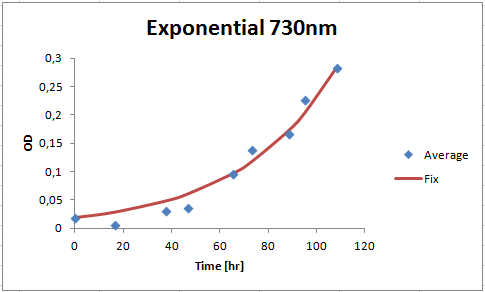
| + | <font size="3">Exponential phase growth curve</font> | ||
As we wanted to see the behaviour of cells in exponential phase, we analysed the part of the prior curves which best fitted the exponential function. We considered a first order kinetics growth. | As we wanted to see the behaviour of cells in exponential phase, we analysed the part of the prior curves which best fitted the exponential function. We considered a first order kinetics growth. | ||
| - | The expression that governs the exponential growth given by the expression: | + | The expression that governs the exponential growth is given by the expression: |
| - | + | [[File:growth3curve1_uc_chile.jpg|center]] | |
| - | + | Where [[File:xsubzero_uc_chile.jpg]] is the initial amount of bacteria, [[File:timetime.jpg]] is time and [[File:muuuuuu_uc_chile.jpg]]is the specific speed constant. | |
| + | |||
| + | Adjustment of [[File:muuuuuu_uc_chile.jpg]] parameter was obtained using Solver's algorithm of least squares. | ||
| + | |||
| + | Then we have these parameters for exponential growth at 600 nm and 730 nm | ||
| + | |||
| + | [[File:tableyadayadayadauc_chile.jpg|center]] | ||
Exponential growth at 600 nm | Exponential growth at 600 nm | ||
| + | |||
| + | [[File:growthdontrecall_uc_chile.jpg|center]] | ||
| + | |||
Exponential growth at 730 nm | Exponential growth at 730 nm | ||
| + | |||
| + | [[File:growthdontrecall2_uc_chile.jpg|center]] | ||
| + | |||
The exponential model allows us to express duplication time as the independent variable by equation rearragement. | The exponential model allows us to express duplication time as the independent variable by equation rearragement. | ||
| + | |||
| + | [[File:doubletimetime_uc_chile.jpg|center]] | ||
| + | |||
| + | This was the duplication time we obtained | ||
| + | |||
| + | [[File:doubletablegrowth_uc_chile.jpg|center]] | ||
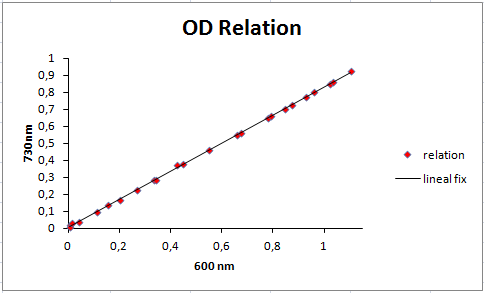
| - | Relation of measurements at 600 nm and 730 nm | + | <font size="3">Relation of measurements at 600 nm and 730 nm</font> |
In other data analysis, we wanted to check of we could move from one OD to the other. This is, that we can predict OD at 730 nm with 600 nm data. As it happens, this is possible and the linear model between measurements is given by | In other data analysis, we wanted to check of we could move from one OD to the other. This is, that we can predict OD at 730 nm with 600 nm data. As it happens, this is possible and the linear model between measurements is given by | ||
| - | + | [[File:linearodrel_uc_chile.jpg|center]] | |
| + | Where x is the OD measurement at 600 nm and y is the function of OD measurement at 730 nm. | ||
| + | [[File:lineargraphgrowth_uc_chile.jpg|center]] | ||
| + | <html> | ||
| + | <a href="https://2012.igem.org/Team:UC_Chile/Results/Int_C"><img src="https://static.igem.org/mediawiki/2012/a/ab/UC_Chile-Continue_button.jpg" align="right"> | ||
| + | </html> | ||
{{UC_Chilefooter}} | {{UC_Chilefooter}} | ||
Latest revision as of 01:18, 27 September 2012
 "
"


