Team:USTC-China/results
From 2012.igem.org
(Difference between revisions)
| Line 118: | Line 118: | ||
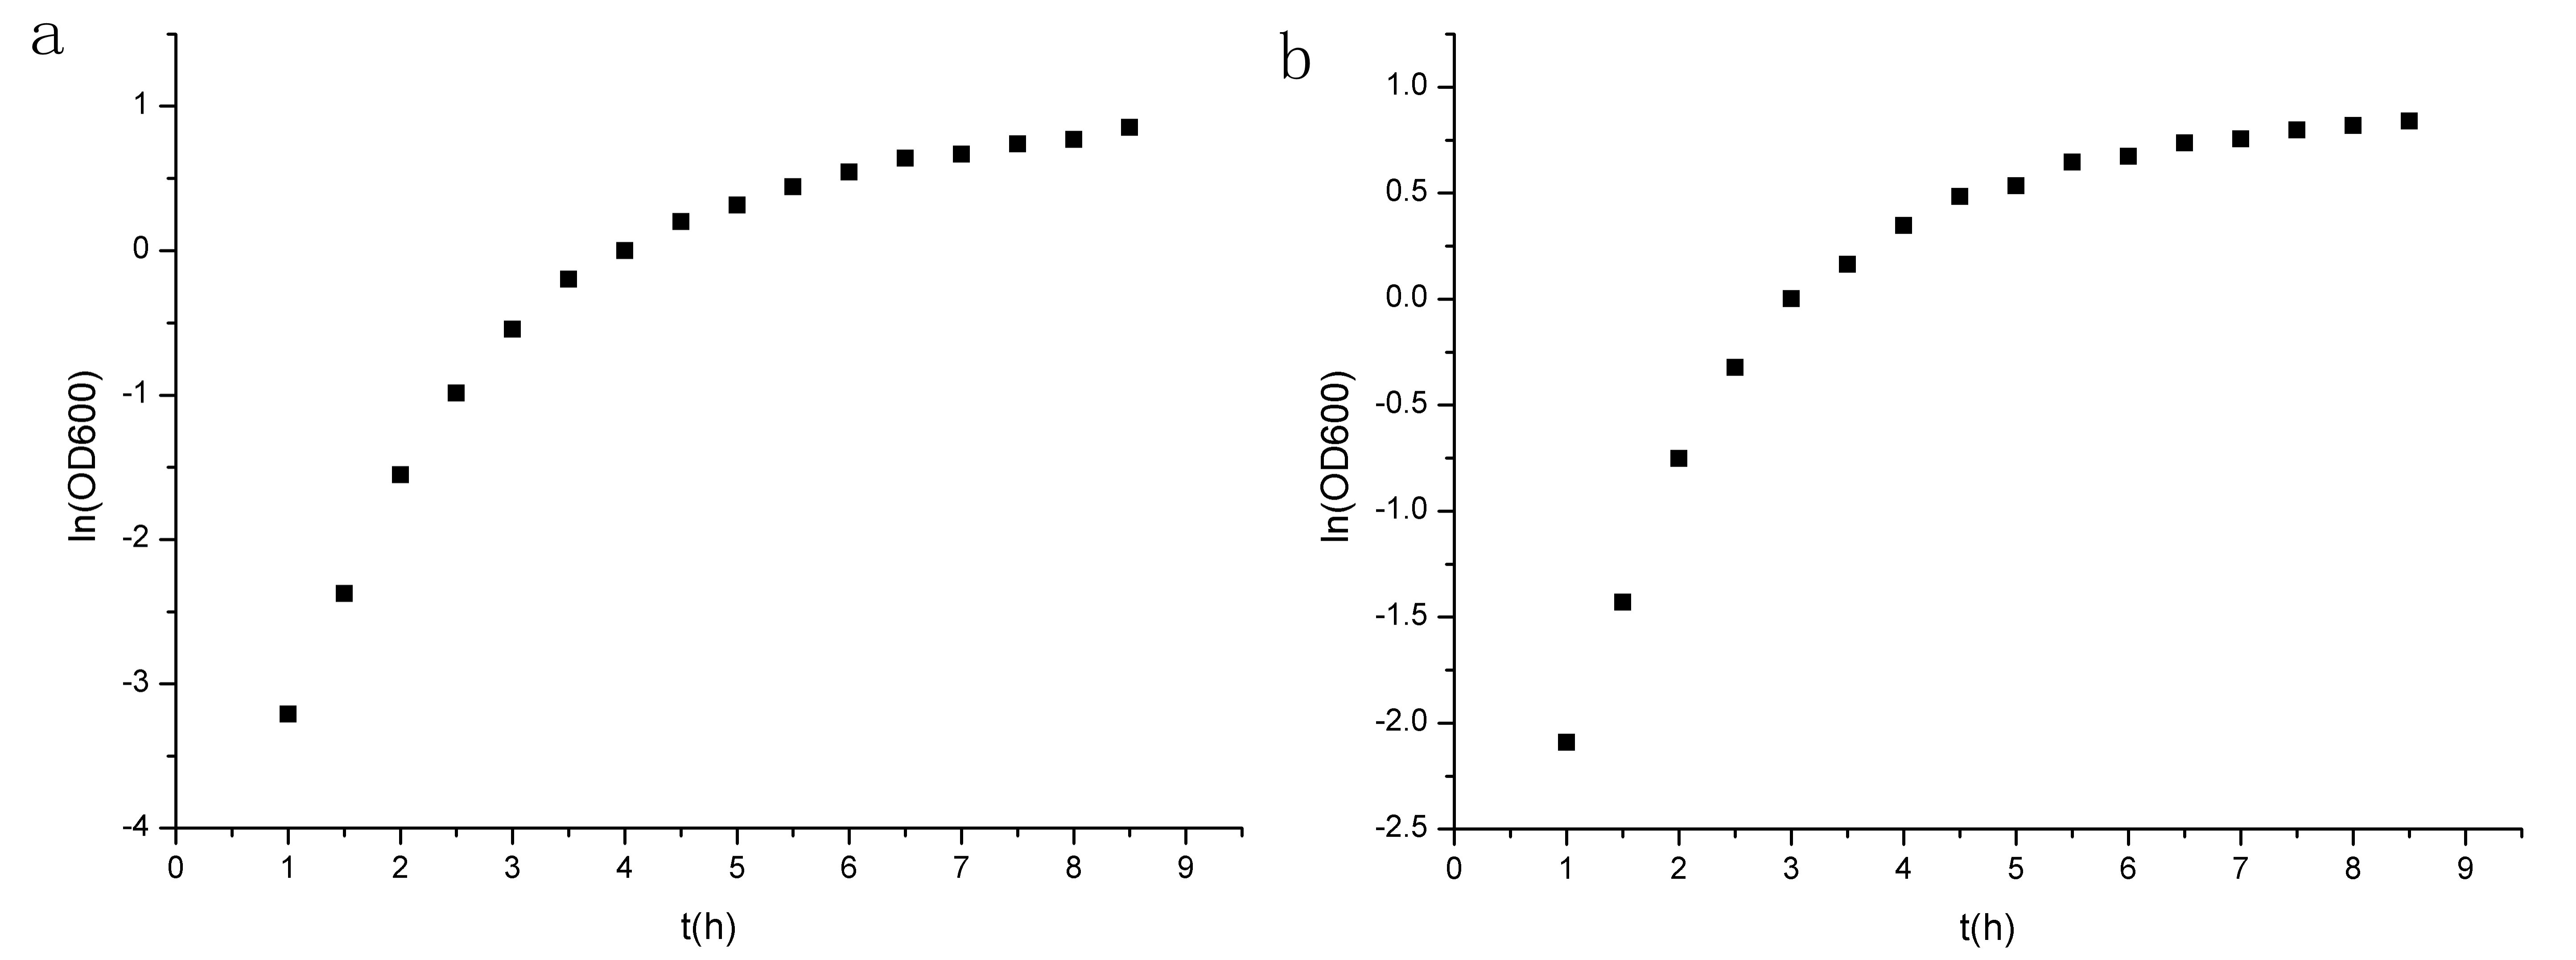
<a href="https://static.igem.org/mediawiki/2012/9/96/Points.jpg"><img src="https://static.igem.org/mediawiki/2012/9/96/Points.jpg" alt="Points" style="clear:both;width:750px;height:300px;"></a><br><small align="center">Figure 2 Points of ln(OD600) to t. (a)experiment group prm-anticro-prm-lysis (b)control group croGFP </small></div> | <a href="https://static.igem.org/mediawiki/2012/9/96/Points.jpg"><img src="https://static.igem.org/mediawiki/2012/9/96/Points.jpg" alt="Points" style="clear:both;width:750px;height:300px;"></a><br><small align="center">Figure 2 Points of ln(OD600) to t. (a)experiment group prm-anticro-prm-lysis (b)control group croGFP </small></div> | ||
| - | <p>We select the four data points and do linear fit. Then we can get μ<sub>m</sub> | + | <p>We select the four data points and do linear fit. Then we can get μ<sub>m,exp</sub>(experimental group) and μ<sub>m,ctrl</sub>(control group).</p> |
<div class="imgholder1" align="center" style="width:750px;height:auto;"> | <div class="imgholder1" align="center" style="width:750px;height:auto;"> | ||
<a href="https://static.igem.org/mediawiki/2012/0/0a/Fitlysis01.png"><img src="https://static.igem.org/mediawiki/2012/0/0a/Fitlysis01.png" alt="Fitlysis01" style="clear:both;width:750px;height:300px;"></a><br><small align="center">Figure 3 Linear fit of ln(OD600) to t. (a)experiment group prm-anticro-prm-lysis (b)control group croGFP</small></div> | <a href="https://static.igem.org/mediawiki/2012/0/0a/Fitlysis01.png"><img src="https://static.igem.org/mediawiki/2012/0/0a/Fitlysis01.png" alt="Fitlysis01" style="clear:both;width:750px;height:300px;"></a><br><small align="center">Figure 3 Linear fit of ln(OD600) to t. (a)experiment group prm-anticro-prm-lysis (b)control group croGFP</small></div> | ||
| + | <br/> | ||
<br/> | <br/> | ||
<table border="1" style="text-align:center;"> | <table border="1" style="text-align:center;"> | ||
| Line 152: | Line 153: | ||
<small>Table 1 Results of linear fit of ln(OD600) to t.</small> | <small>Table 1 Results of linear fit of ln(OD600) to t.</small> | ||
<br /> | <br /> | ||
| - | <p>Our data shows that μ<sub>m</sub> | + | <p>Our data shows that μ<sub>m,exp</sub>(experimental group) is even more than μ<sub>m, ctrl</sub>(control group).Then we can conclude that our circuit is stable in usual conditions. Users need not worry about the condition that bacteria may die when nothing is happening.</p> |
<br /> | <br /> | ||
Revision as of 17:27, 25 September 2012
RESULTS
 "
"


