 "
"
Team:USTC-China/results
From 2012.igem.org
| Line 105: | Line 105: | ||
<div class="imgholder1" align="left" style="float:right;width:700px;height:auto;"> | <div class="imgholder1" align="left" style="float:right;width:700px;height:auto;"> | ||
| - | <a href="https://static.igem.org/mediawiki/2012/b/b1/Curve.jpg"><img src="https://static.igem.org/mediawiki/2012/b/b1/Curve.jpg" alt="Curve" style="clear:both;width:750;height:300px;"></a><br><small align="center">Figure 1 Growth curve of the two groups. (a)experiment group prm-anticro-prm-lysis (b)control group croGFP</small> | + | <a href="https://static.igem.org/mediawiki/2012/b/b1/Curve.jpg"><img src="https://static.igem.org/mediawiki/2012/b/b1/Curve.jpg" alt="Curve" style="clear:both;width:750;height:300px;"></a><br><small align="center">Figure 1 Growth curve of the two groups. (a)experiment group prm-anticro-prm-lysis (b)control group croGFP</small></div> |
<div class="imgholder1" align="left" style="float:right;width:700px;height:auto;"> | <div class="imgholder1" align="left" style="float:right;width:700px;height:auto;"> | ||
| - | <a href="https://static.igem.org/mediawiki/2012/9/96/Points.jpg"><img src="https://static.igem.org/mediawiki/2012/9/96/Points.jpg" alt="Points" style="clear:both;width:750;height:300px;"></a><br><small align="center">Figure 2 Points of ln(OD600) to t. (a)experiment group prm-anticro-prm-lysis (b)control group croGFP </small> | + | <a href="https://static.igem.org/mediawiki/2012/9/96/Points.jpg"><img src="https://static.igem.org/mediawiki/2012/9/96/Points.jpg" alt="Points" style="clear:both;width:750;height:300px;"></a><br><small align="center">Figure 2 Points of ln(OD600) to t. (a)experiment group prm-anticro-prm-lysis (b)control group croGFP </small></div> |
<p>We select the four data points and do linear fit.Then we can get μm,exp(experimental group) and μm,ctrl(control group).</p> | <p>We select the four data points and do linear fit.Then we can get μm,exp(experimental group) and μm,ctrl(control group).</p> | ||
<div class="imgholder1" align="left" style="float:right;width:700px;height:auto;"> | <div class="imgholder1" align="left" style="float:right;width:700px;height:auto;"> | ||
| - | <a href="https://static.igem.org/mediawiki/2012/0/0a/Fitlysis01.png"><img src="https://static.igem.org/mediawiki/2012/0/0a/Fitlysis01.png" alt="Fitlysis01" style="clear:both;width:750;height:300px;"></a><br><small align="center">Figure 3 Linear fit of ln(OD600) to t. (a)experiment group prm-anticro-prm-lysis (b)control group croGFP</small> | + | <a href="https://static.igem.org/mediawiki/2012/0/0a/Fitlysis01.png"><img src="https://static.igem.org/mediawiki/2012/0/0a/Fitlysis01.png" alt="Fitlysis01" style="clear:both;width:750;height:300px;"></a><br><small align="center">Figure 3 Linear fit of ln(OD600) to t. (a)experiment group prm-anticro-prm-lysis (b)control group croGFP</small></div> |
| - | </div | + | |
<table border="1" style="text-align:center;"> | <table border="1" style="text-align:center;"> | ||
<tr> | <tr> | ||
Revision as of 15:12, 23 September 2012

RESULTS

Stability of Our System
Stability is particularly important to our system because we have lysis gene in it.If not,cells die easily and the system will go to crash soon.The practicability demands that our engineered bacteria won't die too much to influence the daily manufacture under normal conditions.To prove this,we did experiments and here are our results.
We measured the growth curve of our engineered E.coli strain with part pRM-anticro-pRM-lysis on plasmid pSB1C3 which is our final circuit and an E.coli strain with part croGFP on plasmid pSB1C3 which hardly influence the growth as the control group.It is known that the growth curve obey the model:
x is the concentration of microbe.x0 is the initial concentration when t=t0.μm is the natural growth rate.
Calculate the natural logarithm of both side of the equation,we can get:
Obviously,the variable lnx is
linear to the variable t.And the slope is μm.
We calculate the natural logarithm of OD600 data we get and do linear fit to the data.Then we get the slope which is the natural growth rate μm.
We assume that μm can reflect the rate of cells death caused by the basic expression of lysis.If the death effect can't be ignored,the value of μm obtained from the experimental group will be obviously less than the control group.
The growth curve(fig.1) seems not so typical,probably because the bacteria may sense the environmental press at early stage.But since the two curve is similar,we can assert that our circuit is not the cause of the difference.Analyzing the two figures(fig.1&fig.2),we can see the first four data points lie in the logarithmic phase,and the ln(OD600) is linear to t(time).

Figure 1 Growth curve of the two groups. (a)experiment group prm-anticro-prm-lysis (b)control group croGFP
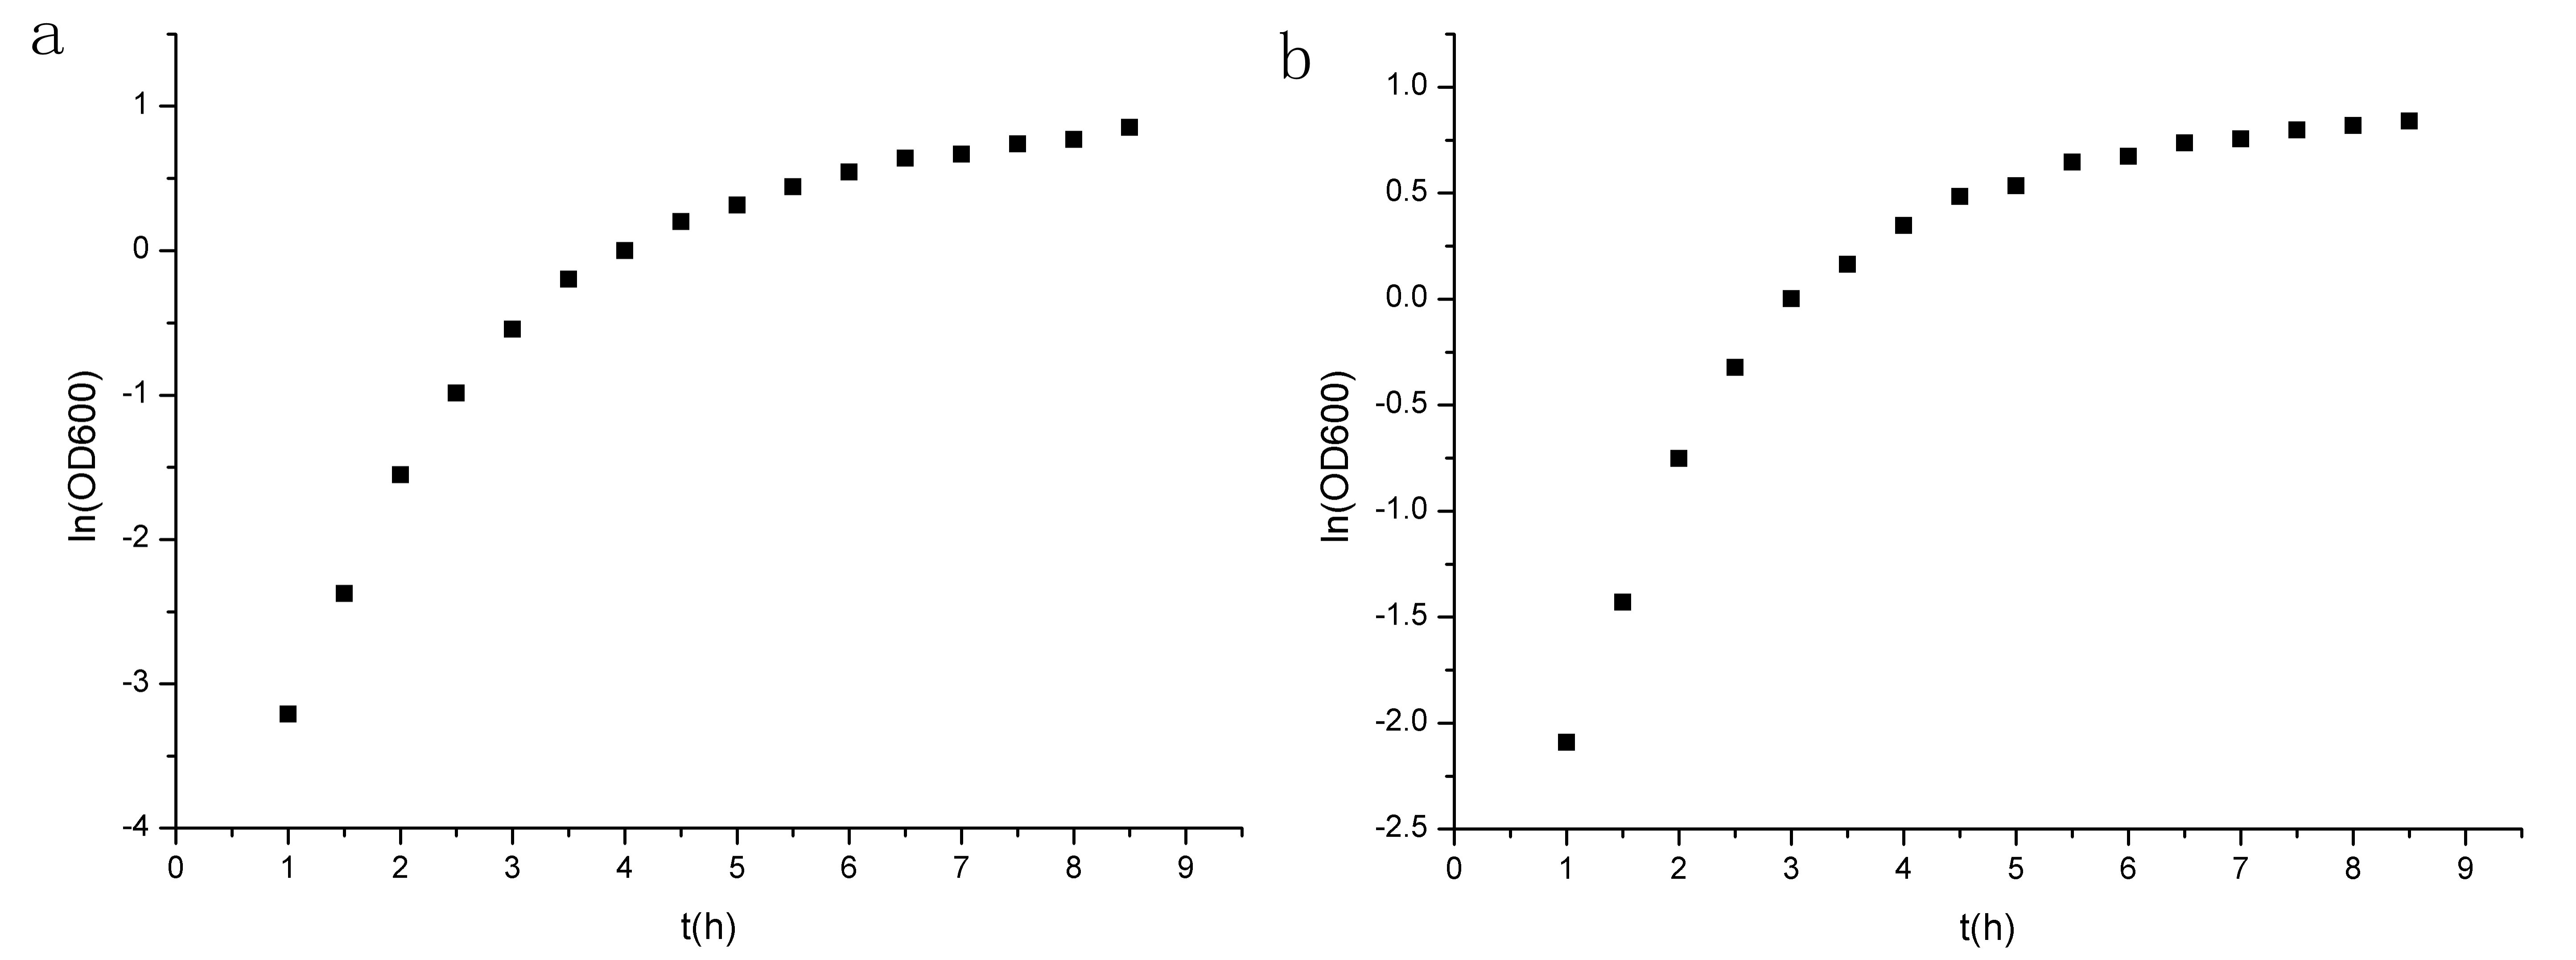
Figure 2 Points of ln(OD600) to t. (a)experiment group prm-anticro-prm-lysis (b)control group croGFP
We select the four data points and do linear fit.Then we can get μm,exp(experimental group) and μm,ctrl(control group).

Figure 3 Linear fit of ln(OD600) to t. (a)experiment group prm-anticro-prm-lysis (b)control group croGFP
| experiment group | control group | |||
| Value | Standard Error | Value | Standard Error | |
| Slope,μm | 1.49914 | 0.08934 | 1.1957 | 0.08237 |
| Adj. R-Square | 0.98942 | 0.9859 | ||
Our data shows that μm,exp(experimental group) is even more than μm,ctrl(control group).Then we can conclude that our circuit is stable in usual conditions.Users need not worry about the condition that bacteria may die when nothing is happening.