Overview
Spider dragline silk is an exceptionally strong and elastic fiber and is an ideal material for numerous biomedical and industrial applications. In this secondary project we developed a novel secretion system that allows to export proteins to the extracellular medium and added the first spider-silk biobrick to the Registry. This biobrick contains the synthetic silk gene ADF-3 from the orb weaving spider Araneus diadematus.</p>
Introduction
Spider dragline silk is an exceptionally strong and elastic biomaterial and one of the strongest natural fibers known. It is five times stronger by weight than steel and three times tougher than the top quality man-made fiber Kevlar [1]. That’s why is referred to as “biosteel”. Furthermore, this material is biocompatible, biodegradable and has potential for processing in aqueous solution under ambient conditions.
These properties make the spider silk an ideal material for numerous industrial applications such as bullet-proof vests, parachutes, seat belts and composite materials in aircraft, and a promising substance for biomedical applications such as drug delivery systems and scaffolds for tissue engineering.
The excellent mechanical properties and low immunogenicity of spider webs have fascinated the man for thousands of years, but unfortunately large scale farming of spiders is not convenient because of the highly territorial and aggressive character of these arthropods. Synthetic spider silk production is a promising way to make use of this exceptional biomaterial.
Construct: a novel secretion system
Working Plasmid
This is an intermediate plasmid that we used to build the GFP Reporter Plasmid an the Protease Producer Plasmid.
GFP Reporter Plasmid
The description of the mechanism of this construct is explained in the animation below.
Protease Producer Plasmid
This construct induces the expression of the HIV protease.
Animation describing the first secretion system

Click here to open this animation from the begining in a new tab
Results
Experiment 1
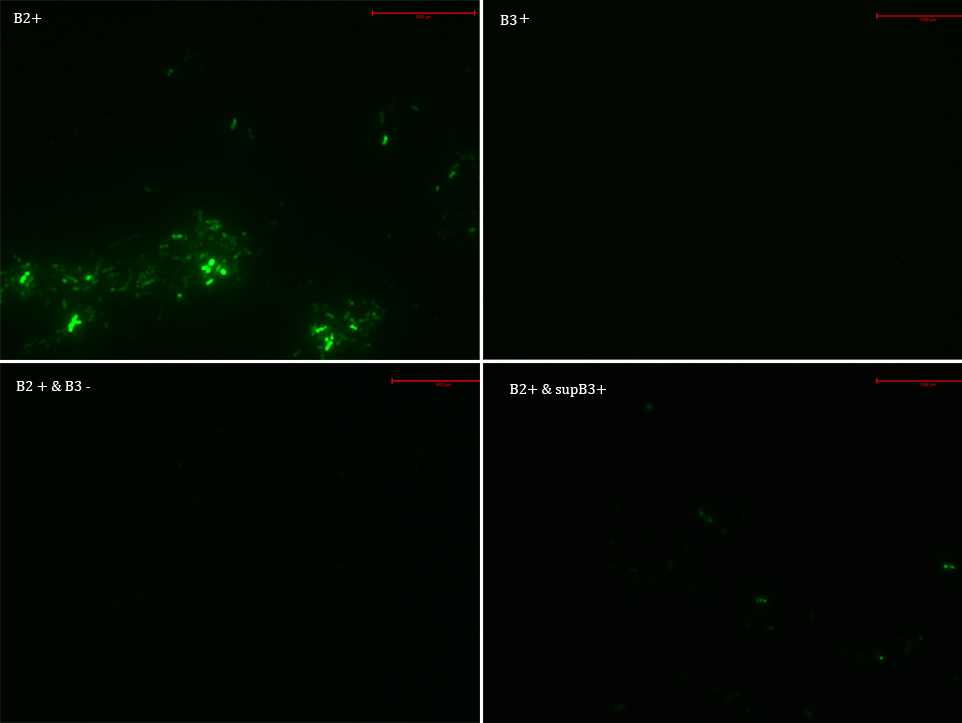
We transformed E. Coli with our GFP Reporter Plasmid (B2) and with the Protease Producer Plasmid (B3). We did a little experiment with those bacteria.
The following samples were prepared:
B2
B2+
B2+ & B3
B2+ & supB3
Nomenclature
B2- (coli transformed with GFP Reporter Plasmid)
B2+ (coli transformed with GFP Reporter Plasmid, induced with Arabinose)
B3+ (coli transformed with Protease Producer Plasmid, induced with Arabinose)
supB3+ (supernatant of coli transformed with Protease Producer Plasmid induced with Arabinose)
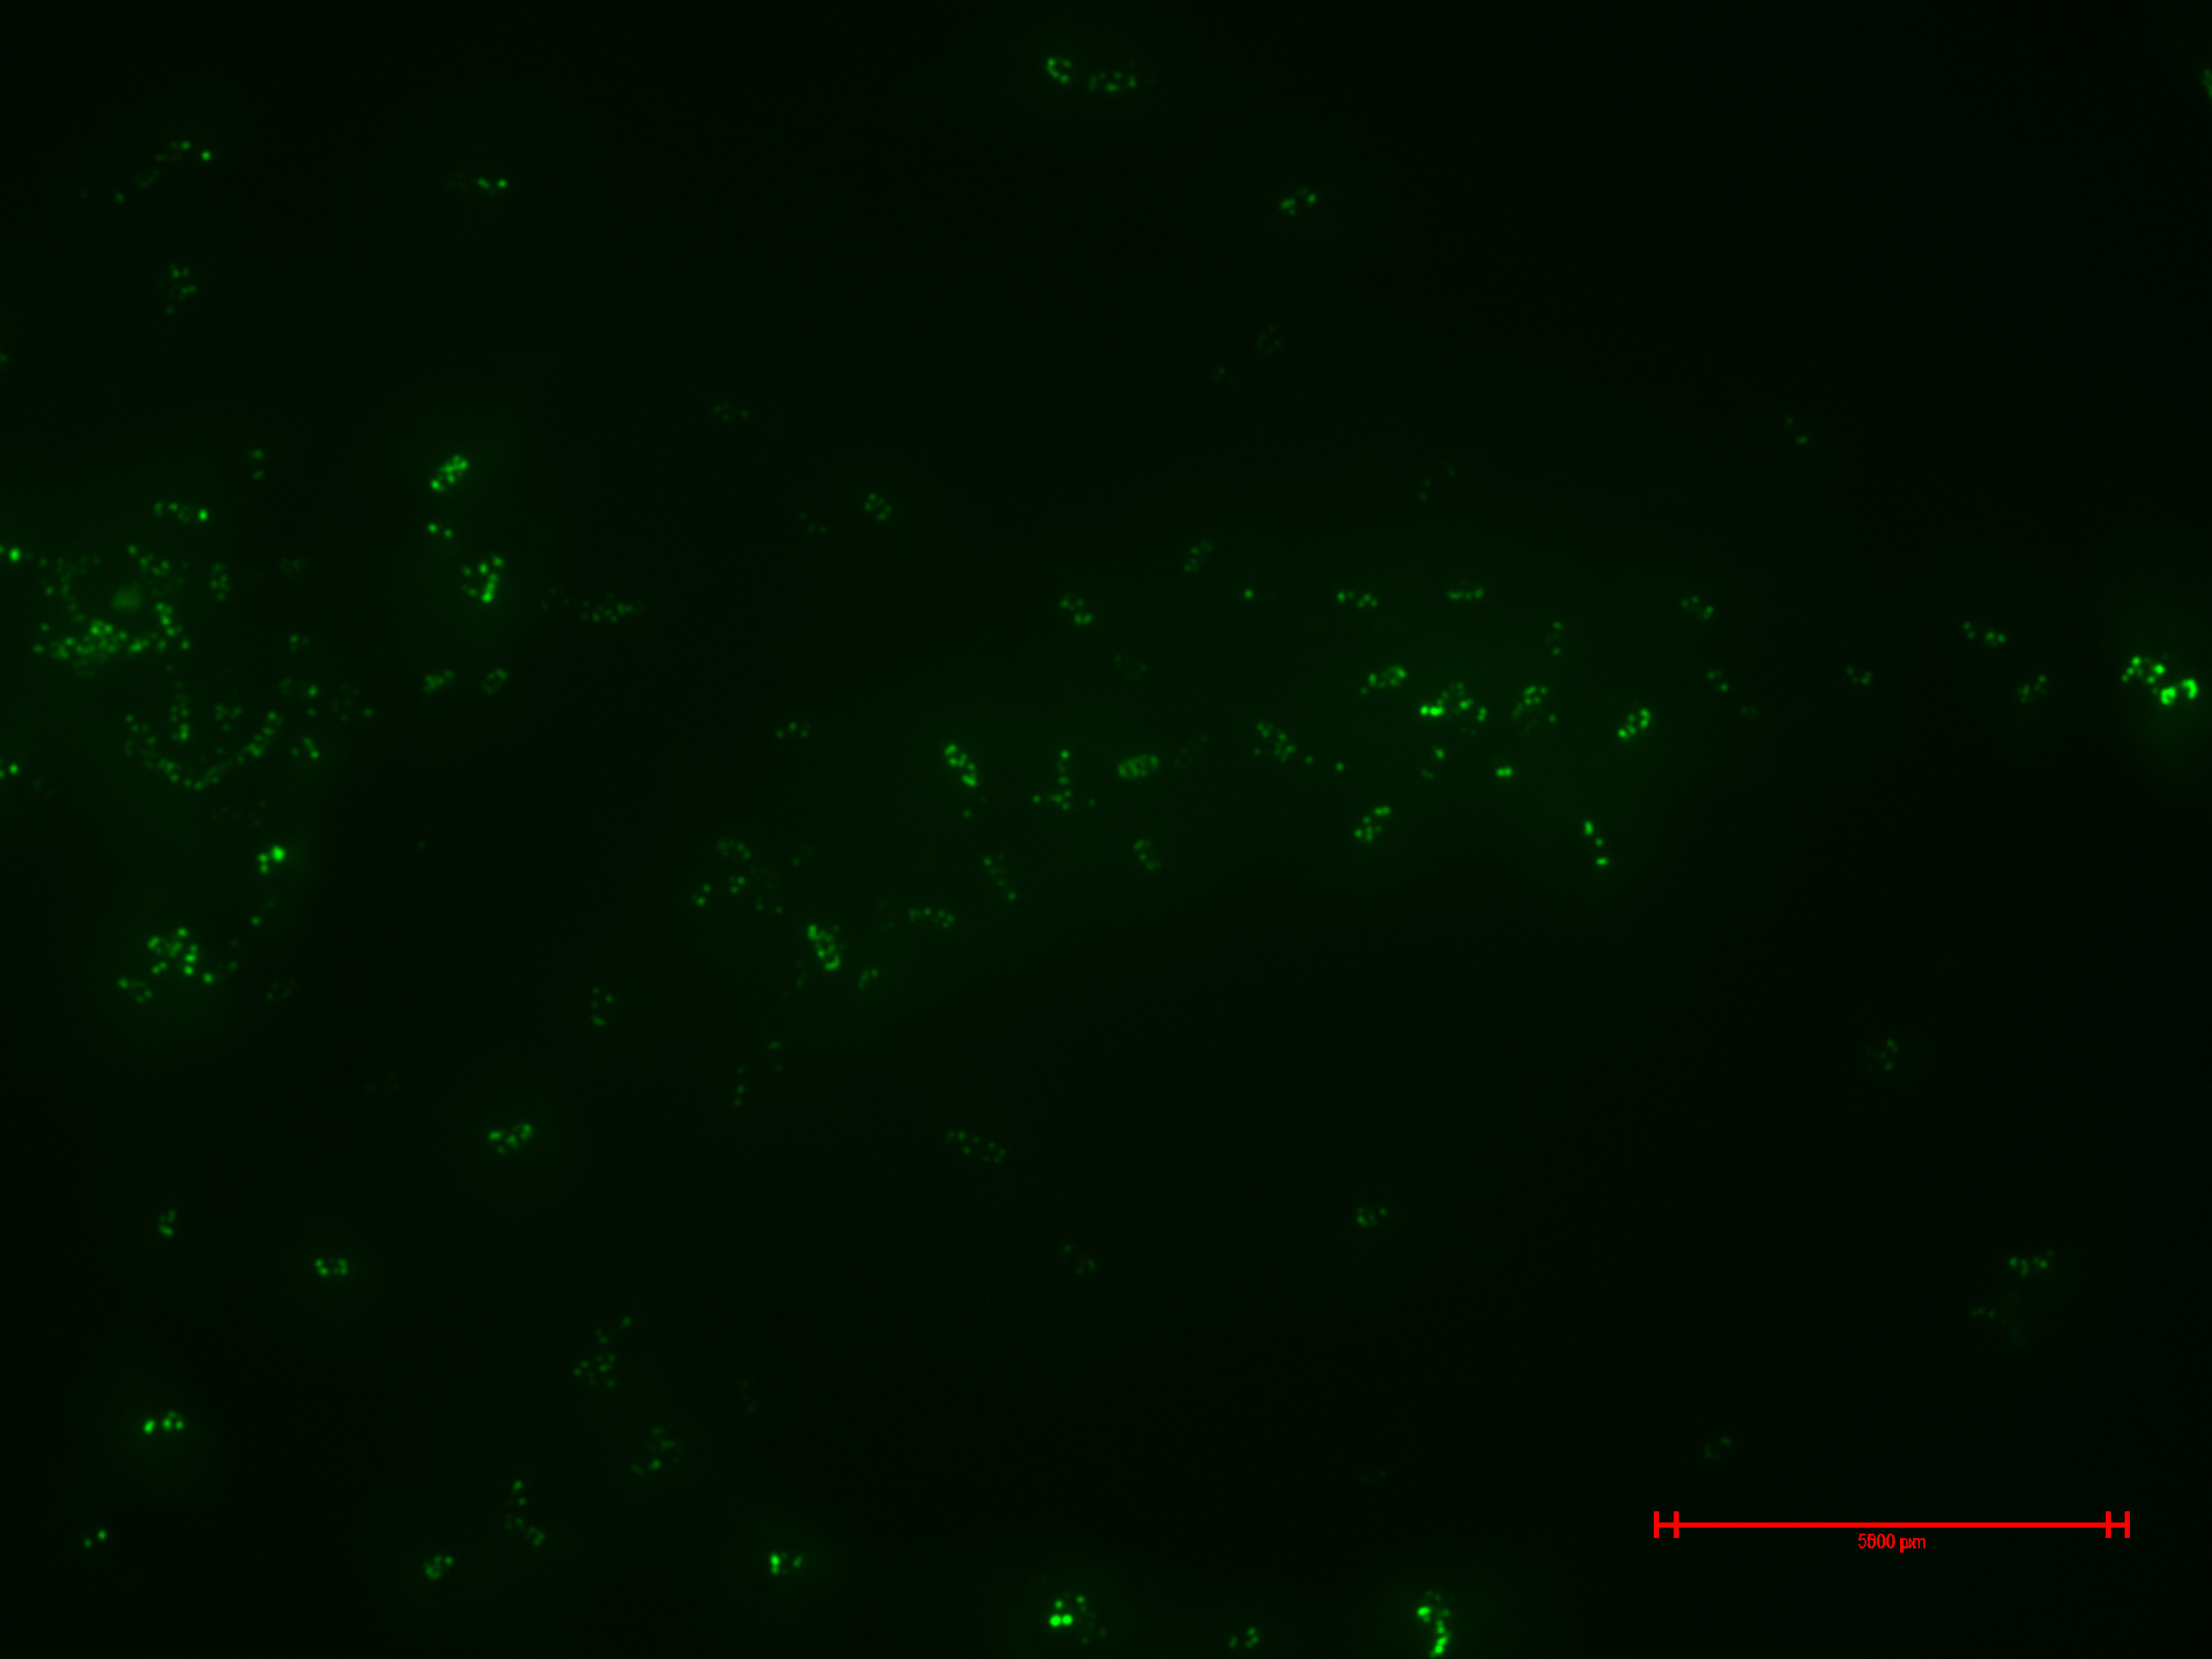
Then we observed each sample with an epifluorescence microscope. The results were promising. B2- did not express sfGFP, but B2+ did. Additionally, in both cases (B2+ & B3) and (B2+ & supB3) the fluorescence of sfGFP disappeared almost completely.
Experiment 2
We prepared for second time samples of B2+ & B3+ to observe in the epifluorescence microscope the effect of time in the samples.
This time B2+ & B3+ presented much more fluorescence, and it persisted over time (at least 1 hour with no significant variation).
Experiment 3
We did another experiment to investigate the interactions between our bacteria B2+ and B3, but this time with a serious protocol and recording the data for later analysis.
We expected that our results were coherent with our theory. [1]. Both HIV protease and protease K should be able to cut the HIV cleavage site, releasing the sfGFP.
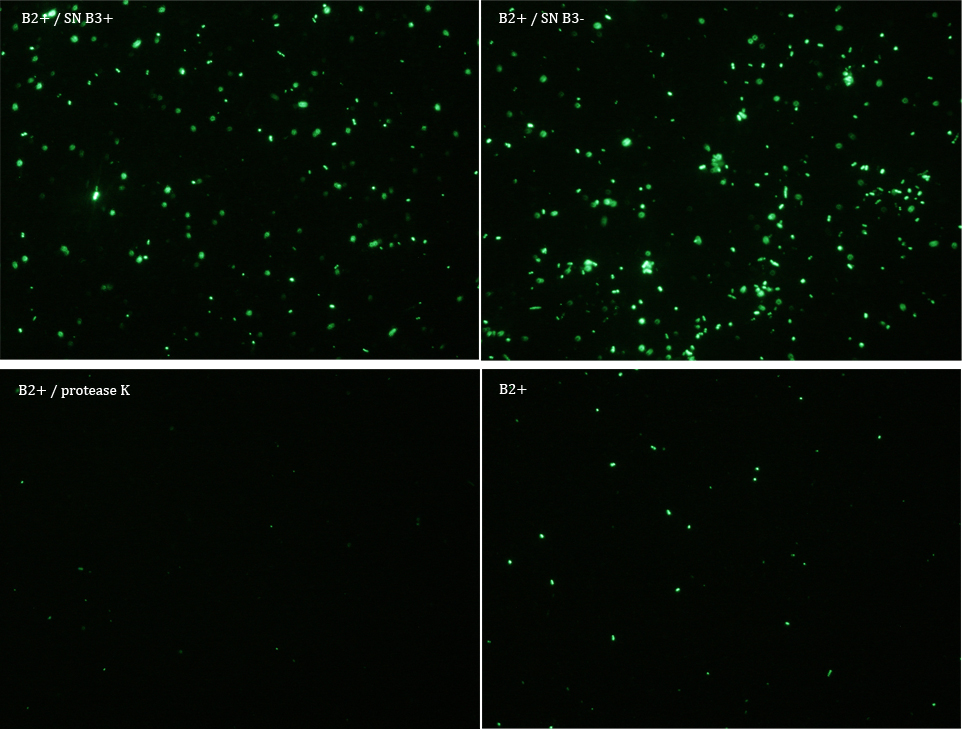
The samples used this time were:
B2+ :
E. coli transformed with GFP Reporter Plasmid and induced with Arabinose
B2+ / SN B3+ :
E. coli transformed with GFP Reporter Plasmid and induced with Arabinose, and Supernatant of coli transformed with Protease Producer Plasmid induced with Arabinose
B2+ / SN B3- :
E. coli transformed with GFP Reporter Plasmid and induced with Arabinose, and Supernatant of coli transformed with Protease Producer Plasmid not induced with Arabinose
B2+ / protease K :
E. coli transformed with GFP Reporter Plasmid and induced with Arabinose, and protease K.
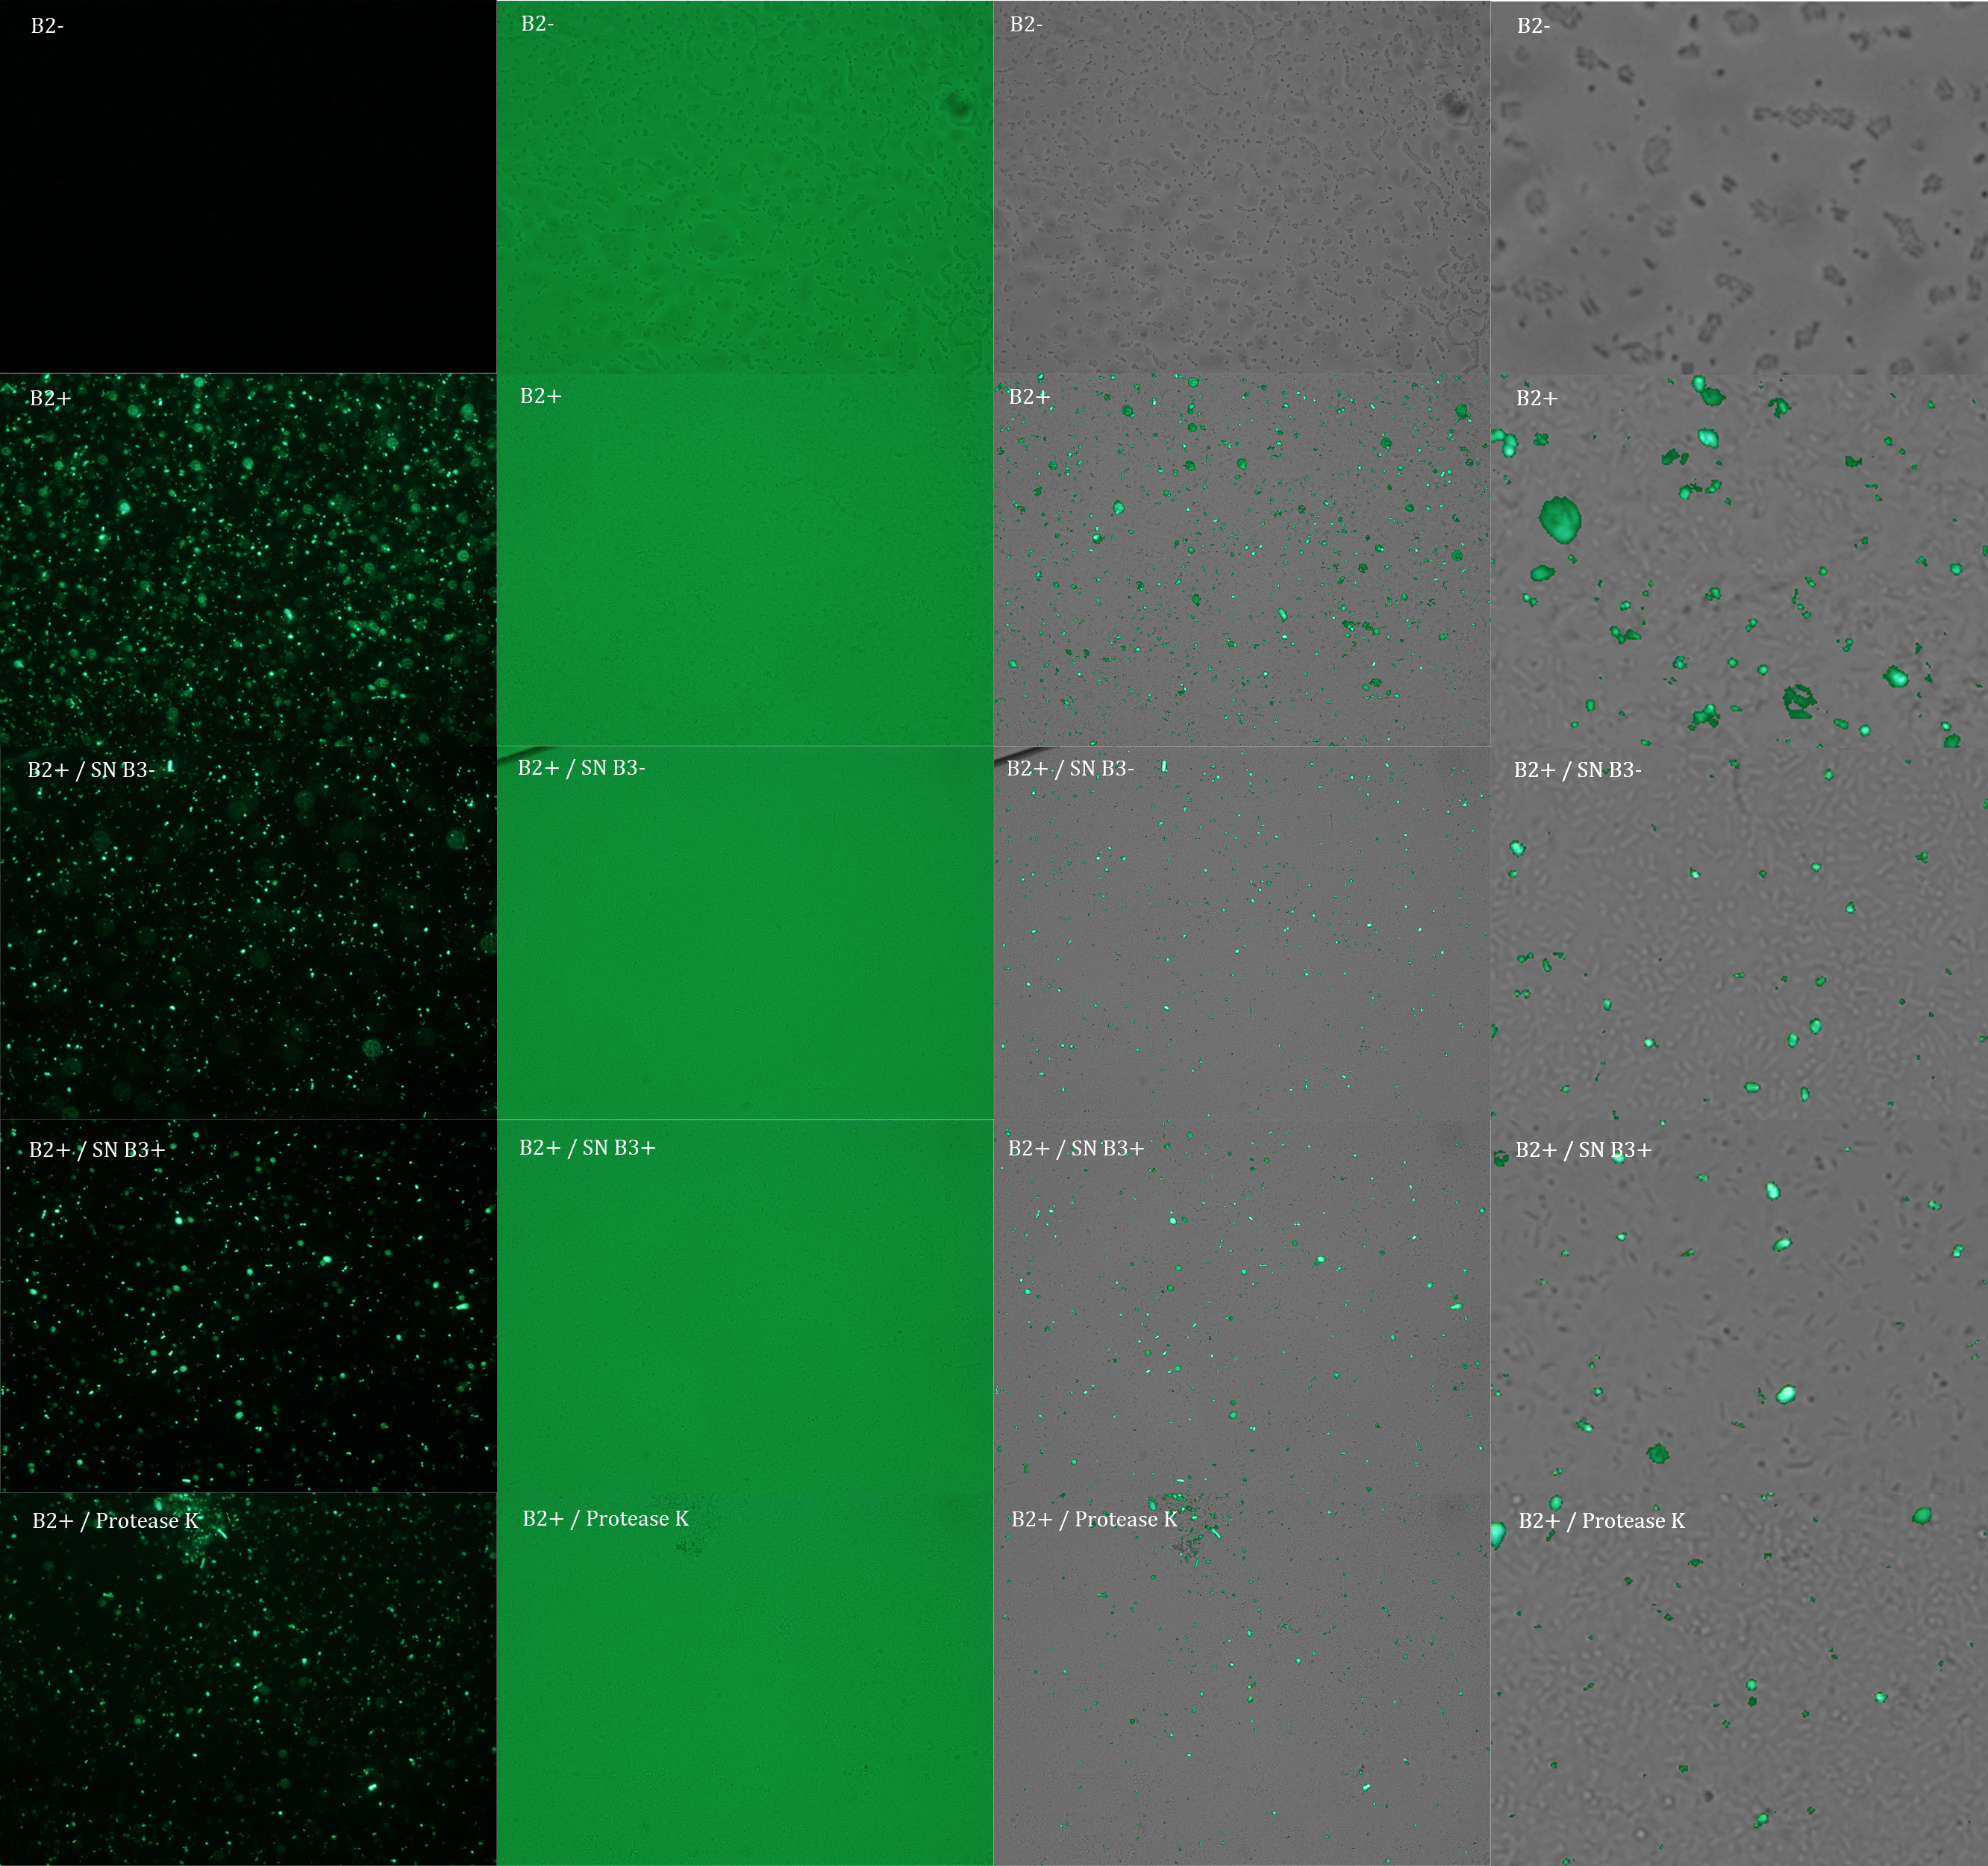
Subsequently we proceeded to observe the samples in an epifluorescence microscope. In the following figure you can see one micrograph of each sample at 100x.
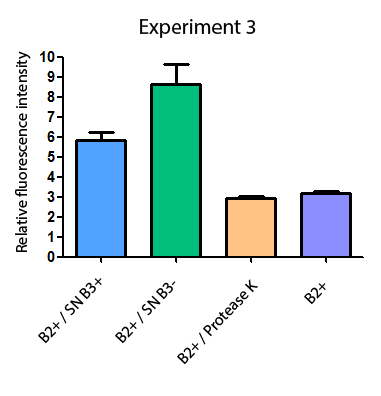
Additionally, we analyzed 4 micrographs of each sample (n=4) with the software ImageJ to compare their fluorescence intensity.
All the different treatments presented significant differences, except (B2+ & protease K) and (B2+). Remarkable is the difference between (B2+ / SN B3+) and (B2+ / NS B3-). Also, the direct application of protease K over the samples decreased even more the fluorescence. However, the low fluorescence of B2+ is very weird. We will have to repeat this experiment, but at least the major part of the results makes is what we expected.
Experiment 4
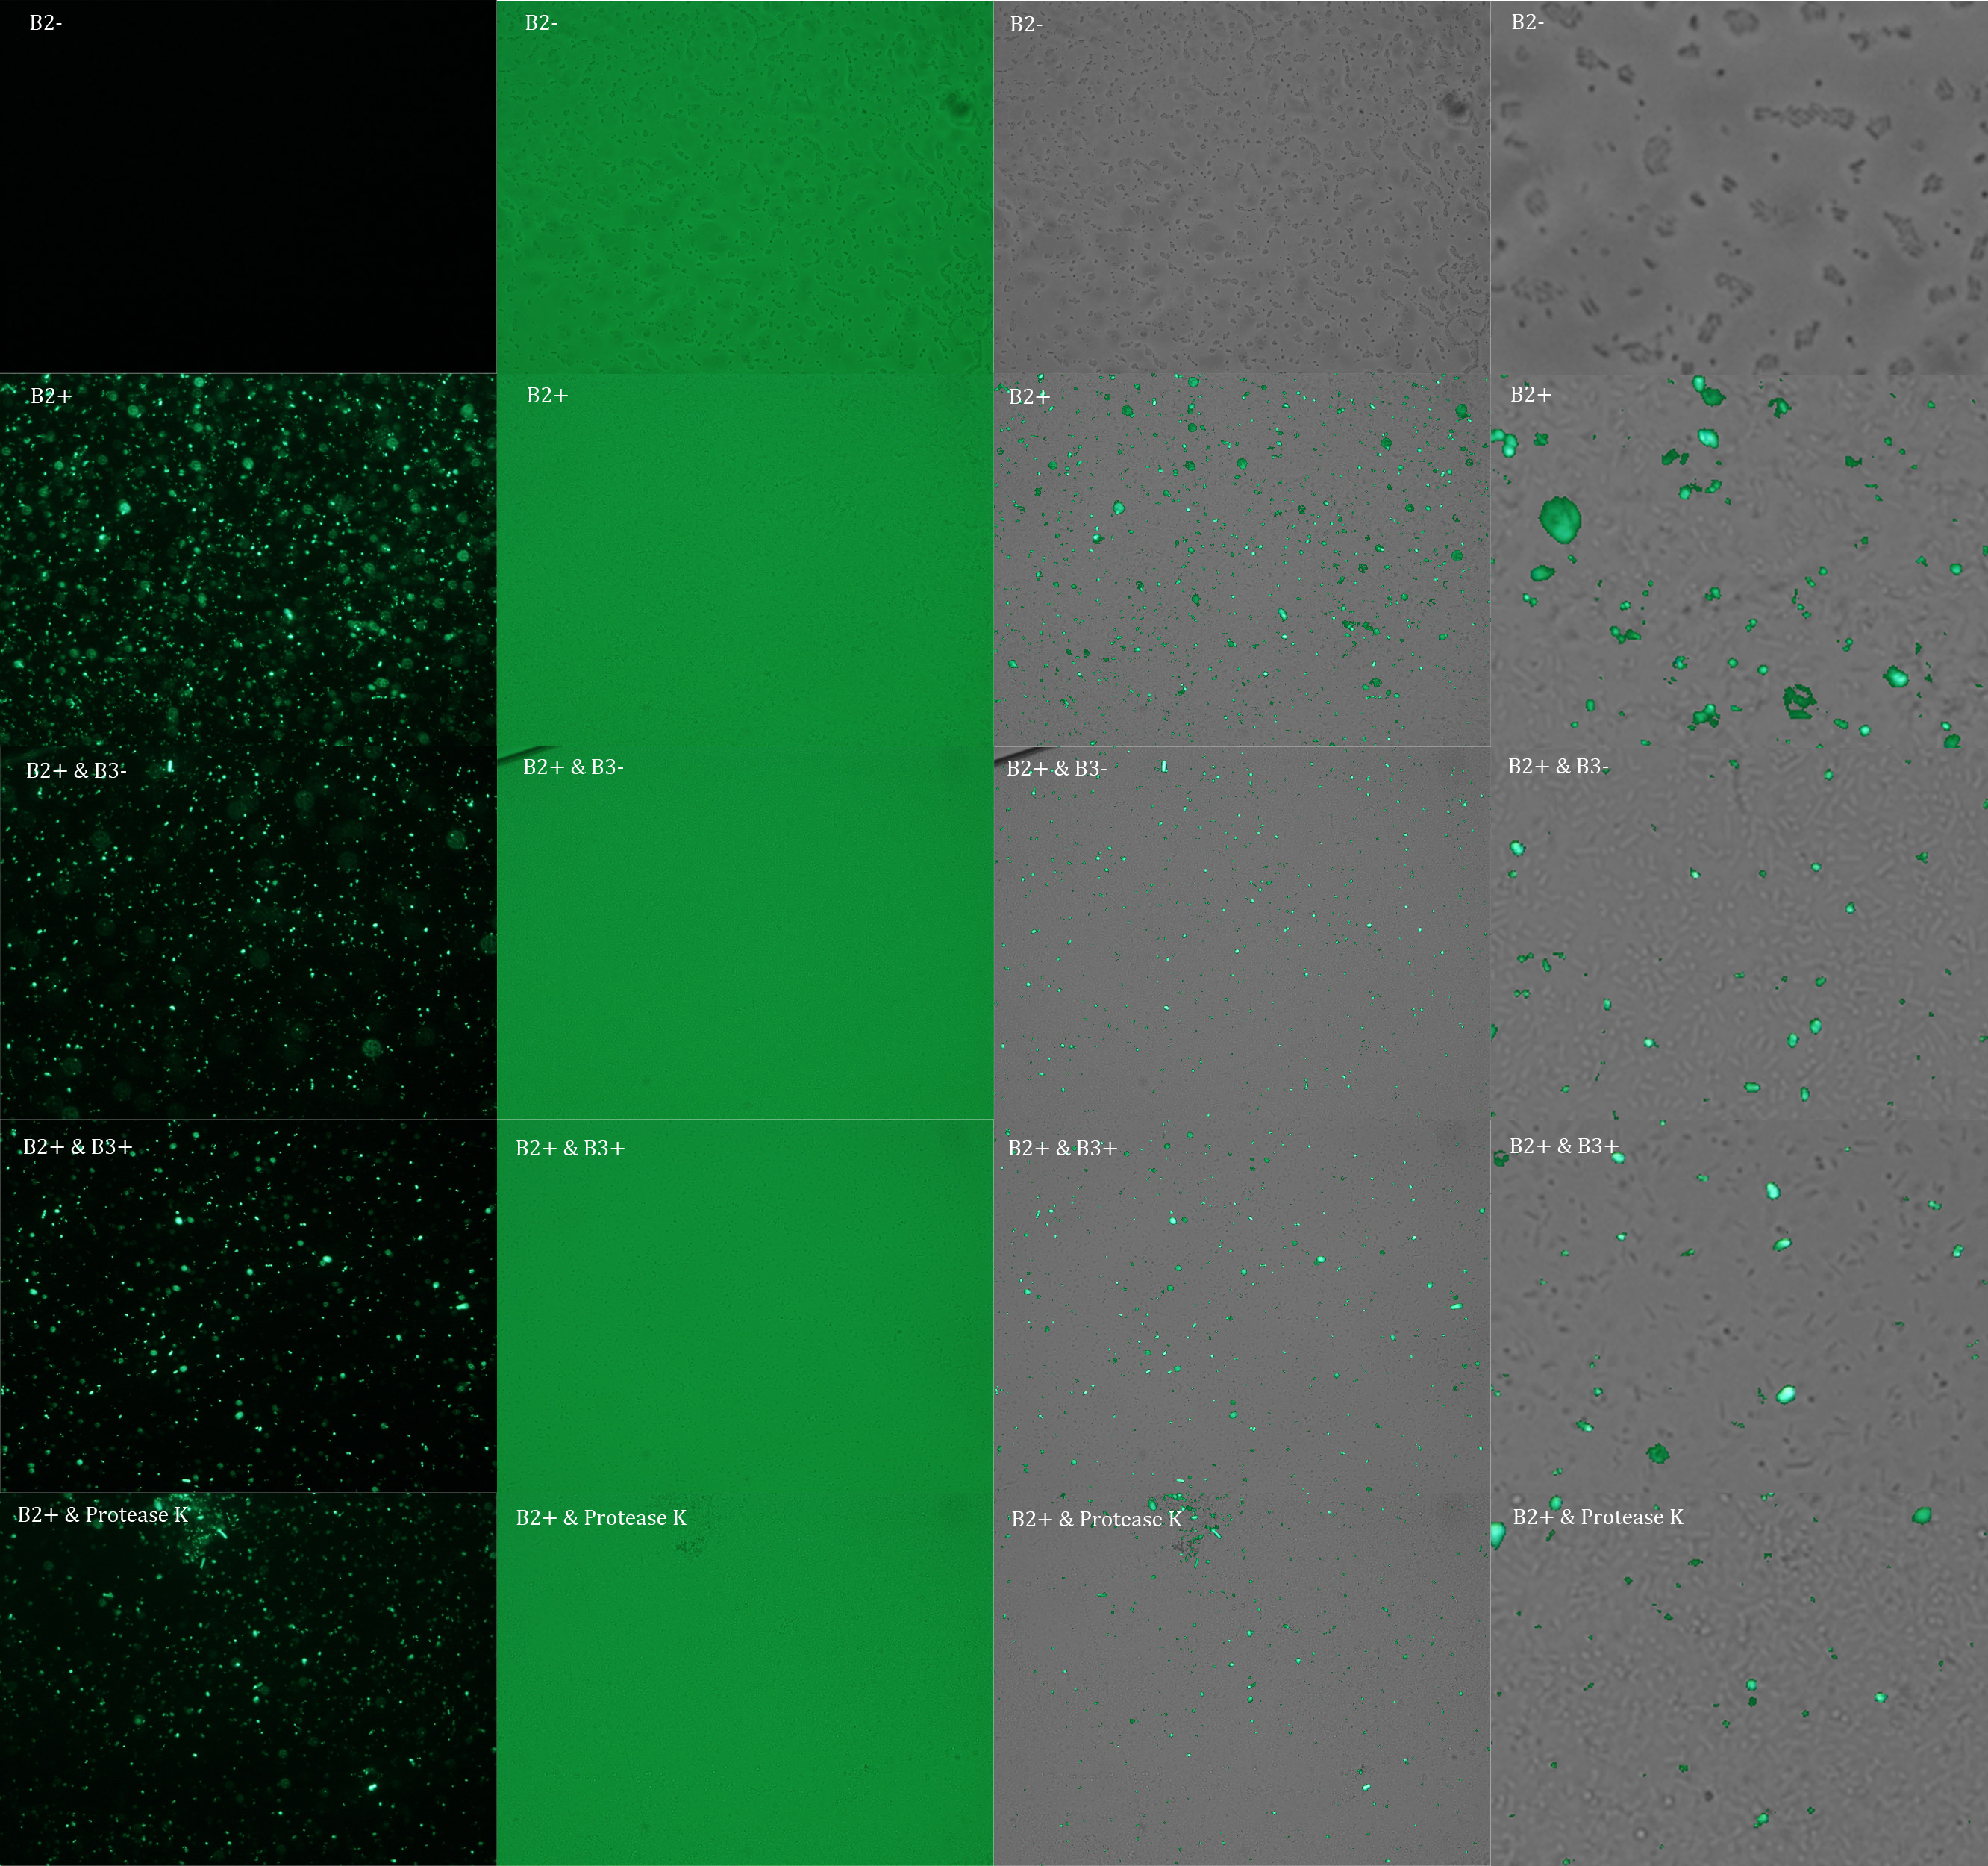
We repeated the experiment to investigate the interactions between our bacteria B2+ and B3+ with a serious protocol and recording the data for later analysis. This time we added the control B2-.
In the following figure you can see one micrograph of each sample at 100x obtained from a fluorescence microscope.
In the figure each row represents one sample. The first row contains the micragraphs with UV filter. The second row contains the micrographs seen with light. The third row contains the previous micragraphs overlayed (the light image is in grayscale, and the UV image has its black background removed). The forth image is an amplification of the third image (1:4 ratio). Click over the image to open it in a higher resolution.
Additionally, we analyzed 4 UV micrographs of each sample (n=4) with the software ImageJ
The results were quite different compared to the ones of our previous experiment. Remarkable is that, as expected, B2- and B2+ present the lowest and highest fluorescence intensity. Additionally, (B2+ & B3+) and (B2+ & Protease K) present very similar fluorescence. However, for second time we obtained a weird result: (B2+ & B3+) and (B2+ & B3-) present the same amount of fluorescence.
In conclusion, we know that sfGFP expresses in our e. coli. But we don’t know if it is attached to the external side of the membrane, or if the HIV-1 protease works as expected. As this secretion system seems to be failing, we chose to try other alternatives.
 "
"


