Team:USTC-China/results
From 2012.igem.org
(Difference between revisions)
| Line 102: | Line 102: | ||
<p>We assume that μm can reflect the rate of cells death caused by the basic expression of lysis.If the death effect can't be ignored,the value of μm obtained from the experimental group will be obviously less than the control group.</p> | <p>We assume that μm can reflect the rate of cells death caused by the basic expression of lysis.If the death effect can't be ignored,the value of μm obtained from the experimental group will be obviously less than the control group.</p> | ||
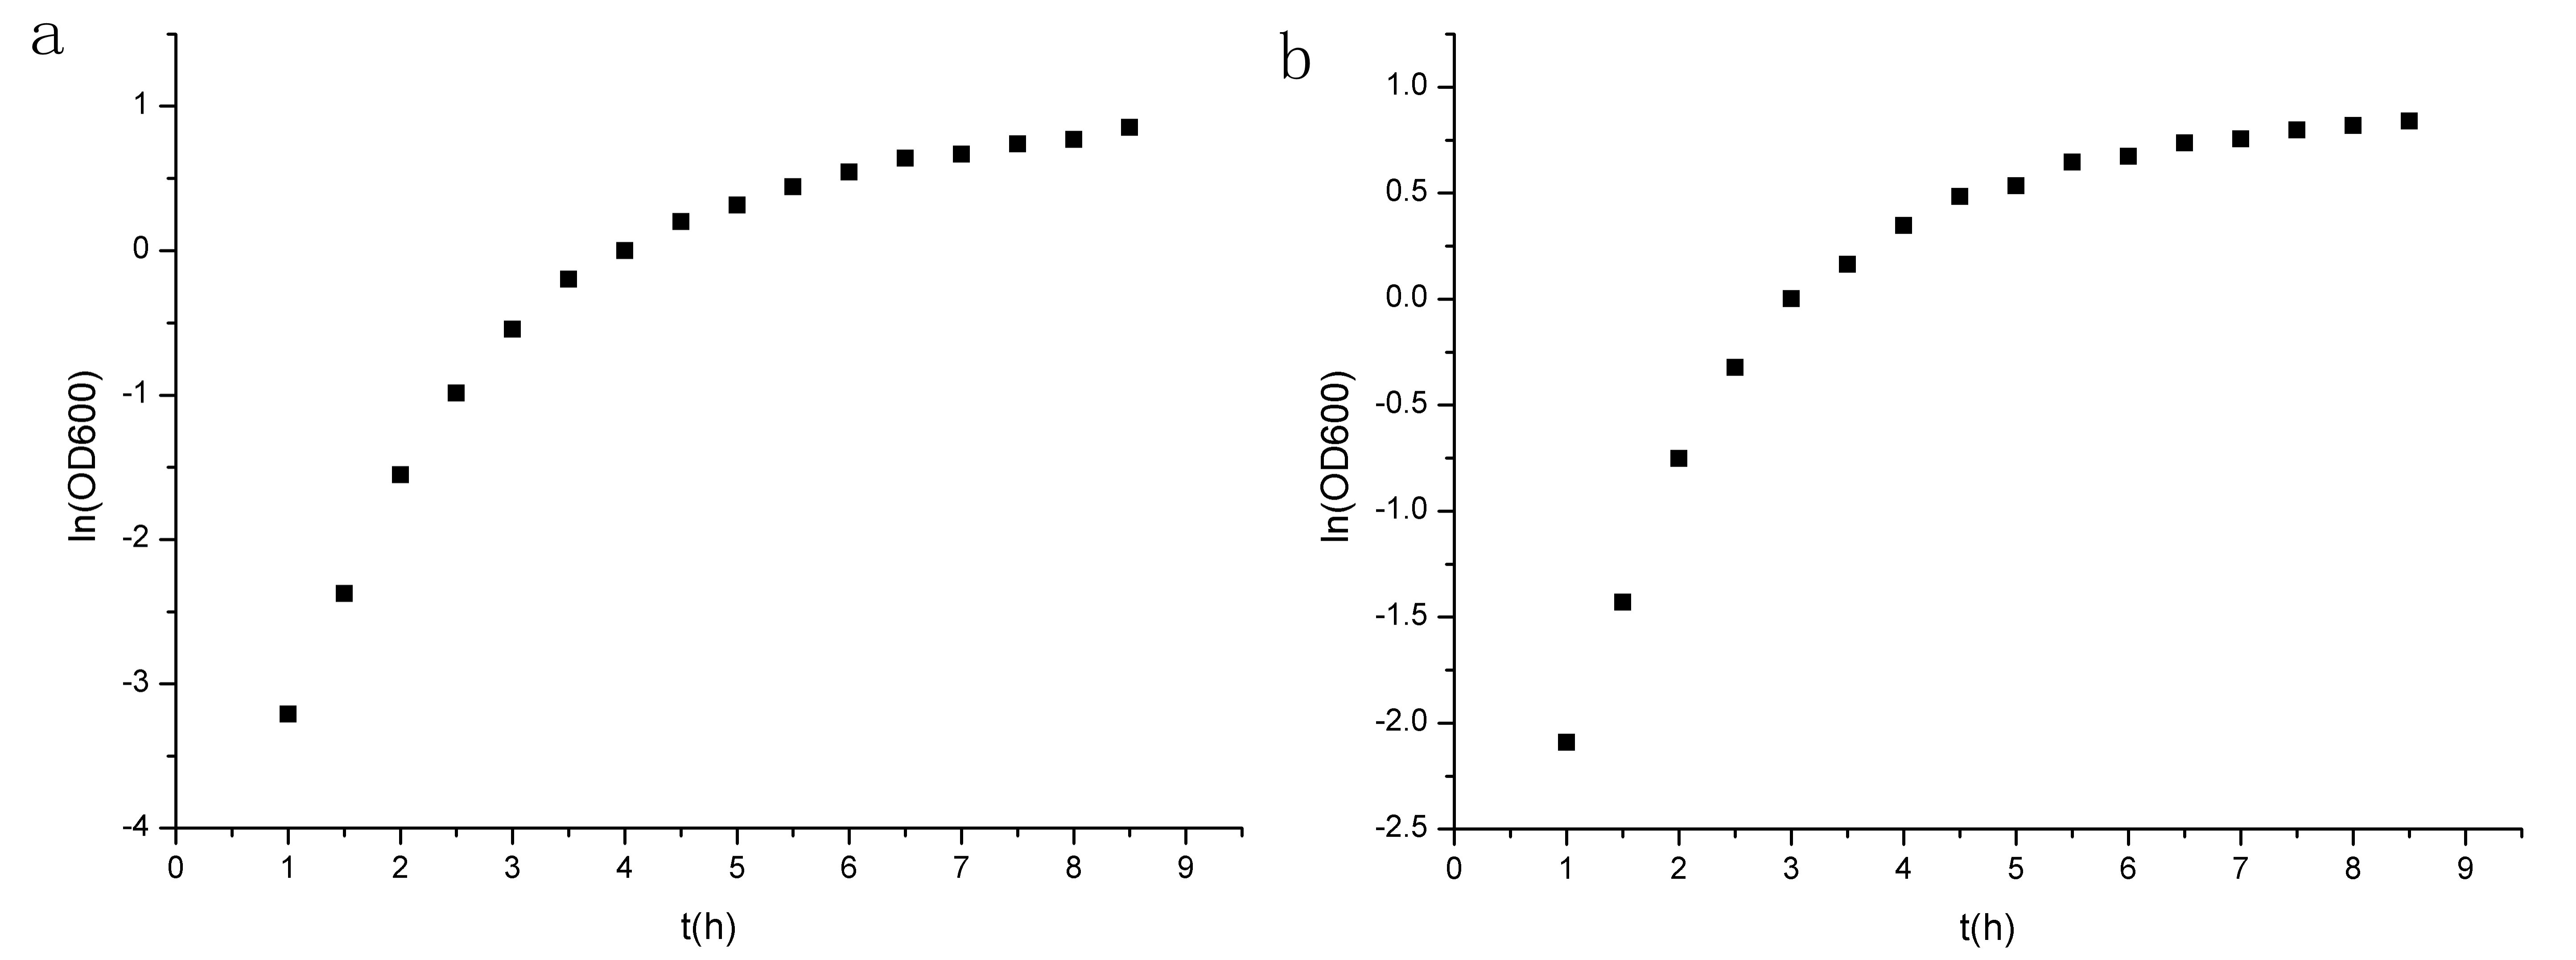
<p>The growth curve(fig.1) seems not so typical,probably because the bacteria may sense the environmental press at early stage.But since the two curve is similar,we can assert that our circuit is not the cause of the difference.Analyzing the two figures(fig.1&fig.2),we can see the first four data points lie in the logarithmic phase,and the ln(OD600) is linear to t(time).</p> | <p>The growth curve(fig.1) seems not so typical,probably because the bacteria may sense the environmental press at early stage.But since the two curve is similar,we can assert that our circuit is not the cause of the difference.Analyzing the two figures(fig.1&fig.2),we can see the first four data points lie in the logarithmic phase,and the ln(OD600) is linear to t(time).</p> | ||
| - | |||
| + | <div class="imgholder1" align="left" style="float:right;width:700px;height:auto;"> | ||
| + | <a href="https://static.igem.org/mediawiki/2012/b/b1/Curve.jpg"><img src="https://static.igem.org/mediawiki/2012/b/b1/Curve.jpg" alt="Curve" style="clear:both;width:750;height:300px;"></a><br><small align="center">Figure 1 Growth curve of the two groups. (a)experiment group prm-anticro-prm-lysis (b)control group croGFP</small> | ||
| + | |||
| + | <div class="imgholder1" align="left" style="float:right;width:700px;height:auto;"> | ||
| + | <a href="https://static.igem.org/mediawiki/2012/9/96/Points.jpg"><img src="https://static.igem.org/mediawiki/2012/9/96/Points.jpg" alt="Points" style="clear:both;width:750;height:300px;"></a><br><small align="center">Figure 2 Points of ln(OD600) to t. (a)experiment group prm-anticro-prm-lysis (b)control group croGFP </small> | ||
| + | |||
| + | <p>We select the four data points and do linear fit.Then we can get μm,exp(experimental group) and μm,ctrl(control group).</p> | ||
<div class="imgholder1" align="left" style="float:right;width:700px;height:auto;"> | <div class="imgholder1" align="left" style="float:right;width:700px;height:auto;"> | ||
Revision as of 15:04, 23 September 2012
RESULTS
 "
"


