Team:TU Munich/Modeling/Priors
From 2012.igem.org
Revision as of 15:38, 6 September 2012 by FabianFroehlich (Talk | contribs)


Contents |
Prior Data
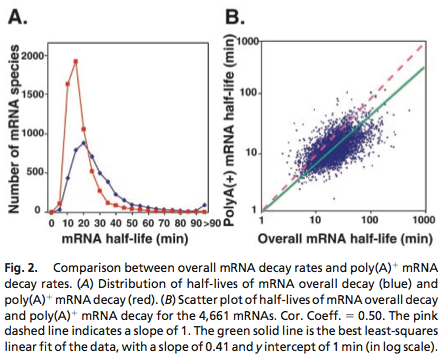
Yeast mRNA Degradation Rate
Data was obtained from the Paper (Wang et. Al 2001 [http://www.pnas.org/content/99/9/5860.long]) and processed by [http://arohatgi.info/WebPlotDigitizer/app/] to obtain raw data. Using a least-squared error approximation the distribution of the half life time in was approximated as noncentral t-distribution with parameters μ = 1.769 and ν = 20.59;.
dataGraph = [
0.0018691649126431735,0.0016851538590669062
0.05978099456360327,0.01885629059542104
0.11548146330755026,0.21910551258377348
0.17122389948476902,0.396902157771723
0.2253457470848775,0.4417136917136917
0.2815821076690642,0.3552607791738227
0.3359848142456839,0.249812760682326
0.39216629434020744,0.19272091011221448
0.4465173486912618,0.11490683229813668
0.5026600896166115,0.07854043723608946
0.5569239808370243,0.04735863431515607
0.6111394480959699,0.04208365077930302
0.667233765059852,0.031624075102336016
0.7233280820237343,0.021164499425369035
0.777540321018582,0.017616637181854626
0.8373665112795547,0.010604847561369285
0.8897063570976615,0.008787334874291503
0.9420462029157682,0.006969822187213598
0.9999935434718044,0.005142624707842157
];

X = round(dataGraph(:,1)*90);

y = round(dataGraph(:,2)*2000);

k(1) = 1.769292045467269;
k(2) = 20.589996419308118;
k(3) = 24852.48237036381;

k=fminunc(@(z) sum((y-z(3)*nctpdf(X,z(1),z(2))).^2),k);
k=fminunc(@(z) sum((y-z(3)*nctpdf(X,z(1),z(2))).^2),k);
k=fminunc(@(z) sum((y-z(3)*nctpdf(X,z(1),z(2))).^2),k);
k=fminunc(@(z) sum((y-z(3)*nctpdf(X,z(1),z(2))).^2),k);
k=fminunc(@(z) sum((y-z(3)*nctpdf(X,z(1),z(2))).^2),k);
Yeast Protein Degradation Rate
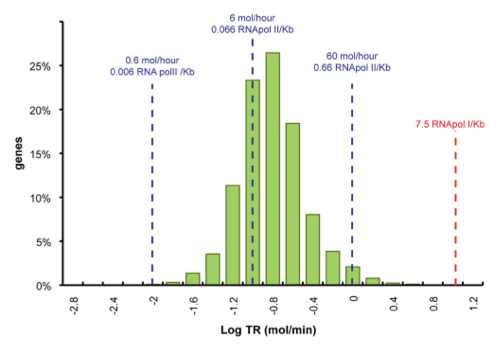
Yeast Transcription Rate Rate
Data was obtained from the Paper (Wang et. Al 2001 [http://www.pnas.org/content/99/9/5860.long]) and processed by [http://arohatgi.info/WebPlotDigitizer/app/] to obtain raw data. Using a least-squared error approximation the distribution of the transcription rate was approximated as log-normal distribution with parameters μ = -1.492 and σ = 0.661;.
dataGraph = [
-1.8,0.3442950751957339
-1.6,1.3525375039897853
-1.4,3.5492668181220783
-1.2,11.28874786429094
-1.0,23.213749272450762
-0.8,26.31522126884587
-0.6,18.273455248681024
-0.4,7.913623476840467
-0.2,3.7755111620134825
0,1.9559339854677913
0.2,0.6458759692833385
0.4,0.12767315671880167
];

x = 10.^dataGraph(:,1);
y = dataGraph(:,2);

k(1) = -0.8;
k(2) = 0.2;
k(3) = 25;

k=fminunc(@(z) sum((y-z(3)*lognpdf(x,z(1),z(2))).^2),k);
k=fminunc(@(z) sum((y-z(3)*lognpdf(x,z(1),z(2))).^2),k);
k=fminunc(@(z) sum((y-z(3)*lognpdf(x,z(1),z(2))).^2),k);
k=fminunc(@(z) sum((y-z(3)*lognpdf(x,z(1),z(2))).^2),k);

figure(1)
clf
plot(linspace(-2.8,0.8,100),k(3)*lognpdf(linspace(-2.8,0.8,100),k(1),k(2)),'r-')
hold on
plot(x,y,'g*')
 "
"

