Team:TU Darmstadt/Labjournal/Material Science
From 2012.igem.org
Contents |
Material Science
The main focus of the material science group is the synthesis of polyethylene terephthalate (PET) and structural analoga for the study of the degradation mechanism including atomic force microscopy.
- Synthesis of paranitrophenylesters in presence of triethylamine
- Synthesis of polyethylene terephthalate in presence of sulfuric acid
- Atomic force microscopy
Synthesis of paranitrophnylesters with acyl chlorides in presence of triethylamine
Introducion
The goal of the synthesis is to create paranitrophenylesters with similar polarity and sterical effects as PET-bricks. These are meant to be split enzymatically to deduce an enzymkinetic detecting cutingproducts.
Theory
The synthesis of the esters was achieved by combining acyl chlorides with paranitrophenole in presence of triethylamine. Acetone was used as solvent. The reaction takes 2 h at 0 °C and inert conditions. Triethylamine is used as base to deprotonate paranitrophenol and to catalyze the attack of phenolate at the acyl chloride. It is dissipated by developing hydrogen chloride.
Preparation
Diparanitrophenyl succinate
In a 250 mL triple-neck round-bottom flask with reflux 6.79 g (48.82 mmol/ 2.01 eq.) paranitrophenole and 5.16 g (51.01 mmol/ 2.10 eq.) triethylamine are dissolved in 100 mL acetone under inert conditions and kept at 0 °C using a water/ice mixture. A solution of 1.70 g (10.07 mmol/ 1.00 eq.) succinyl chloride in 50 mL acetone is added dropwise with stirring 2 h at 0 °C. The resulting ester is precipitated in 400 mL distilled water, recrystallized from ethyl acetate three times and dried at 60 °C in a cabinet dryer over night. The yield is 2.3381 g (26.73 % of the theory).
Paranitrophenyl dihydrocinnamate
In a 100 mL triple-neck round-bottom flask with reflux 1.41 g (10.17 mmol/ 1.01 eq.) paranitrophenole and 1.07 g (10.57 mmol/ 1.05 eq.) triethylamine are dissolved in 50 mL acetone under inert conditions and kept at 0 °C using a water/ice mixture. A solution of 3.76 g (24.29 mmol/ 1.00 eq.) dihydrocinnamoyl chloride in 20 mL acetone is added dropwise with stirring 2 h at 0 °C. The resulting ester is precipitated in 200 mL distilled water, filtrated washed with ice cold acetone, stirred in distilled water for 2 h and dried at 60 °C in a cabinet dryer over night. The yield is 1.0623 g (34.69 % of the theory).
Analysis (1H-NMR-spectroscopy)
Diparanitrophenyl succinate
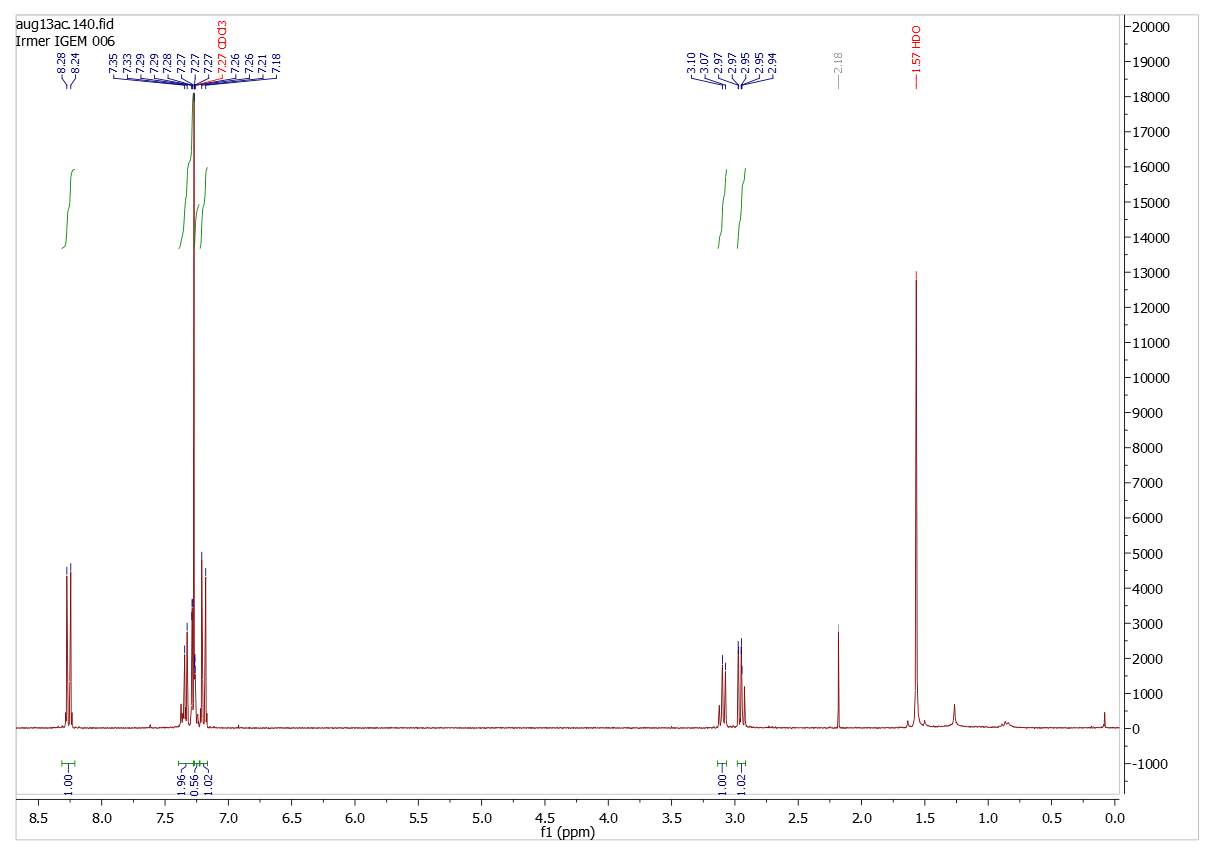
Paranitrophenyl dihydrocinnamate
(300 MHz, CDCl3): δ/ppm = 2.94-2.97 (2 H), 3.07-3.10 (2 H), 7.18-7.21 (2 H), 7.26-7.35 (5 H), 8.24-8.28 (2 H)
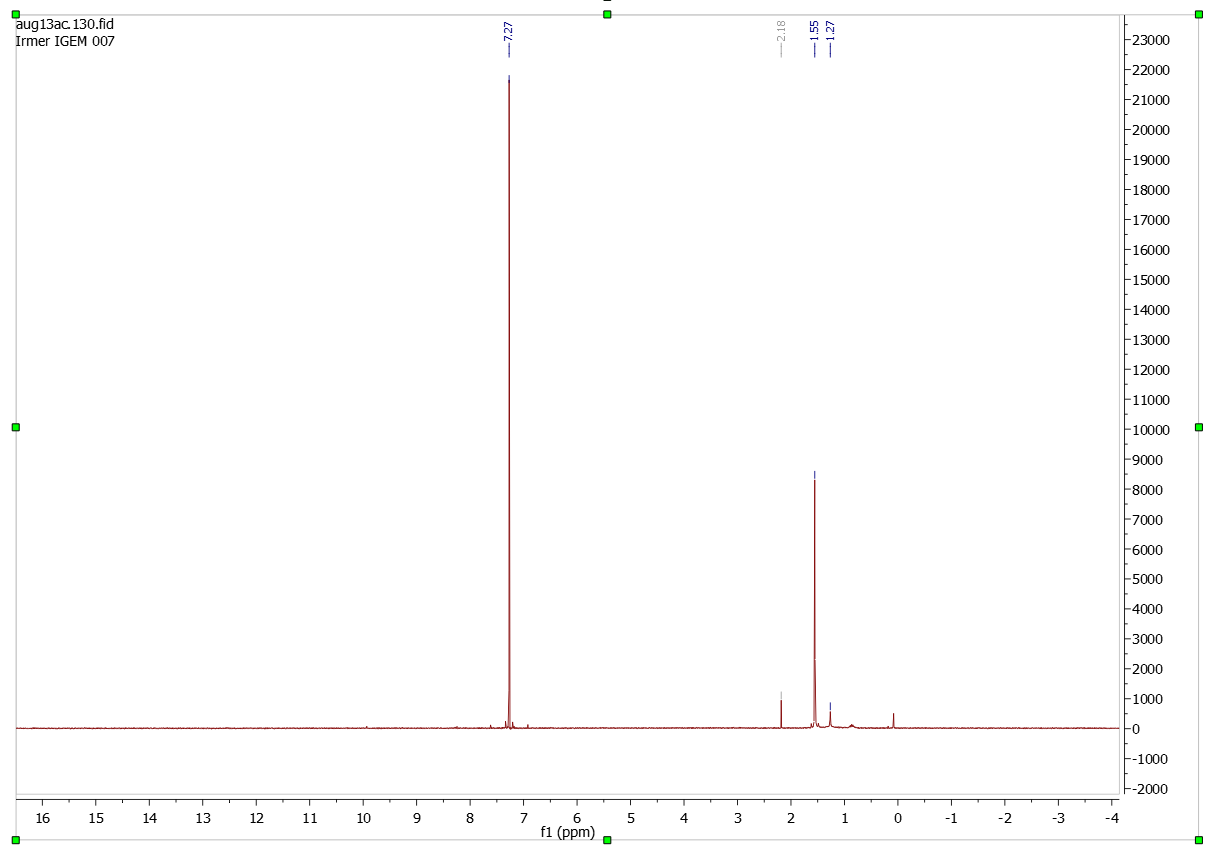
Solvent (CDCl3)
Sources
[http://patentscope.wipo.int/search/en/detail.jsf?docId=WO2009073541&recNum=1&maxRec=&office=&prevFilter=&sortOption=&queryString=&tab=PCT+Biblio: Thermoresponsive arginine-based hydrogels as biologic carriers 11.06.2009]
Synthesis of polyethylene terephthalate in presence of sulfuric acid
Theory
To gain information about different methods of synthesis for Polyethylene terephthalate (PET) and the effect on physical and surface propieties, three experimets are done. The resulting oligo- and polymer is melted, cooled in liquid nitrogen and investigated with AFM. As the synthesis of polyethylene theephthalate is a reversible polycondensation of ethylene glycol and diemthyl terephthalate the developing methanol has to be removed from the reaction by destillation. Concentrated sulfuric acid is used as a catalyst.
Preparation
Conversion to polyethylene terephthalate 1
For the preparation of polyethylene terephthalate 2.73 g (14.05 mmol) of dimethylterephthalate were added to 43.68 mL (781.13 mmol) of ethylene glycol. After the addition of 2-3 drops of concentrated sulfuric acid the solution was heated under reflux at 65 °C for 20 min. After destilation of the Methanol, the resulting yellow solution was cooled for 48 hours at 5 °C and filtered. White crystals were precipitated, they were washed with cold hexane and then with a little cold water. The dried crystals are melted at 80°C and poured on a flat metal plate. Which was immediately cooled to -195 °C. The resulting solid was investigated by atomic force microscopy.
Conversion to polyethylene terephthalate 2
For the preparation of polyethylene terephthalate 2.643 g (13.59 mmol) of dimethylterephthalate were added to 0.76 mL (13.59 mmol) of ethylene glycol in 50 mL DMSO. After the addition of 2-3 drops of concentrated sulfuric acid the solution was heated under reflux at 65 °C for 20 min. After destilation of the Methanol, the resulting yellow solution was cooled for 48 hours at 5 °C and filtered. White crystals were precipitated, they were washed with cold hexane and then with a little cold water. The dried crystals are melted at 120 °C and poured on a flat metal plate. Which was immediately cooled to -195 °C. The resulting solid was investigated by atomic force microscopy.
Conversion to polyethylene terephthalate 3
For the preparation of polyethylene terephthalate 2.71 g (13.95 mmol) of dimethylterephthalate were added to 0.39 mL (0.69 mmol) of ethylene glycol in 50 mL DMSO. After the addition of 2-3 drops of concentrated sulfuric acid the solution was heated under reflux at 65 °C for 20 min. 0.39 mL (0.69 mmol) of ethylene glycol were added dropwise over 30 min. After destilation of the Methanol, the resulting yellow solution was cooled for 48 hours at 5 °C and filtered. White crystals were precipitated, they were washed with cold hexane and then with a little cold water. The dried crystals were melted at 170 °C. While reaching the temperature of 170 °C the crystals suplimated imediatly leading to a total loss of product.
Results
The investigation of the synthetisized PET lead to no usable result. The cristalinity and degree of polymerisation of the samples were to low and the surface to soft to be analyzed with AFM.
Surface analysis of polyethylene terephthalate with atomic force microscopy (AFM)
Theory
[http://en.wikipedia.org/wiki/Atomic_force_microscopy Atomic force microscopy] is used to make very precise surface analysis up to nanometer scale. The goal was to indentify differences between different modifications of polyethylene terephthalate and to proof enzymatic degradation by changed surface properties.
Testing
Experiment 1
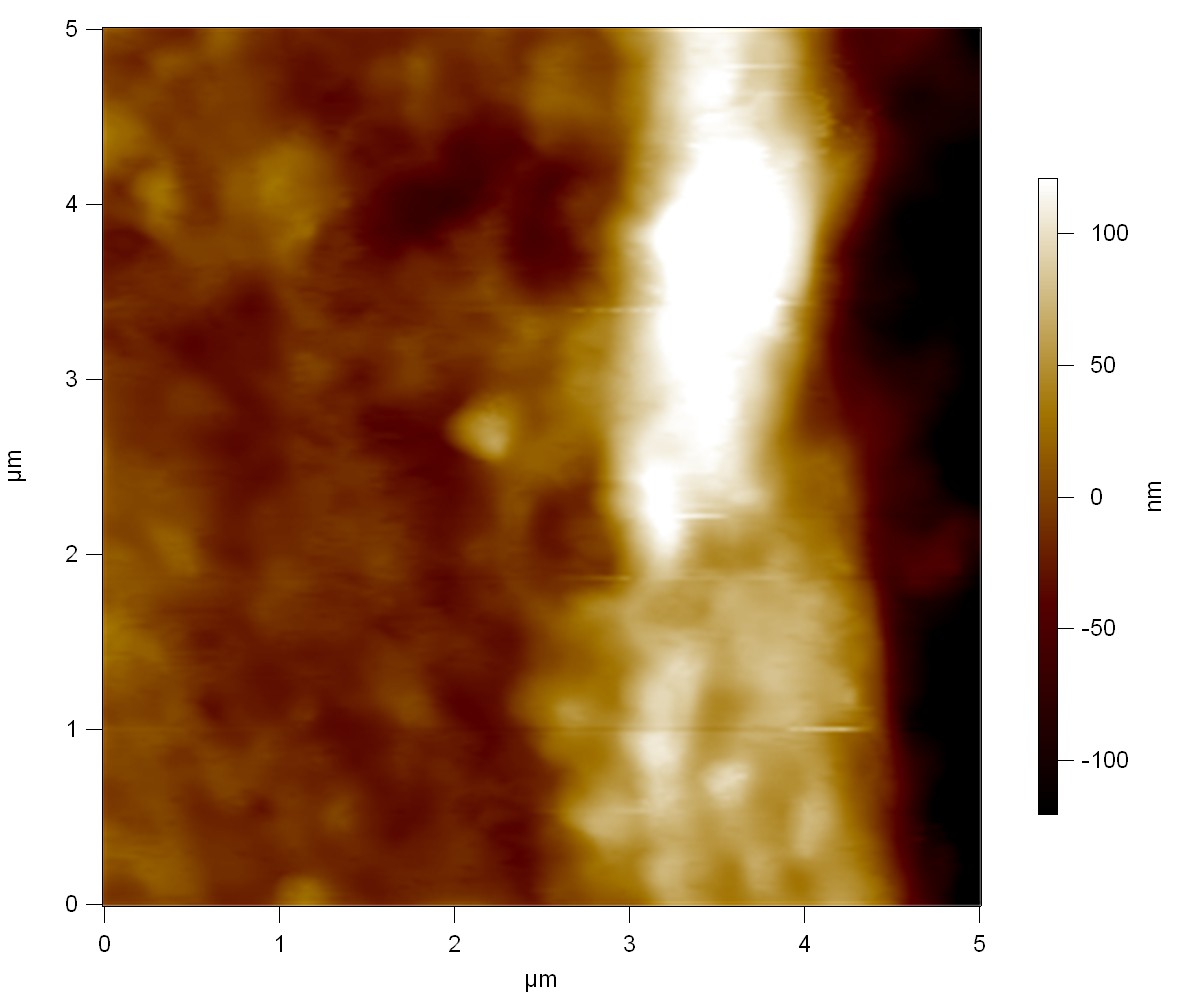
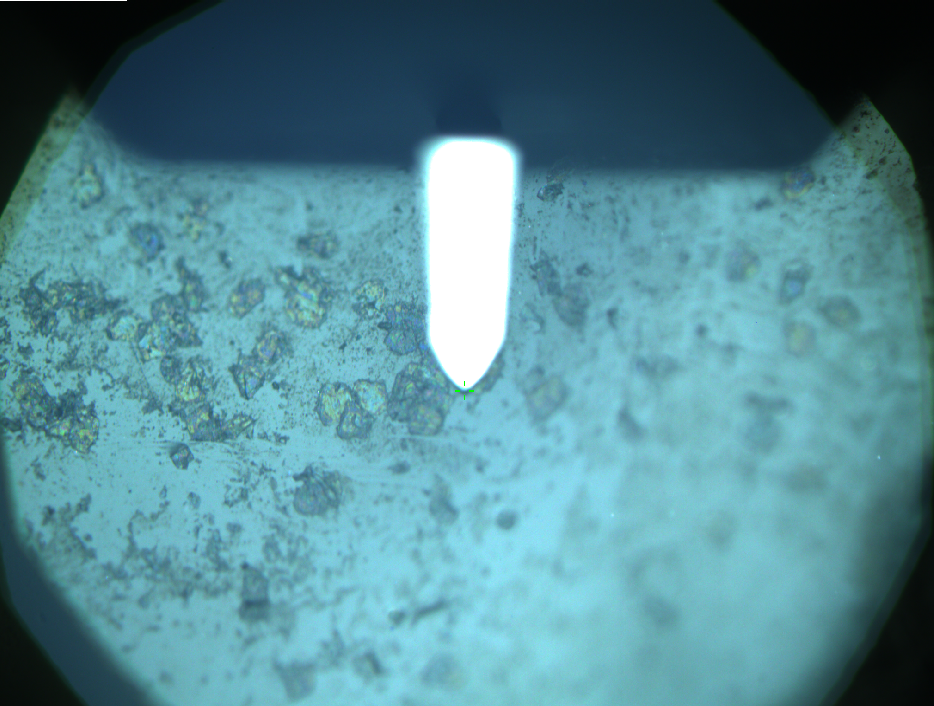
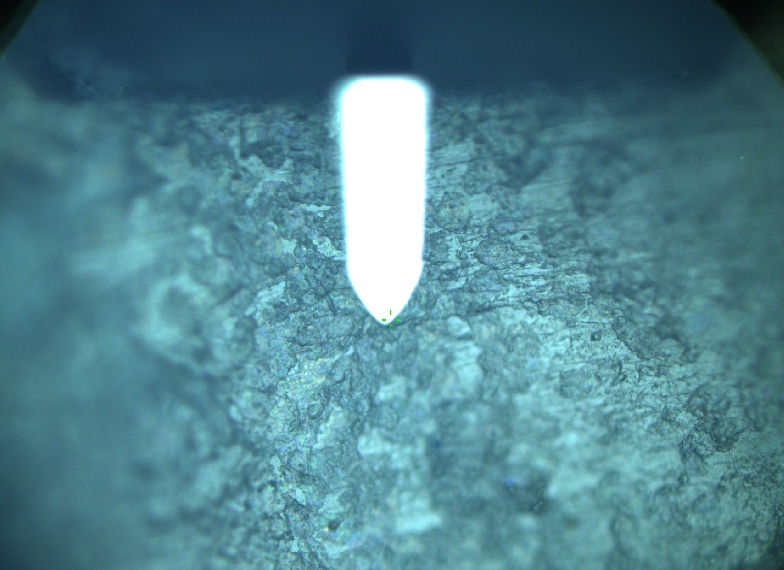
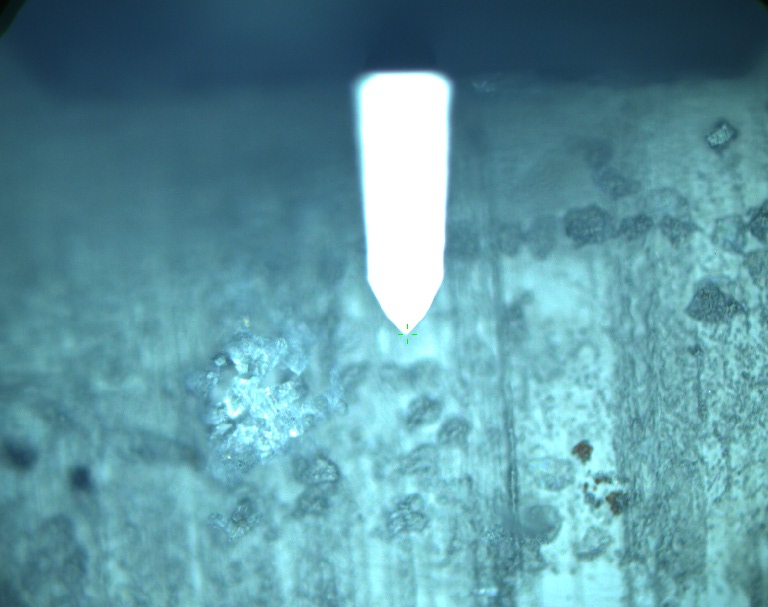
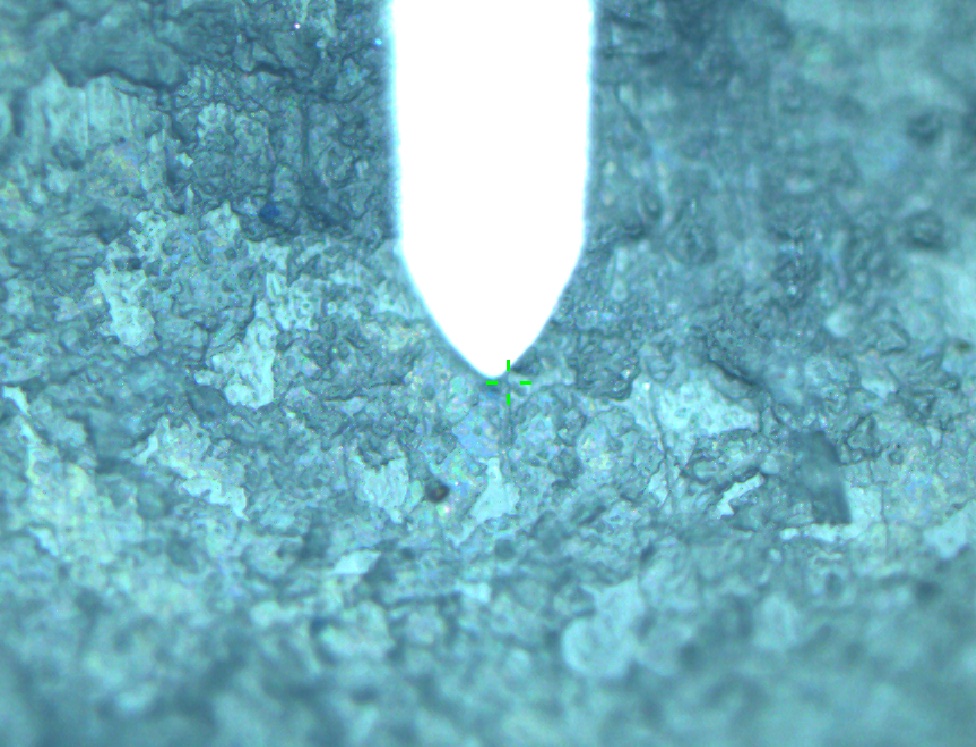
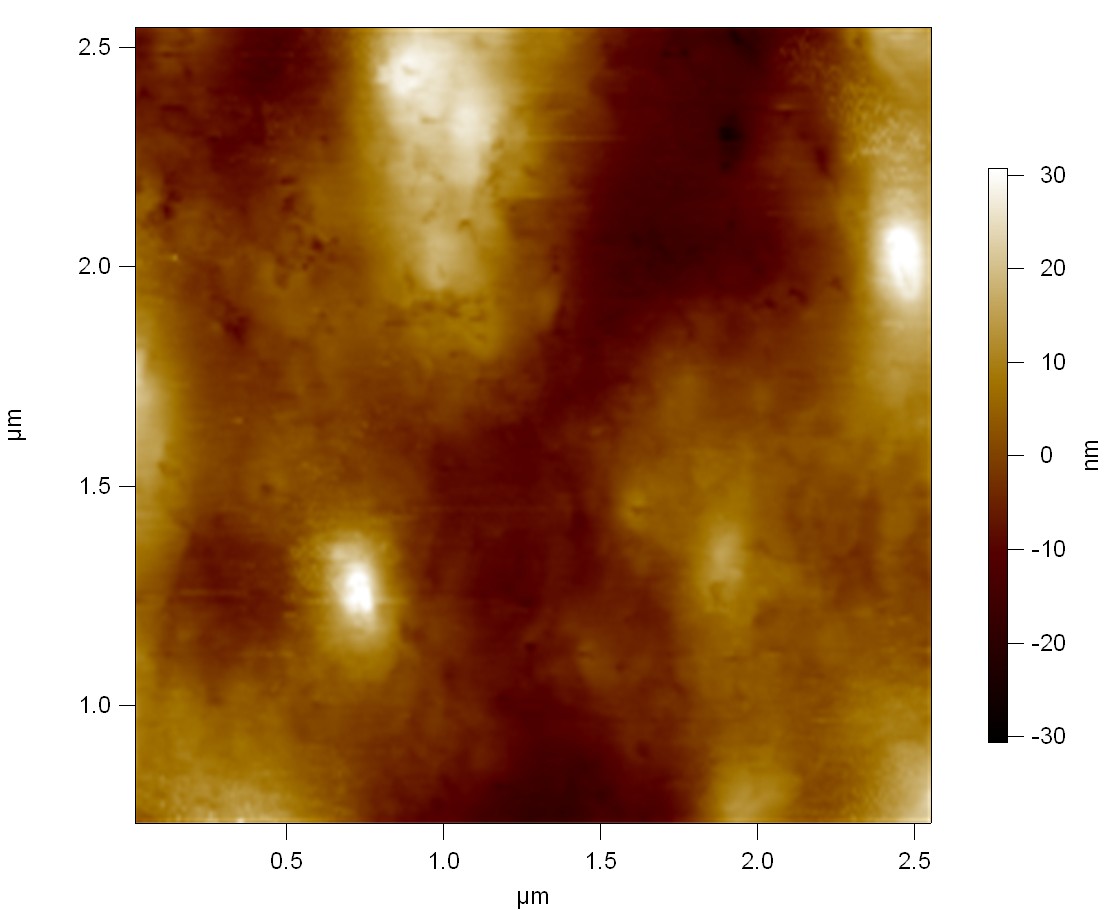
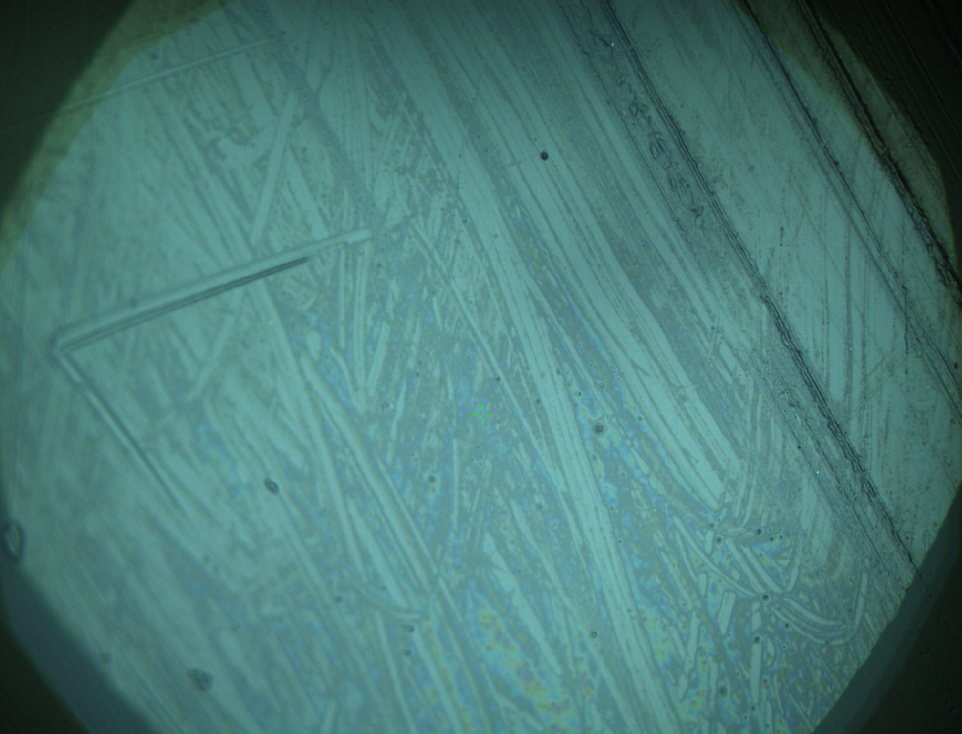
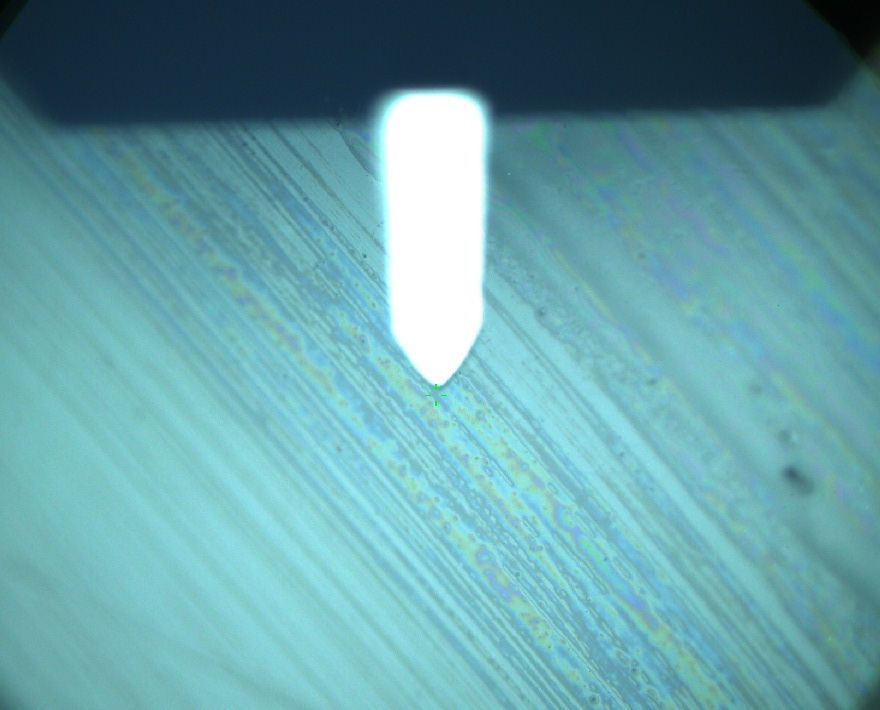
Pieces of a PET water bottle are melted between two metal plates using a heat gun to create flat samples. They are incubated for 24 h at 37 °C after applying a solution of 90 µmol/L [http://partsregistry.org/wiki/index.php?title=Part:BBa_K808025 FsC] and 90 µmol/L [http://partsregistry.org/wiki/index.php?title=Part:BBa_K808026 pNB-Est13] without beeing moved. The Samples are washed with distilled water and dried in a cabinet dryer at 60 °C for 1 h. The samples are investigated using AFM. Surface modifications of PET induced by FsC could be observed in form of circular perforations. Measurements in this area show a surface profile of (±100 nm). Measurements of the reference show a surface profile of (±30 nm). There was no surface modification by pNB-Est13. The pictures below show surface profiles and light microscopic captures of the non treated PET reference and the FsC treated PET surface.
AFM of PET surface after FsC exposure:
AFM of the PET surface as reference:
Experiment 2
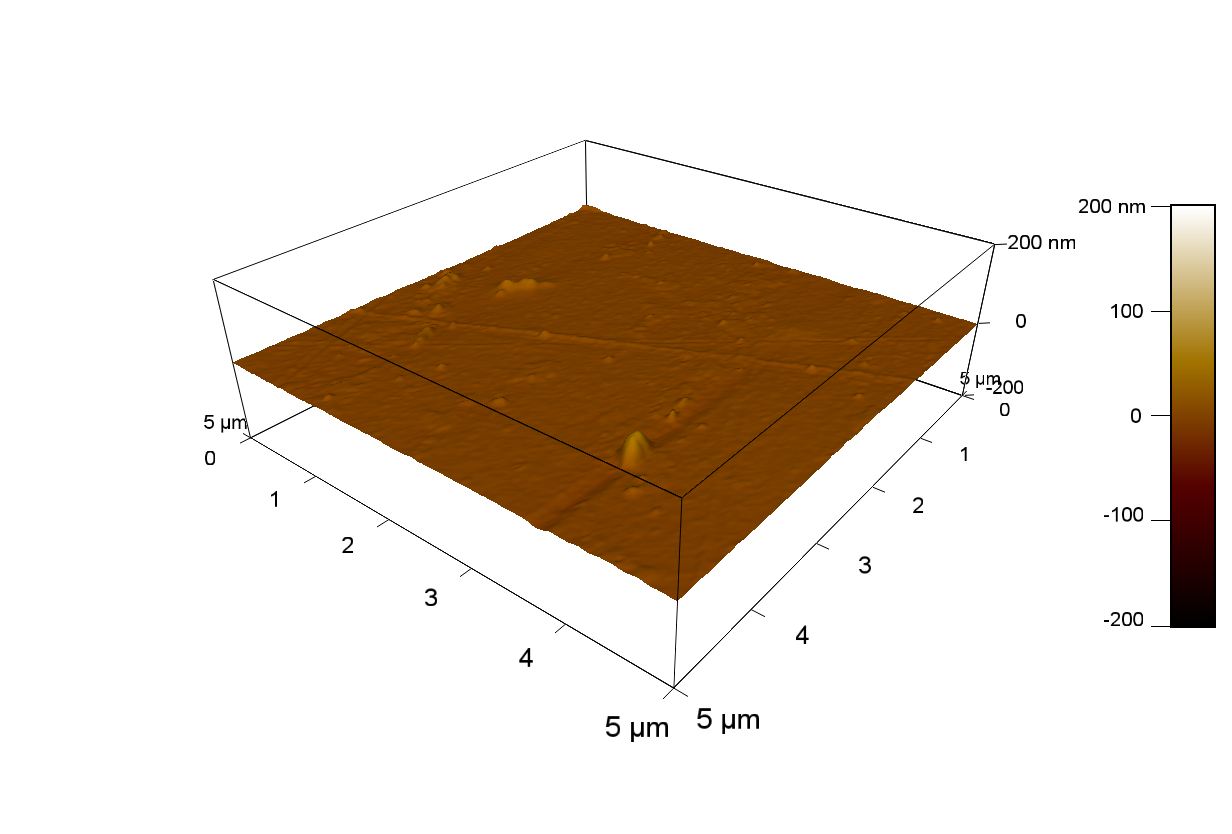
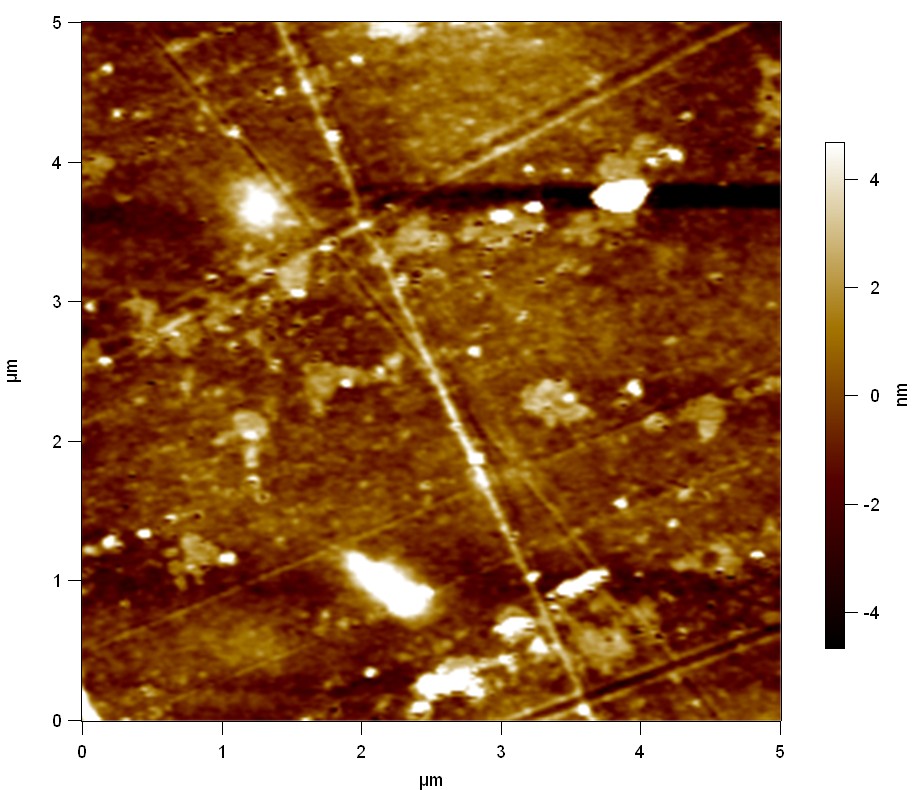
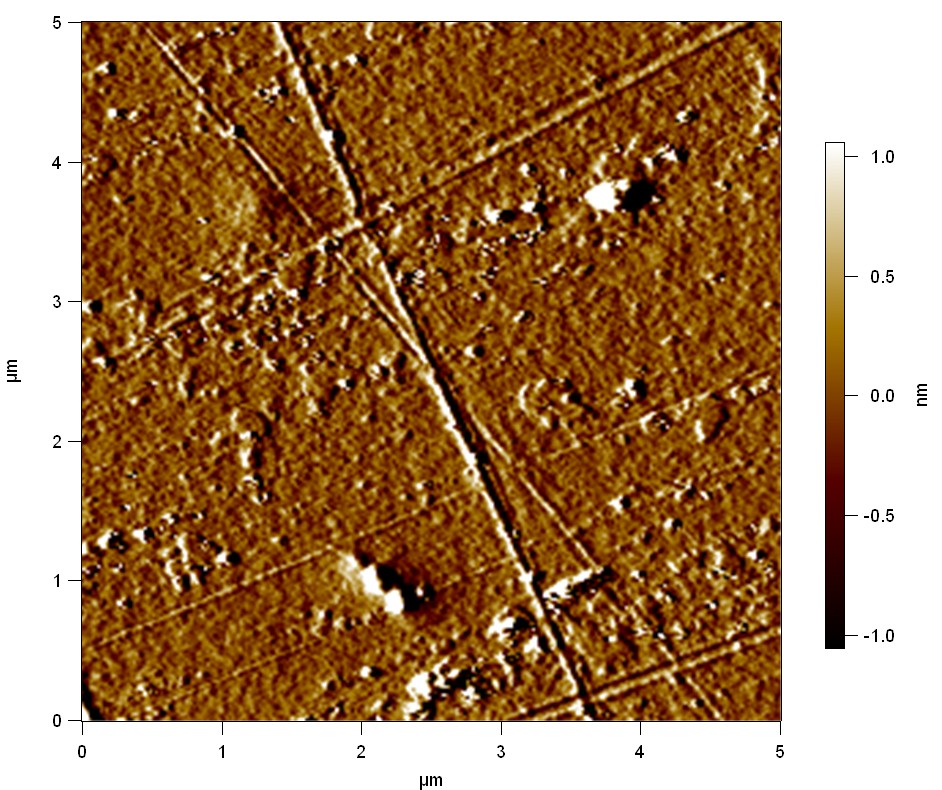
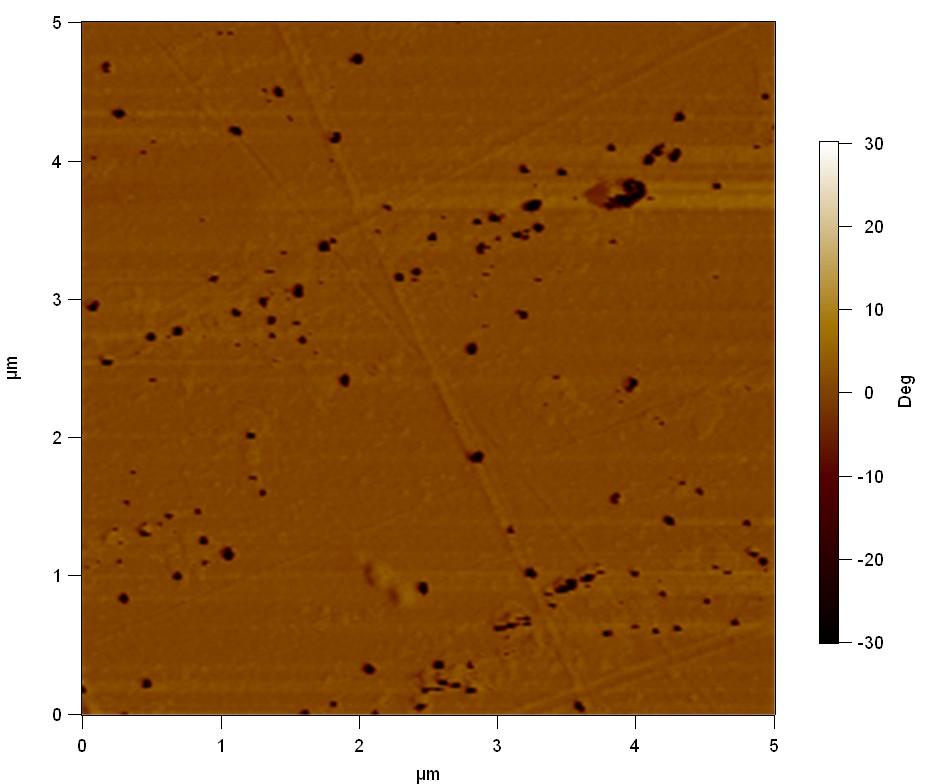
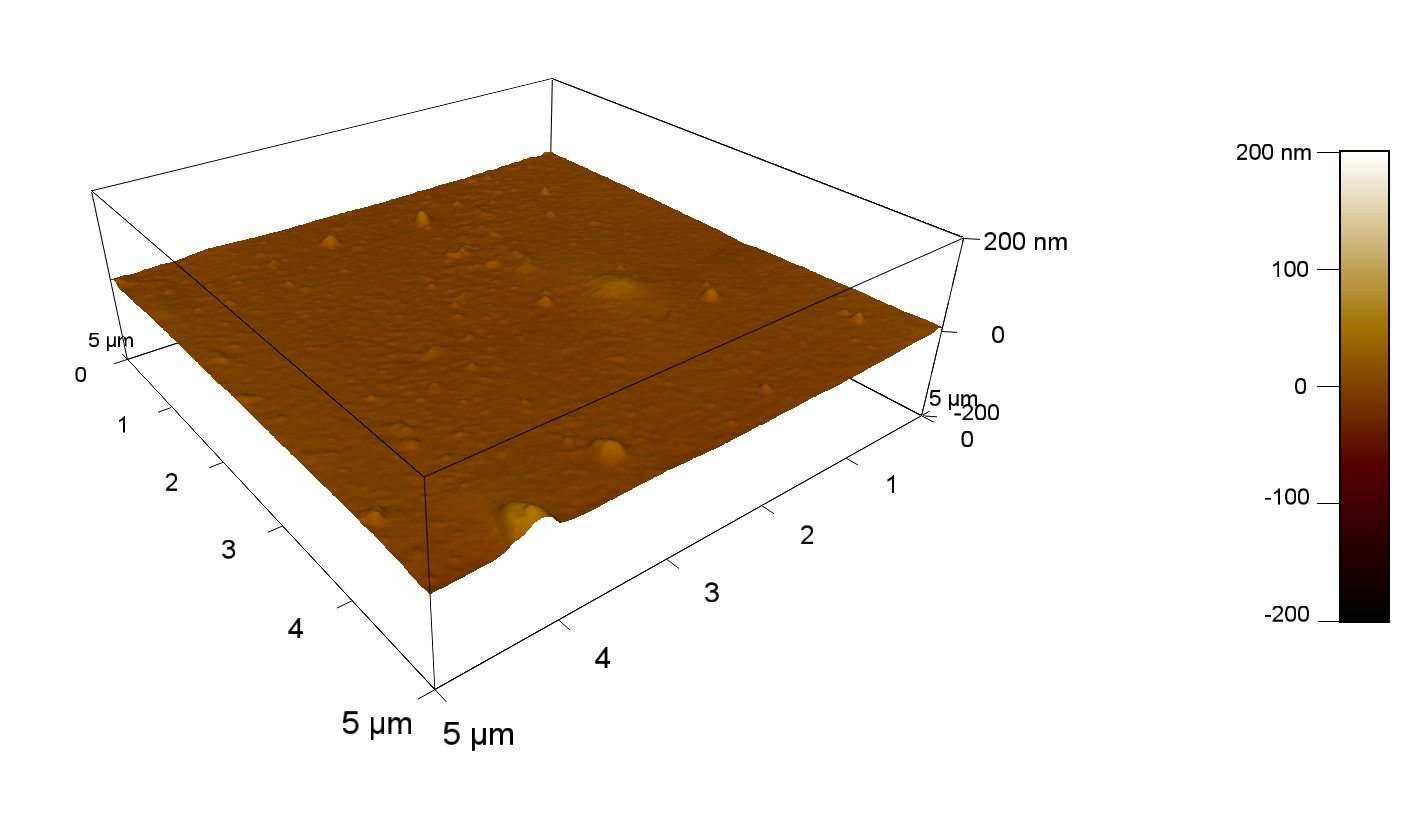
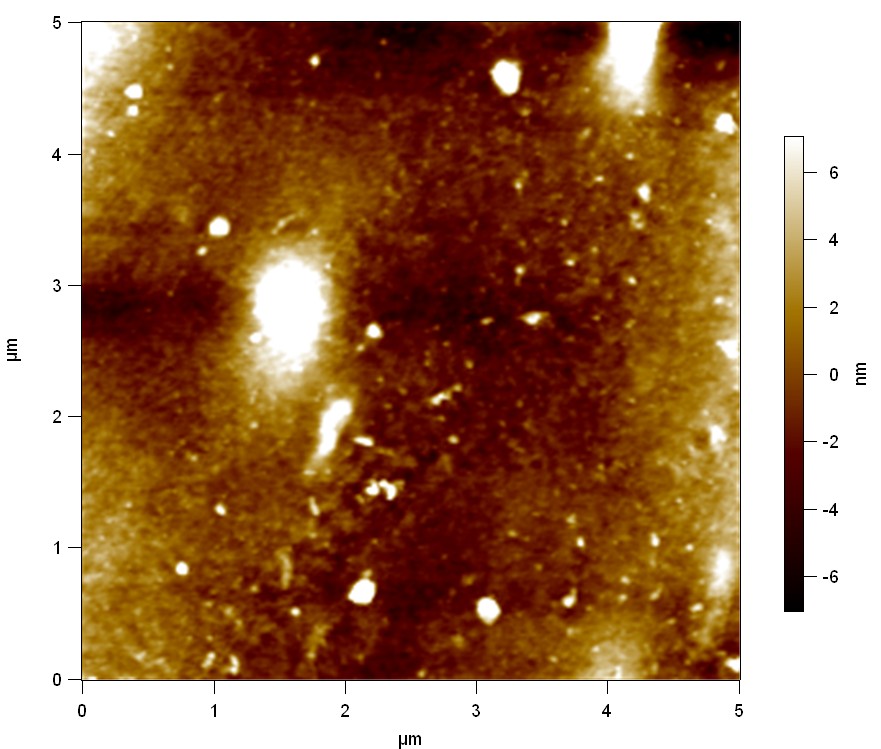
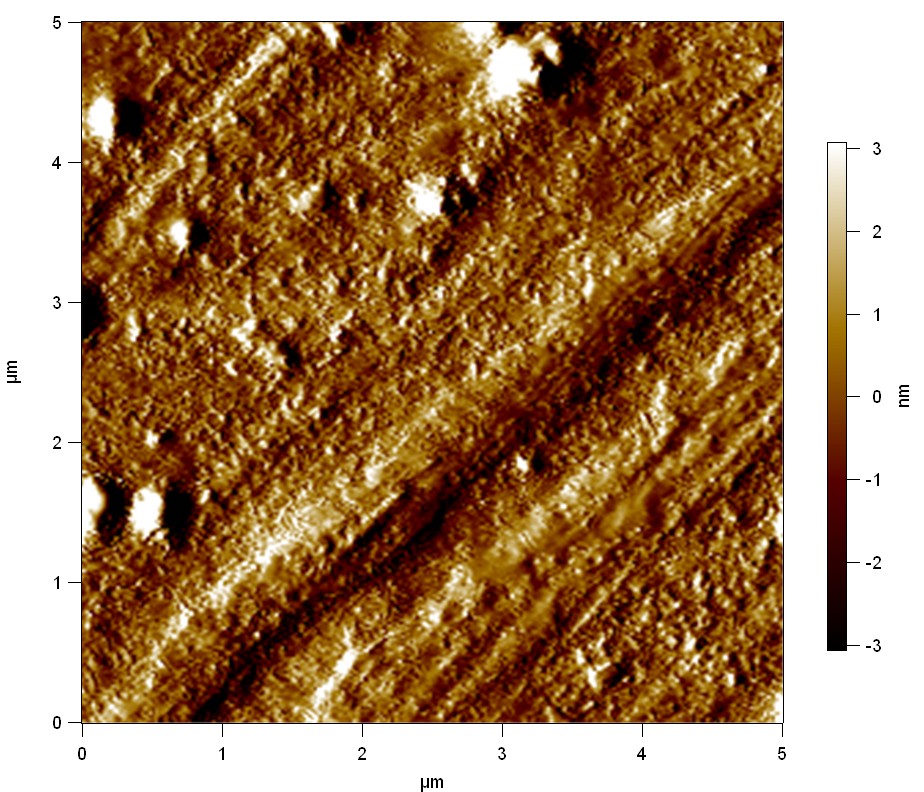
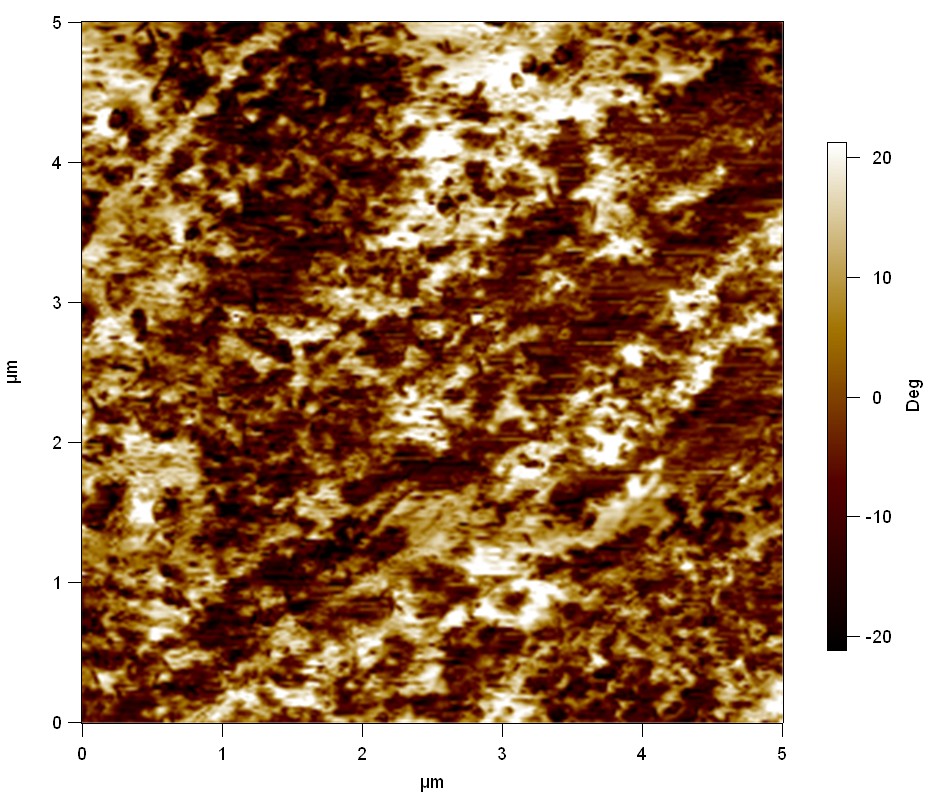
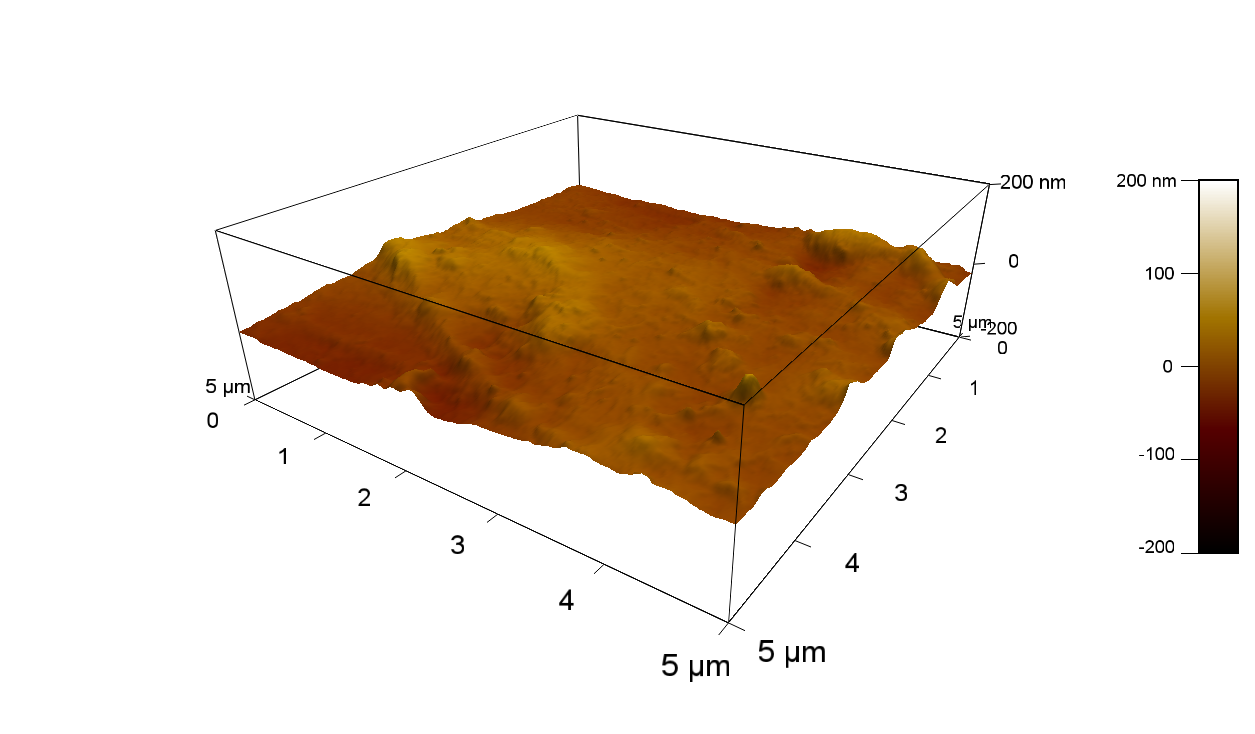
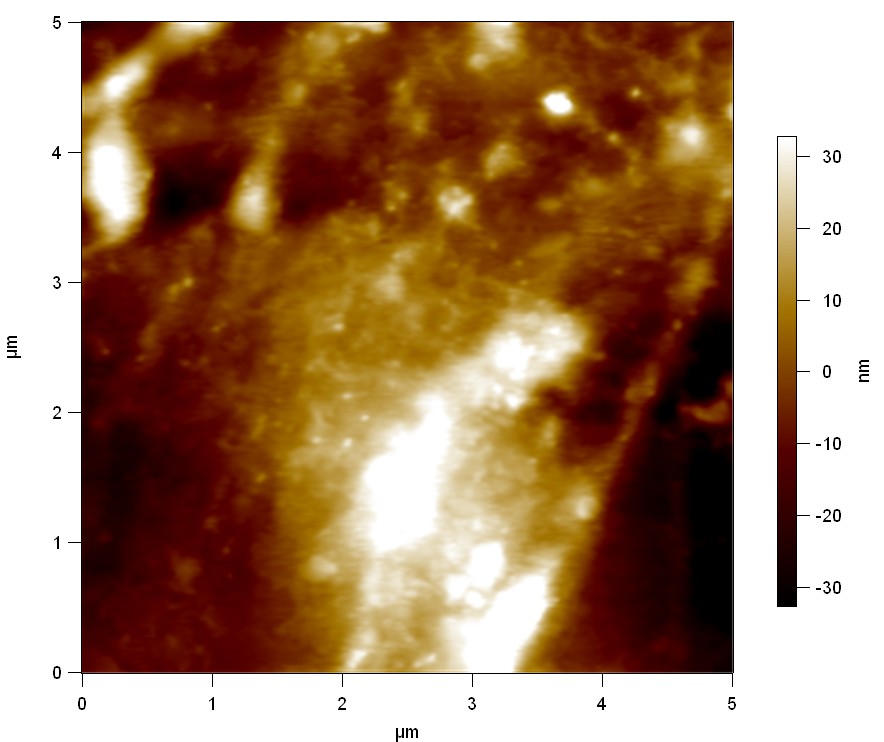
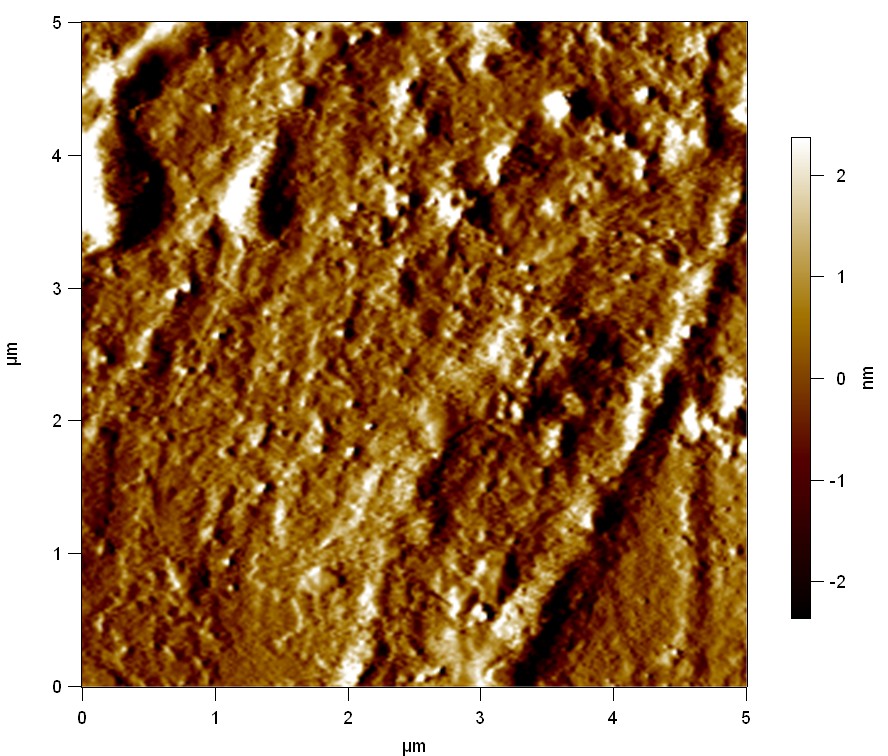
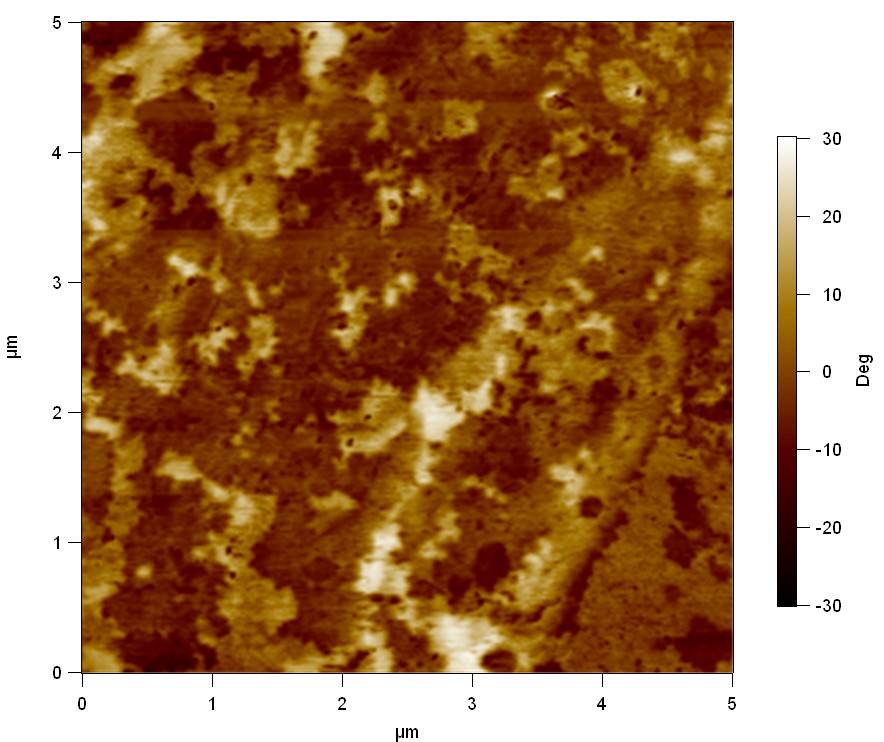
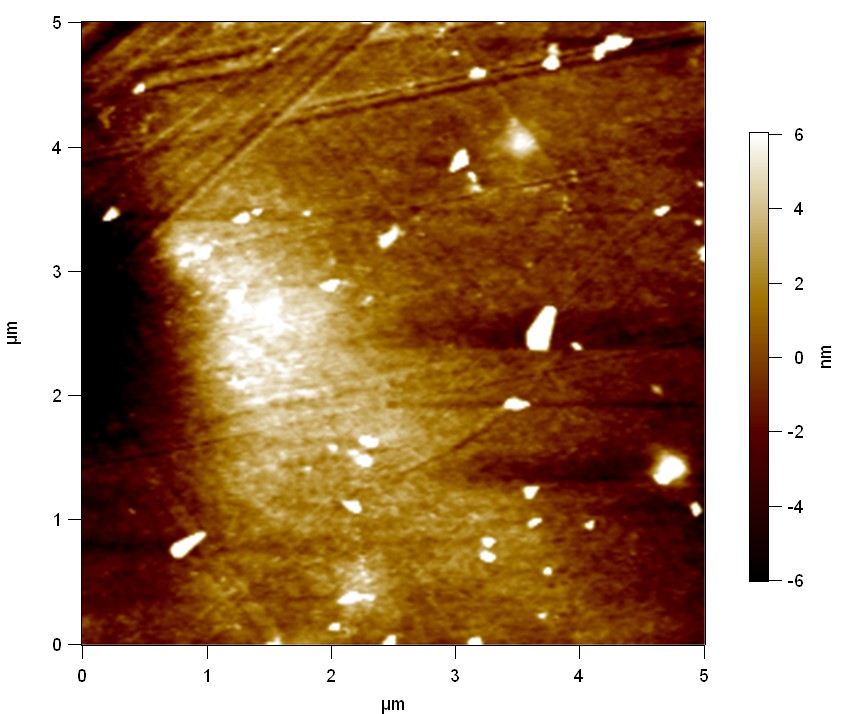
Pieces of PET foil are added to solutions of 2 µmol/L FsC and pNB-Est13. In case of pNB-Est13 various concentrations are tested (50 µmol/L; 20 µmol/L; 2 µmol/L). The solutions are constantly agitated in 50 mL falcon tubes. After 7 days the samples are washed with distilled water and dried in a cabinet dryer at 60 °C over night. The samples are investigated using AFM. FsC induced surface modification of PET could be observed. There was no surface modification at no concentration of pNB-Est13.
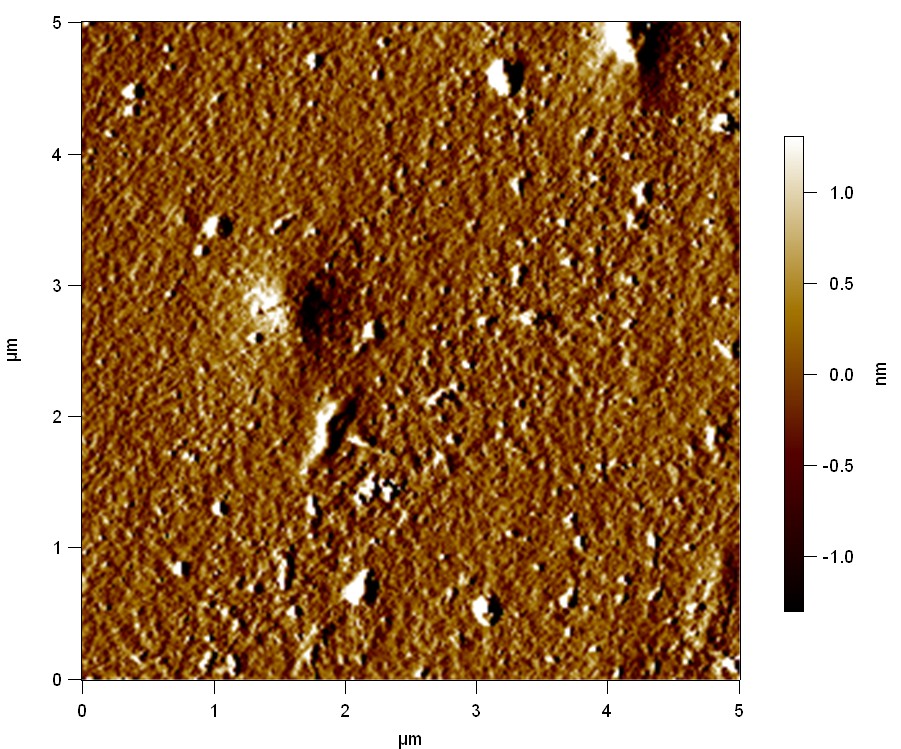
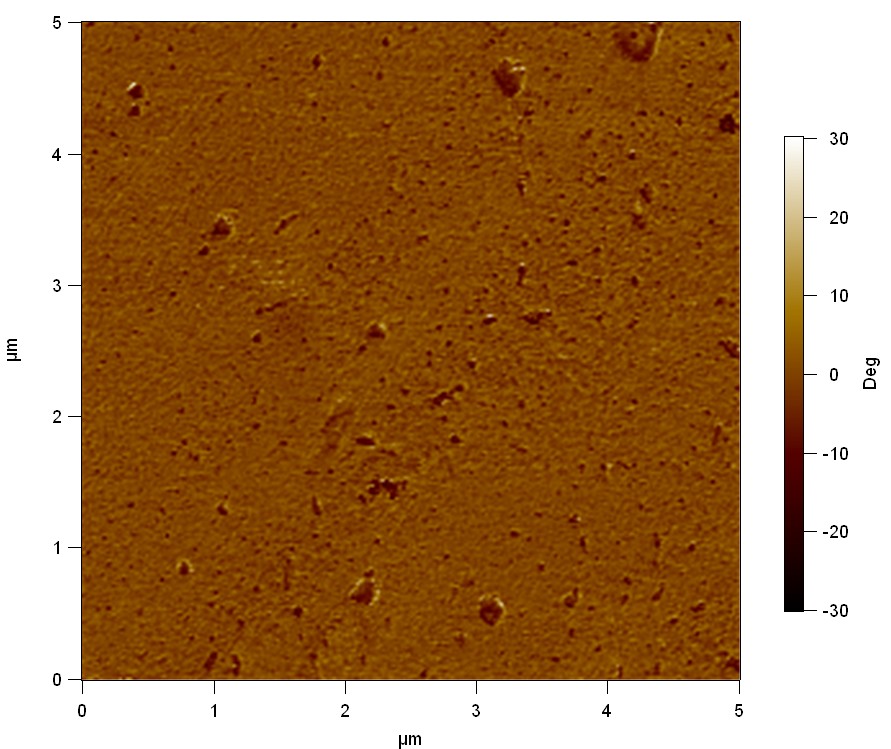
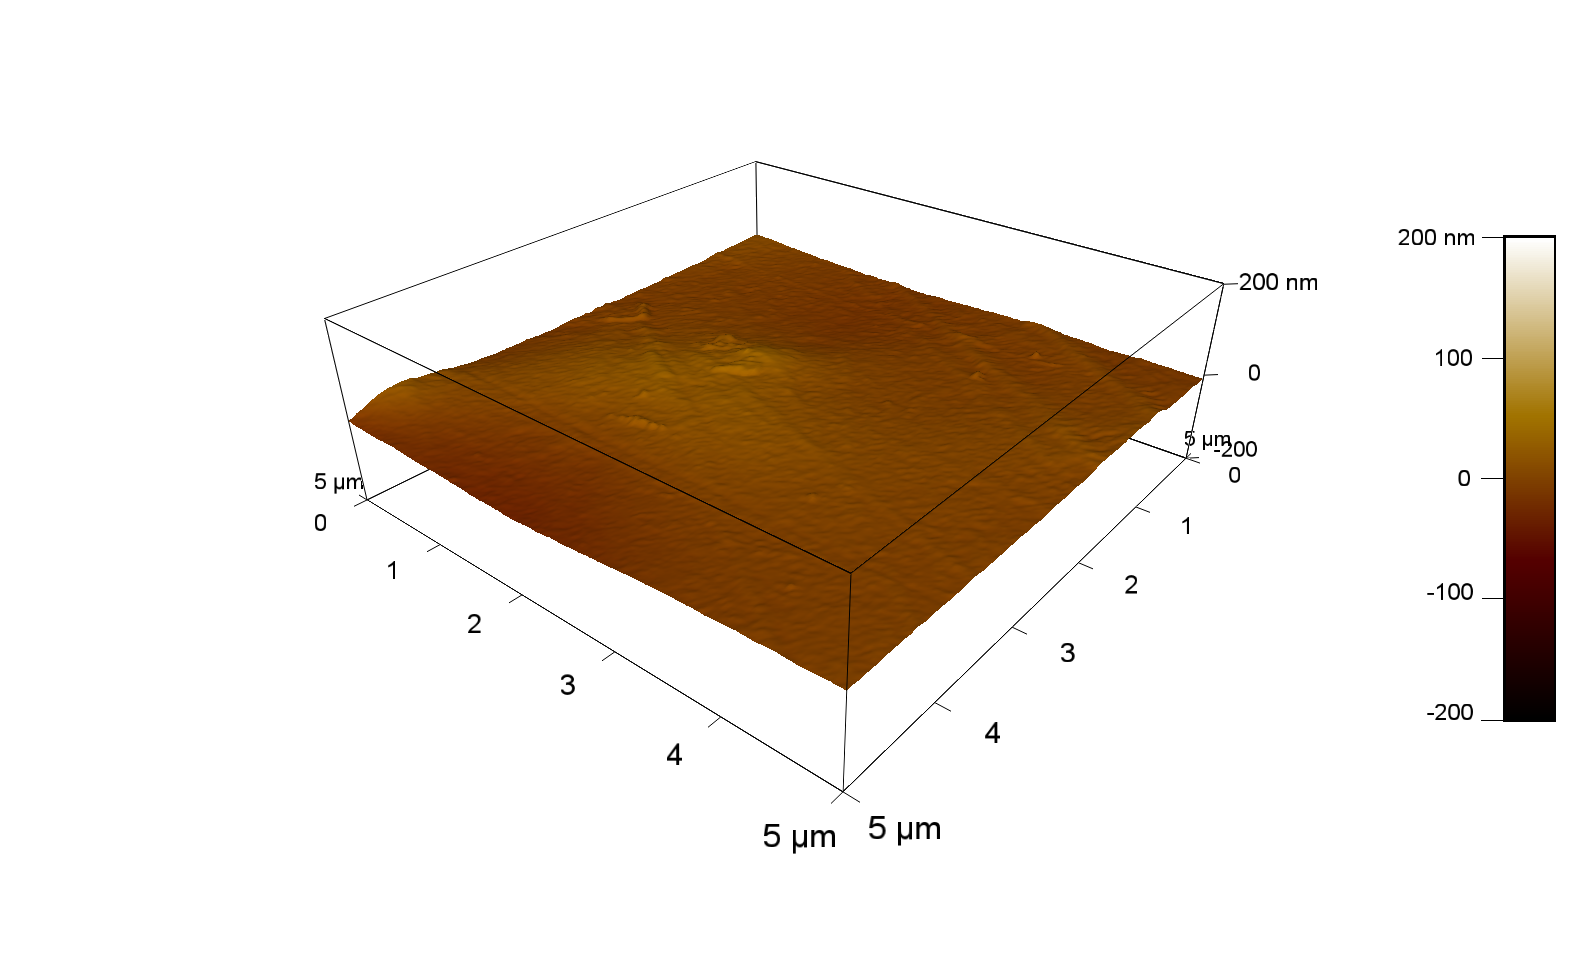
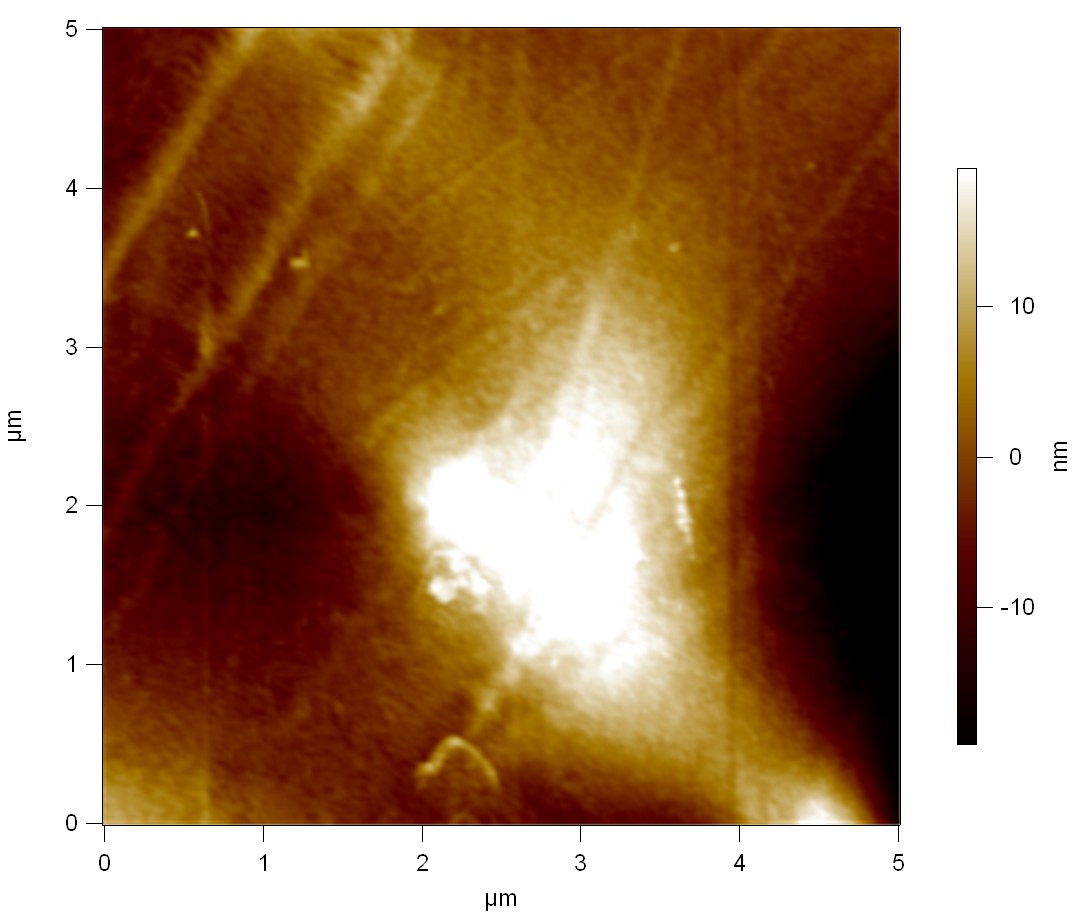
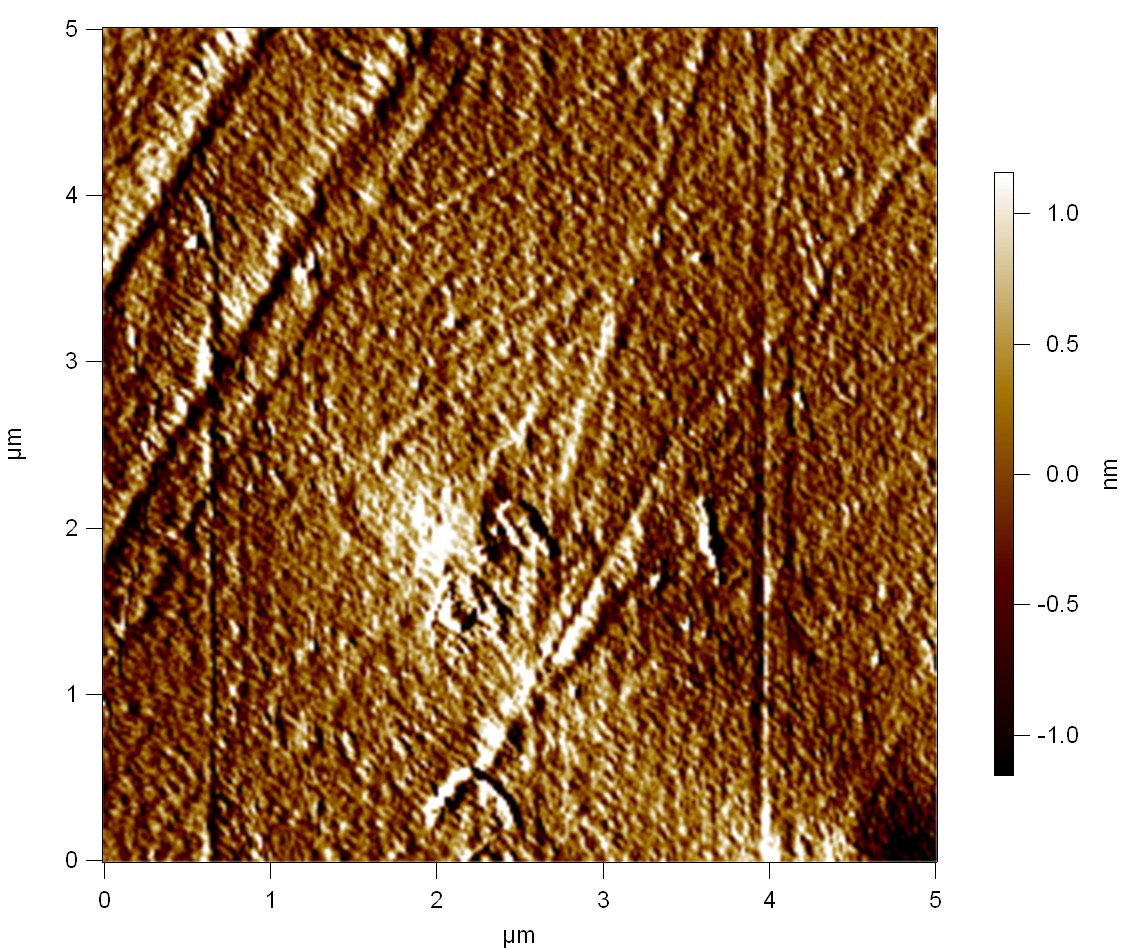
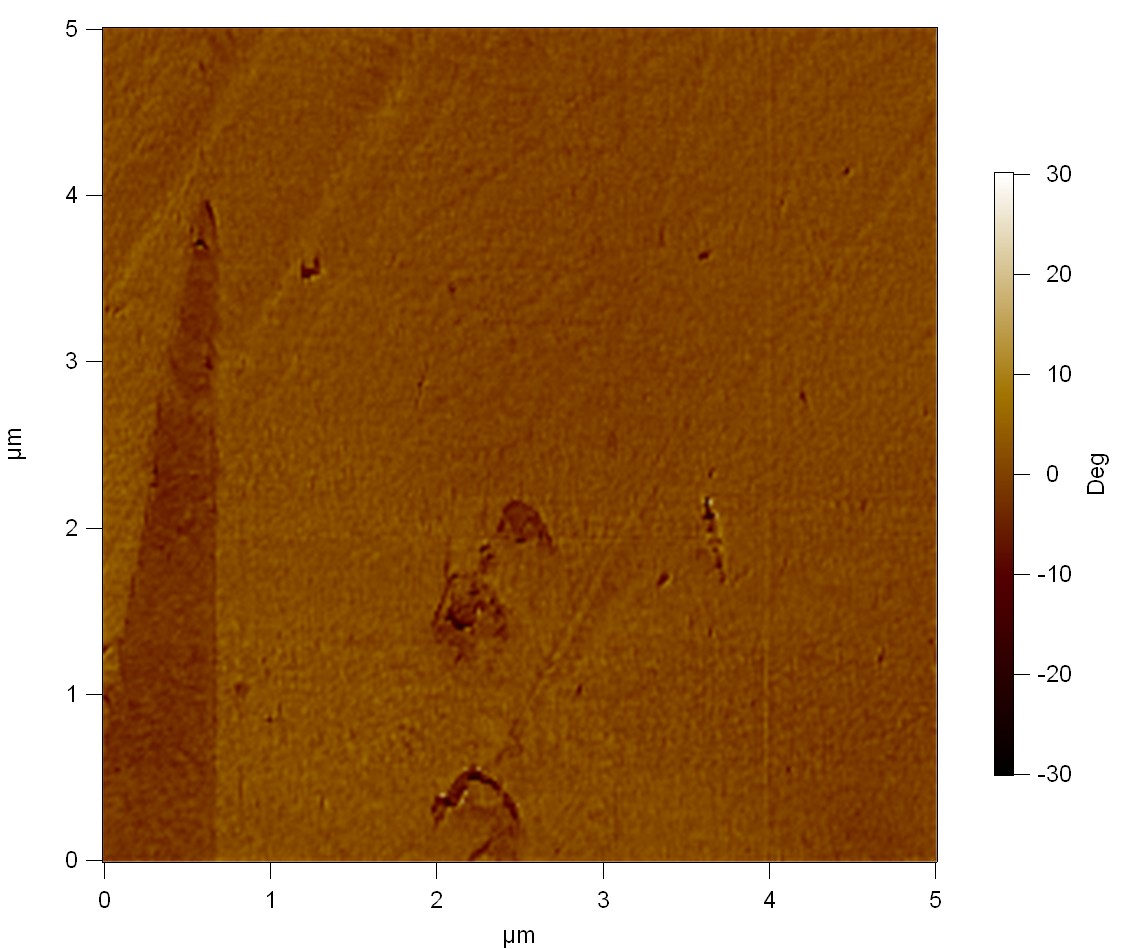
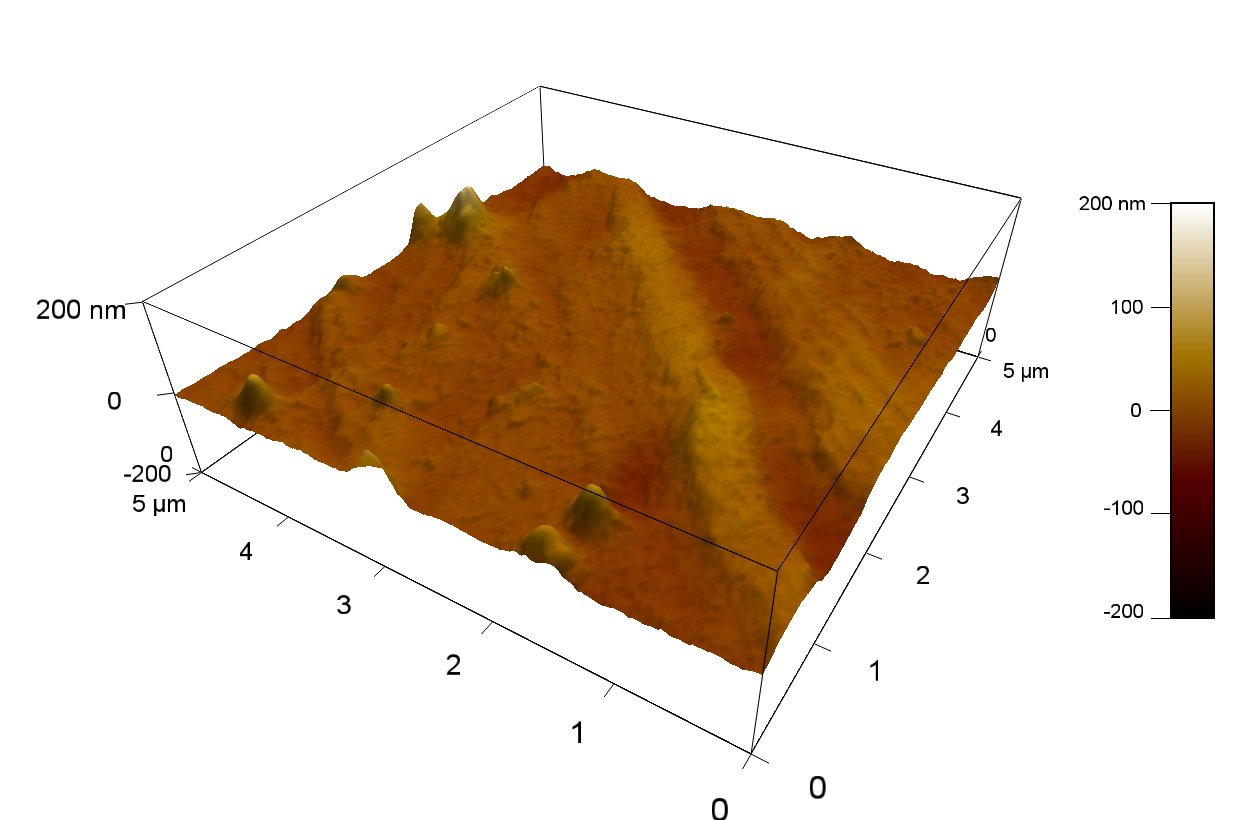
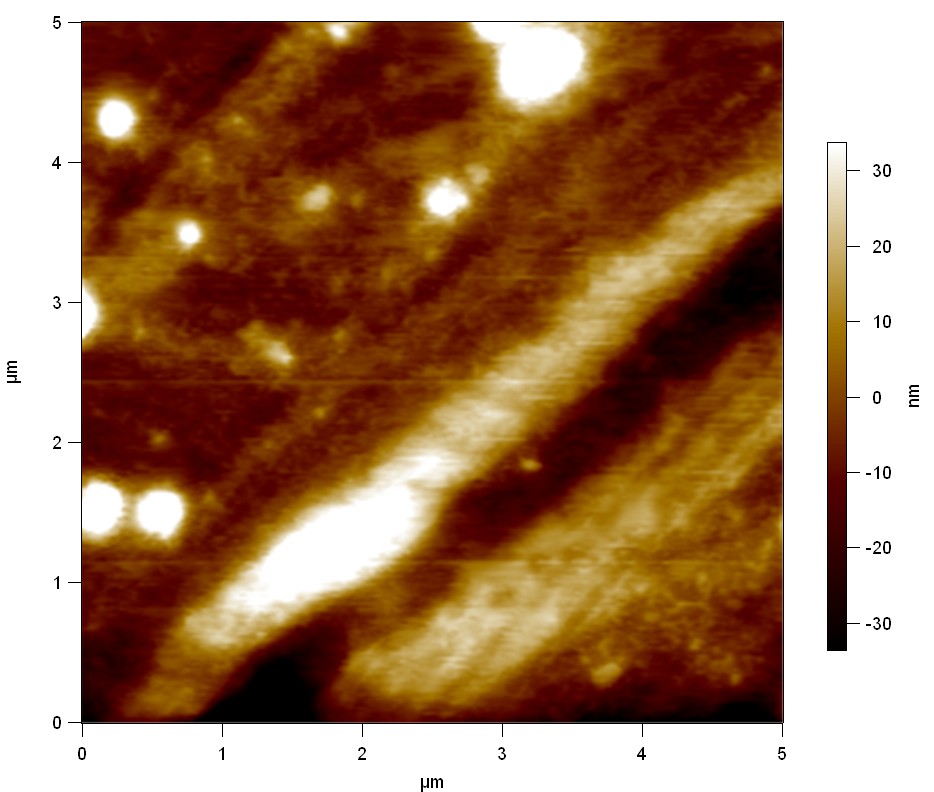
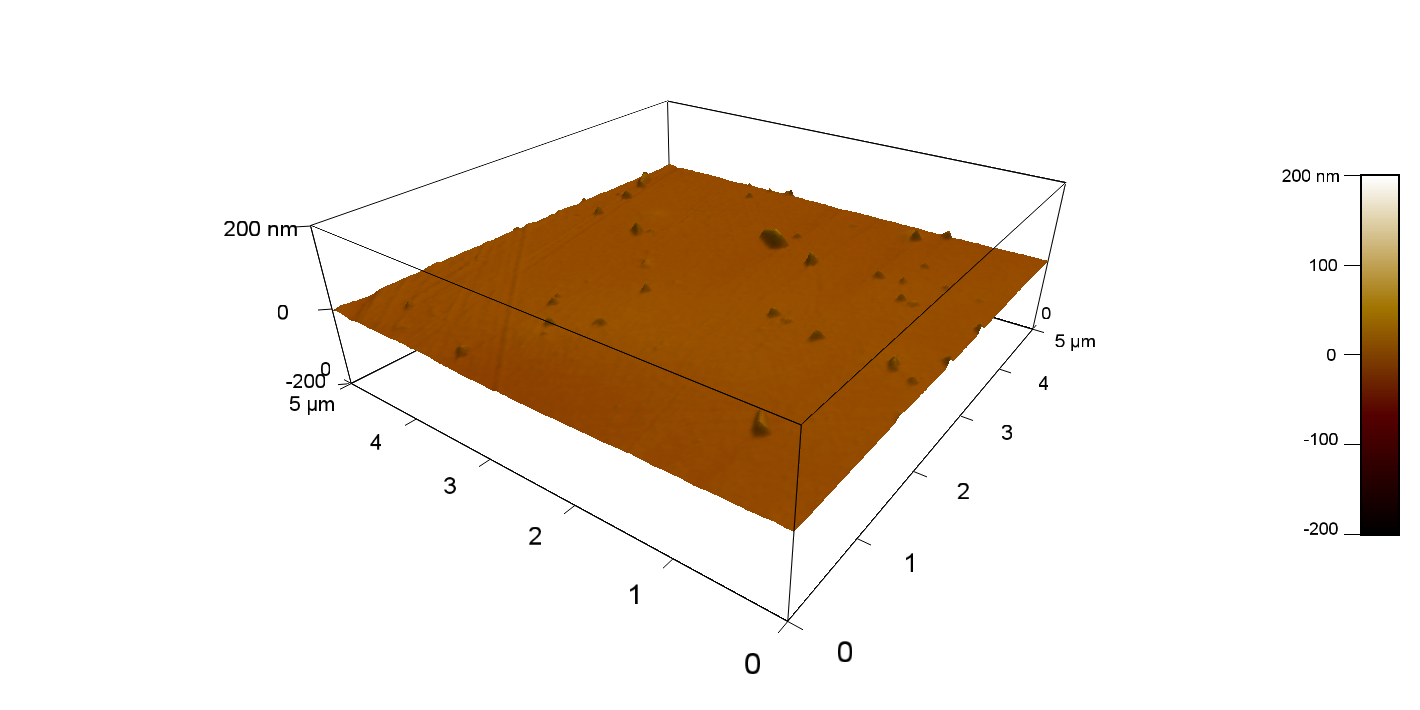
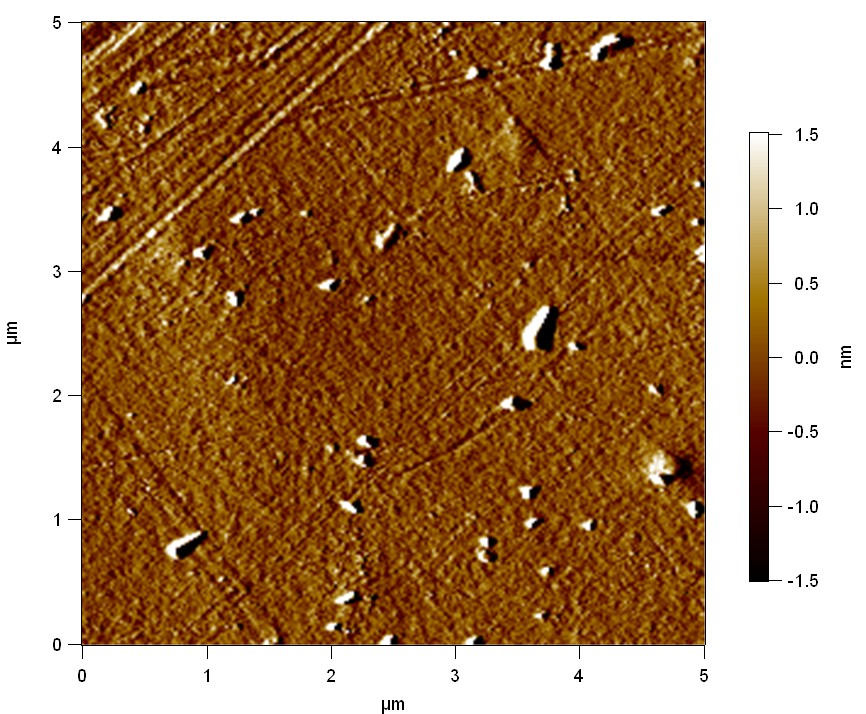
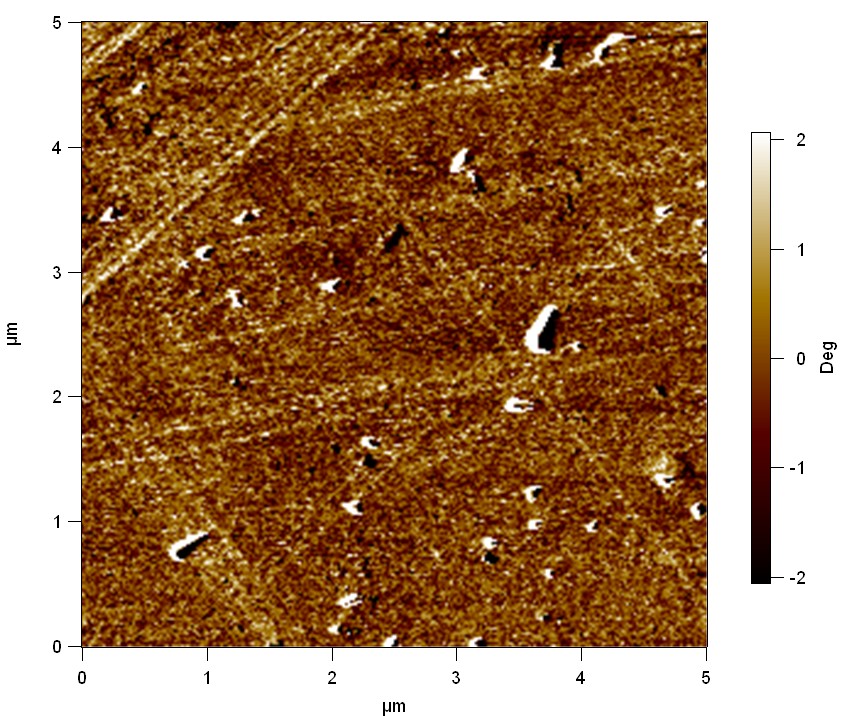
The Pictures below show 3D models, height profiles and the cantilevers amplitude as well as the phase deviations. The 3D models give a first impression of the texture of the surface. Looking at the height profile and the amplitude deviation more detailed informations about the surface texture can be obtained. The reference as well as the pNB-Est13 treated samples show a very flat surface (±3 nm). Bigger deviations are due to manufactionary mistakes of the foil. FsC treated surfaces show a deviation ten times bigger than non treated ones (±30 nm). Comparing the phase deviation of FsC treated surfaces with the reference, there can be seen big diferences due to varying mechanical properties. These are caused by degradation by FsC. The Polymer chains are cut in to smaller pieces which then stand out of the surface, letting it swell. The resulting surface is not only rougher but persumably less dense and therefore less firm.
AFM of PET foil after pNB-Est13 exposure : (2 µmol/L)
AFM of PET foil after pNB-Est13 exposure : (20 µmol/L)
AFM of PET foil after pNB-Est13 exposure : (50 µmol/L)
AFM of PET foil after FsC exposure :
AFM of PET foil as reference :
 "
"

