Team:TU Darmstadt/Modeling
From 2012.igem.org
| Home | | Team | | Official Team Profile | | Project | | Parts Submitted to the Registry | | Modeling | | Notebook | | Safety | | Attributions |
|---|
If you choose to include a Modeling page, please write about your modeling adventures here. This is not necessary but it may be a nice list to include.
Contents |
Modeling
Homologie Modeling
While our proteins are functionally described in literature and during the IGEM competition, no structures are available in the protein data bank. For further work and visualizations protein structures are indispensible. We used Yasara Structure [1] to calculate 3-dimensional structures of our proteins we used within the IGEM.
Workflow
Description how our Yasara scripts calculates homology model[7]:
- Sequence is PSI-BLASTed against Uniprot [2]
- Calculation of a a position-specific scoring matrix (PSSM) from related sequences
- Using the PSSM to search the PDB for potential modeling templates
- The Templates are ranked based on the alignment score and the structural quality[3]
- Deriving additional information’s for template and target (prediction of secondary structure, structure-based alignment correction by using SSALN scoring matrices [4].
- A graph of the side-chain rotamer network is built, dead-end elimination is used to find an initial rotamer solution in the context of a simple repulsive energy function [5]
- The loop-network is optimized using a high amount of different orientations
- Side-chain rotamers are fine-tuned considering electrostatic and knowledge-based packing interactions as well as solvation effects.
- An unrestrained high-resolution refinement with explicit solvent molecules is run, using the latest knowledge-based force fields[6].
Application
All these steps are performed to every template used for the modeling approach. For our project we set the maximum amount of templates to 20. Every derived structure is evaluated using an average per-residue quality Z-scores. At least a hybrid model is built containing the best regions of all predictions. This procedure make prediction’s accurate and thus more realistic.
Results
PnB-Esterase
AroY
TphA1
TphA2
TphA3
TphA2
References
[1] E. Krieger, G. Koraimann, and G. Vriend, “Increasing the precision of comparative models with YASARA NOVA--a self-parameterizing force field.,” Proteins, vol. 47, no. 3, pp. 393–402, 2002.
[2] S. F. Altschul, T. L. Madden, A. A. Schäffer, J. Zhang, Z. Zhang, W. Miller, and D. J. Lipman, “Gapped BLAST and PSI-BLAST: a new generation of protein database search programs.,” Nucleic Acids Res, vol. 25, no. 17, pp. 3389–3402, Sep. 1997.
[3] R. W. Hooft, G. Vriend, C. Sander, and E. E. Abola, “Errors in protein structures.,” Nature, vol. 381, no. 6580. Nature Publishing Group, p. 272, 1996.
[4] D. T. Jones, “Protein secondary structure prediction based on position-specific scoring matrices,” Journal of Molecular Biology, vol. 292, no. 2, pp. 195–202, 1999.
[5] A. A. Canutescu, A. A. Shelenkov, and R. L. Dunbrack, “A graph-theory algorithm for rapid protein side-chain prediction.,” Protein Science, vol. 12, no. 9, pp. 2001–2014, 2003.
[6] E. Krieger, K. Joo, J. Lee, J. Lee, S. Raman, J. Thompson, M. Tyka, D. Baker, and K. Karplus, “Improving physical realism, stereochemistry, and side-chain accuracy in homology modeling: Four approaches that performed well in CASP8.,” Proteins, vol. 77 Suppl 9, no. June, pp. 114–122, 2009.
[7] http://www.yasara.org/homologymodeling.htm
Information Theoretical Analysis
Information Theory
Entropy
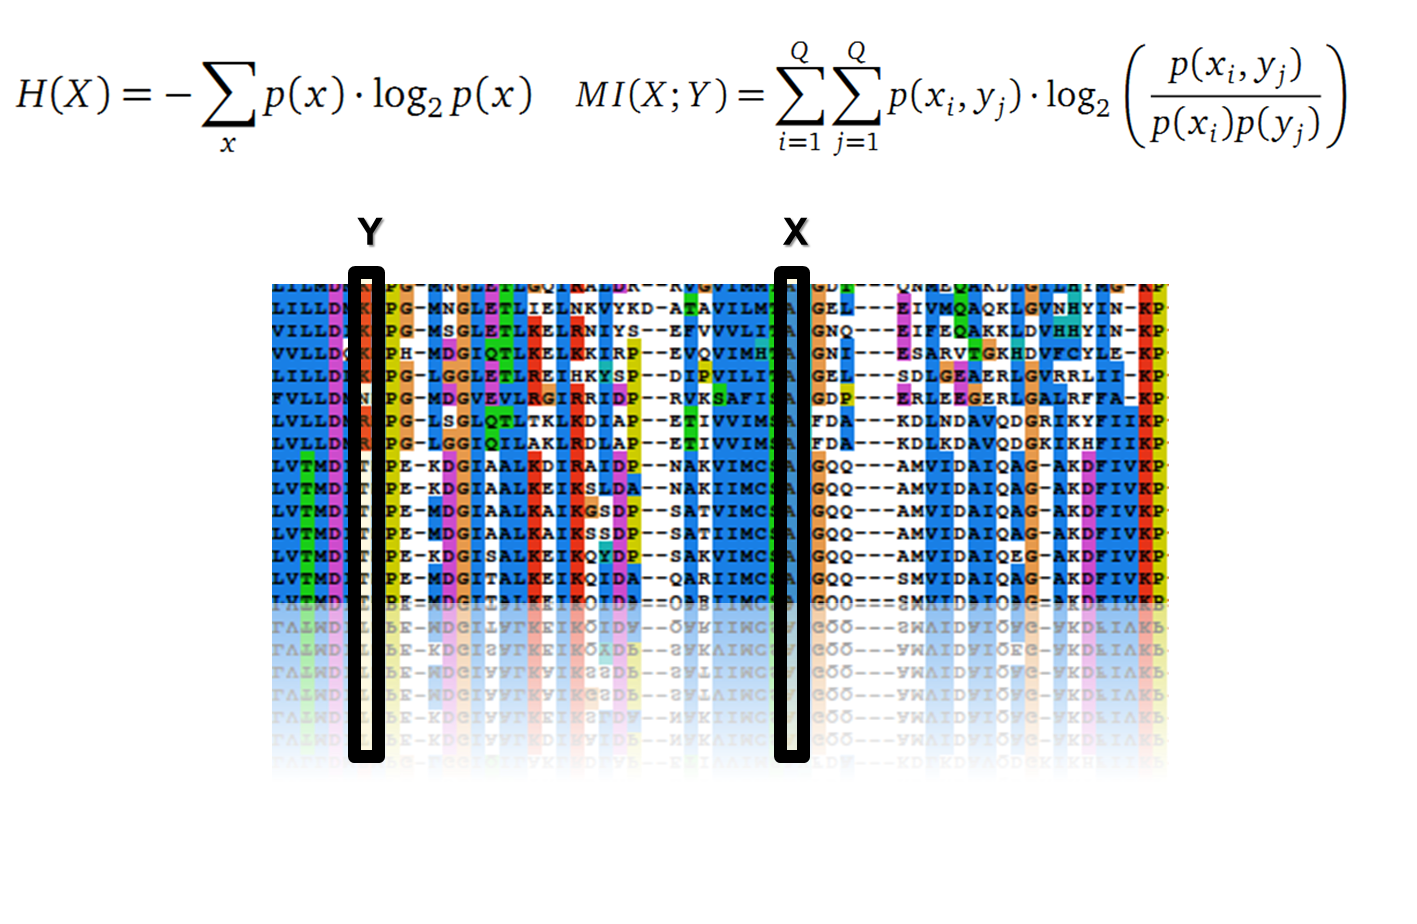
Claude Shannon created a new measurement approach of uncertainty of a random variable X. This measurement is called Shannon’s entropy H [1] which is measured in bit, if a logarithm to the base 2 is used. p(x) denotes the probability mass function of a random variable X.
Mutual Information
In information theory, Mutual information (MI) is a correlations measure of two random variables X and Y . H(X) and H(Y ) are the Shannon entropy values of the random variables X and Y. H(X, Y ) is the two-point entropy. Moreover , the MI quanti?es the amount of information of variable X by knowing Y and vice versa.
Application of MI to sequence Alignments
It is well known that the MI can be used to measure co-evolution signals in multiple sequence alignments (MSA)[2] [3] . An MSA serves as a comparison of three or more sequences used to investigate the functional or evolutionary homology of amino acid or nucleotide sequences. The MI of an MSA can be computed with the following equation derived from the Kullback-Leibler-Divergence (DKL):
with p(x) and p( y) being the frequency counts of symbols in column X and Y of the MSA. The joint frequency describe the occurrence for the amino acids xi and yj(p(x, y)) and Q is the set of Symbols derived from the corresponding alphabet (DNA or Protein). The result of these calculations is a symmetric matrix M which includes all combined MI values for any two columns in an MSA. A dependency of two columns acids shows high MI values.
Normalisation
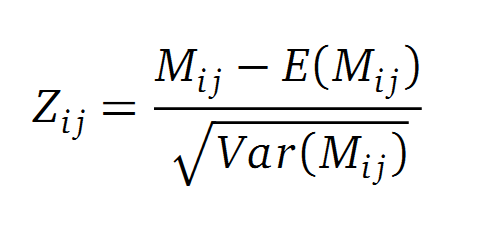
A standard score (Z-score) indicates how many standard deviations a value differs from the mean of a normal distribution. MI dependent Z-scores can be calculated with a shuffle-null model, where the symbols in MSA column are shuffled and every dependencies of the column pairs are eliminated. The expectation value for the shuffle-null model is described by E(Mi j) and its corresponding variance by Var(Mi j) [4].
Results
=Cutinase
PnB-Esterase
Docking Simulations
Gaussian network model
Theory
Nearly all biologically important processes such as enzyme catalysis,ligand binding and allosteric regulation occur on a large time-scale (micro- to millisecond). A Gaussian network model (GNM) is a coarse-grained representation of a protein as an network consisting of balls and springs. In our approach, proteins are represented by balls corresponding to the CA –atom of each residue[1] . While Molecular Dynamics (MD) simulations are computational expensive, a GNM calculation only needs a few seconds.
Computation
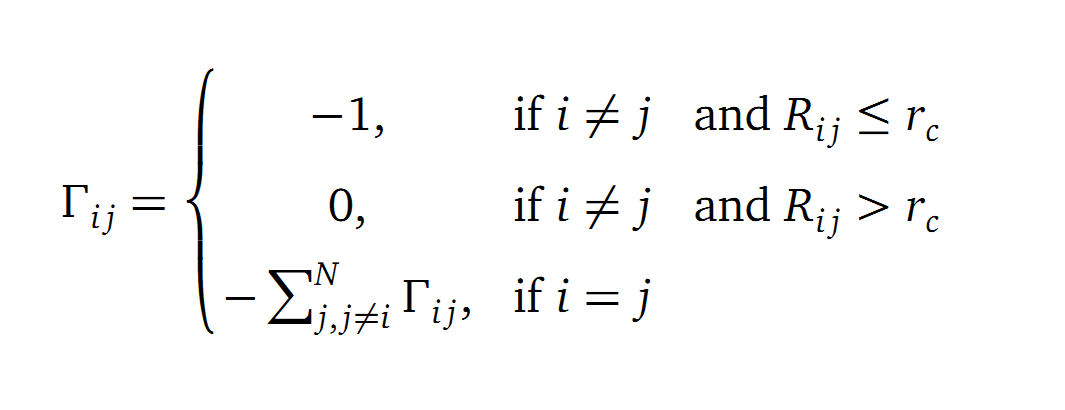
The dynamics of the structure in the GNM is described by the topology of contacts within the Kirchhoff matrix G. Thus in this network of N interacting sites, the elements of G are computed as:
where Rij is the distance between point i and j. We used Gamma as the intra CA-contact matrix. The inverse of it describes correlations between fluctuations within the proteins native state. The diagonal of the matrix is replaced by the sum of contacts of one CA-atom within the whole protein. After a singular value decomposition (SVD) we have calculated the normal modes of the protein. Slow modes describe functionally relevant residues within a biomolecule[2]. The opposite, Fast modes, represent an uncorrelated motion without significant changes in the structure.
A recent examination of the X-ray crystallographic B-factors of over 100 proteins showed that the GNM closely reproduces the experimental data [3].
Application to our Proteins
We computed the GNM in R [4] by using the BioPhysConnectoR [5] library.
- pnB-Esterase
- Fusarium solani cutinase
References
[1] A. R. Atilgan, S. R. Durell, R. L. Jernigan, M. C. Demirel, O. Keskin, and I. Bahar, “Anisotropy of fluctuation dynamics of proteins with an elastic network model.,” Biophys J, vol. 80, no. 1, pp. 505–515, Jan. 2001.
[2] C. Chennubhotla, A. J. Rader, L.-W. Yang, and I. Bahar, “Elastic network models for understanding biomolecular machinery: from enzymes to supramolecular assemblies.,” Physical Biology, vol. 2, no. 4, pp. S173–S180, 2005.
[3] I. Bahar and A. J. Rader, “Coarse-grained normal mode analysis in structural biology.,” Current Opinion in Structural Biology, vol. 15, no. 5, pp. 586–592, 2005.
[4] R. D. C. Team, “R: A Language and Environment for Statistical Computing.” Vienna, Austria, 2008.
[5] F. Hoffgaard, P. Weil, and K. Hamacher, “BioPhysConnectoR: Connecting sequence information and biophysical models.,” BMC Bioinformatics, vol. 11, p. 199, 2010.
 "
"


