Team:Cambridge/Project/Results
From 2012.igem.org


Contents |
Results
Set out below are the developments the team has made over the summer, in tackling our aim and objectives.
RiboSense
Ratiometrica
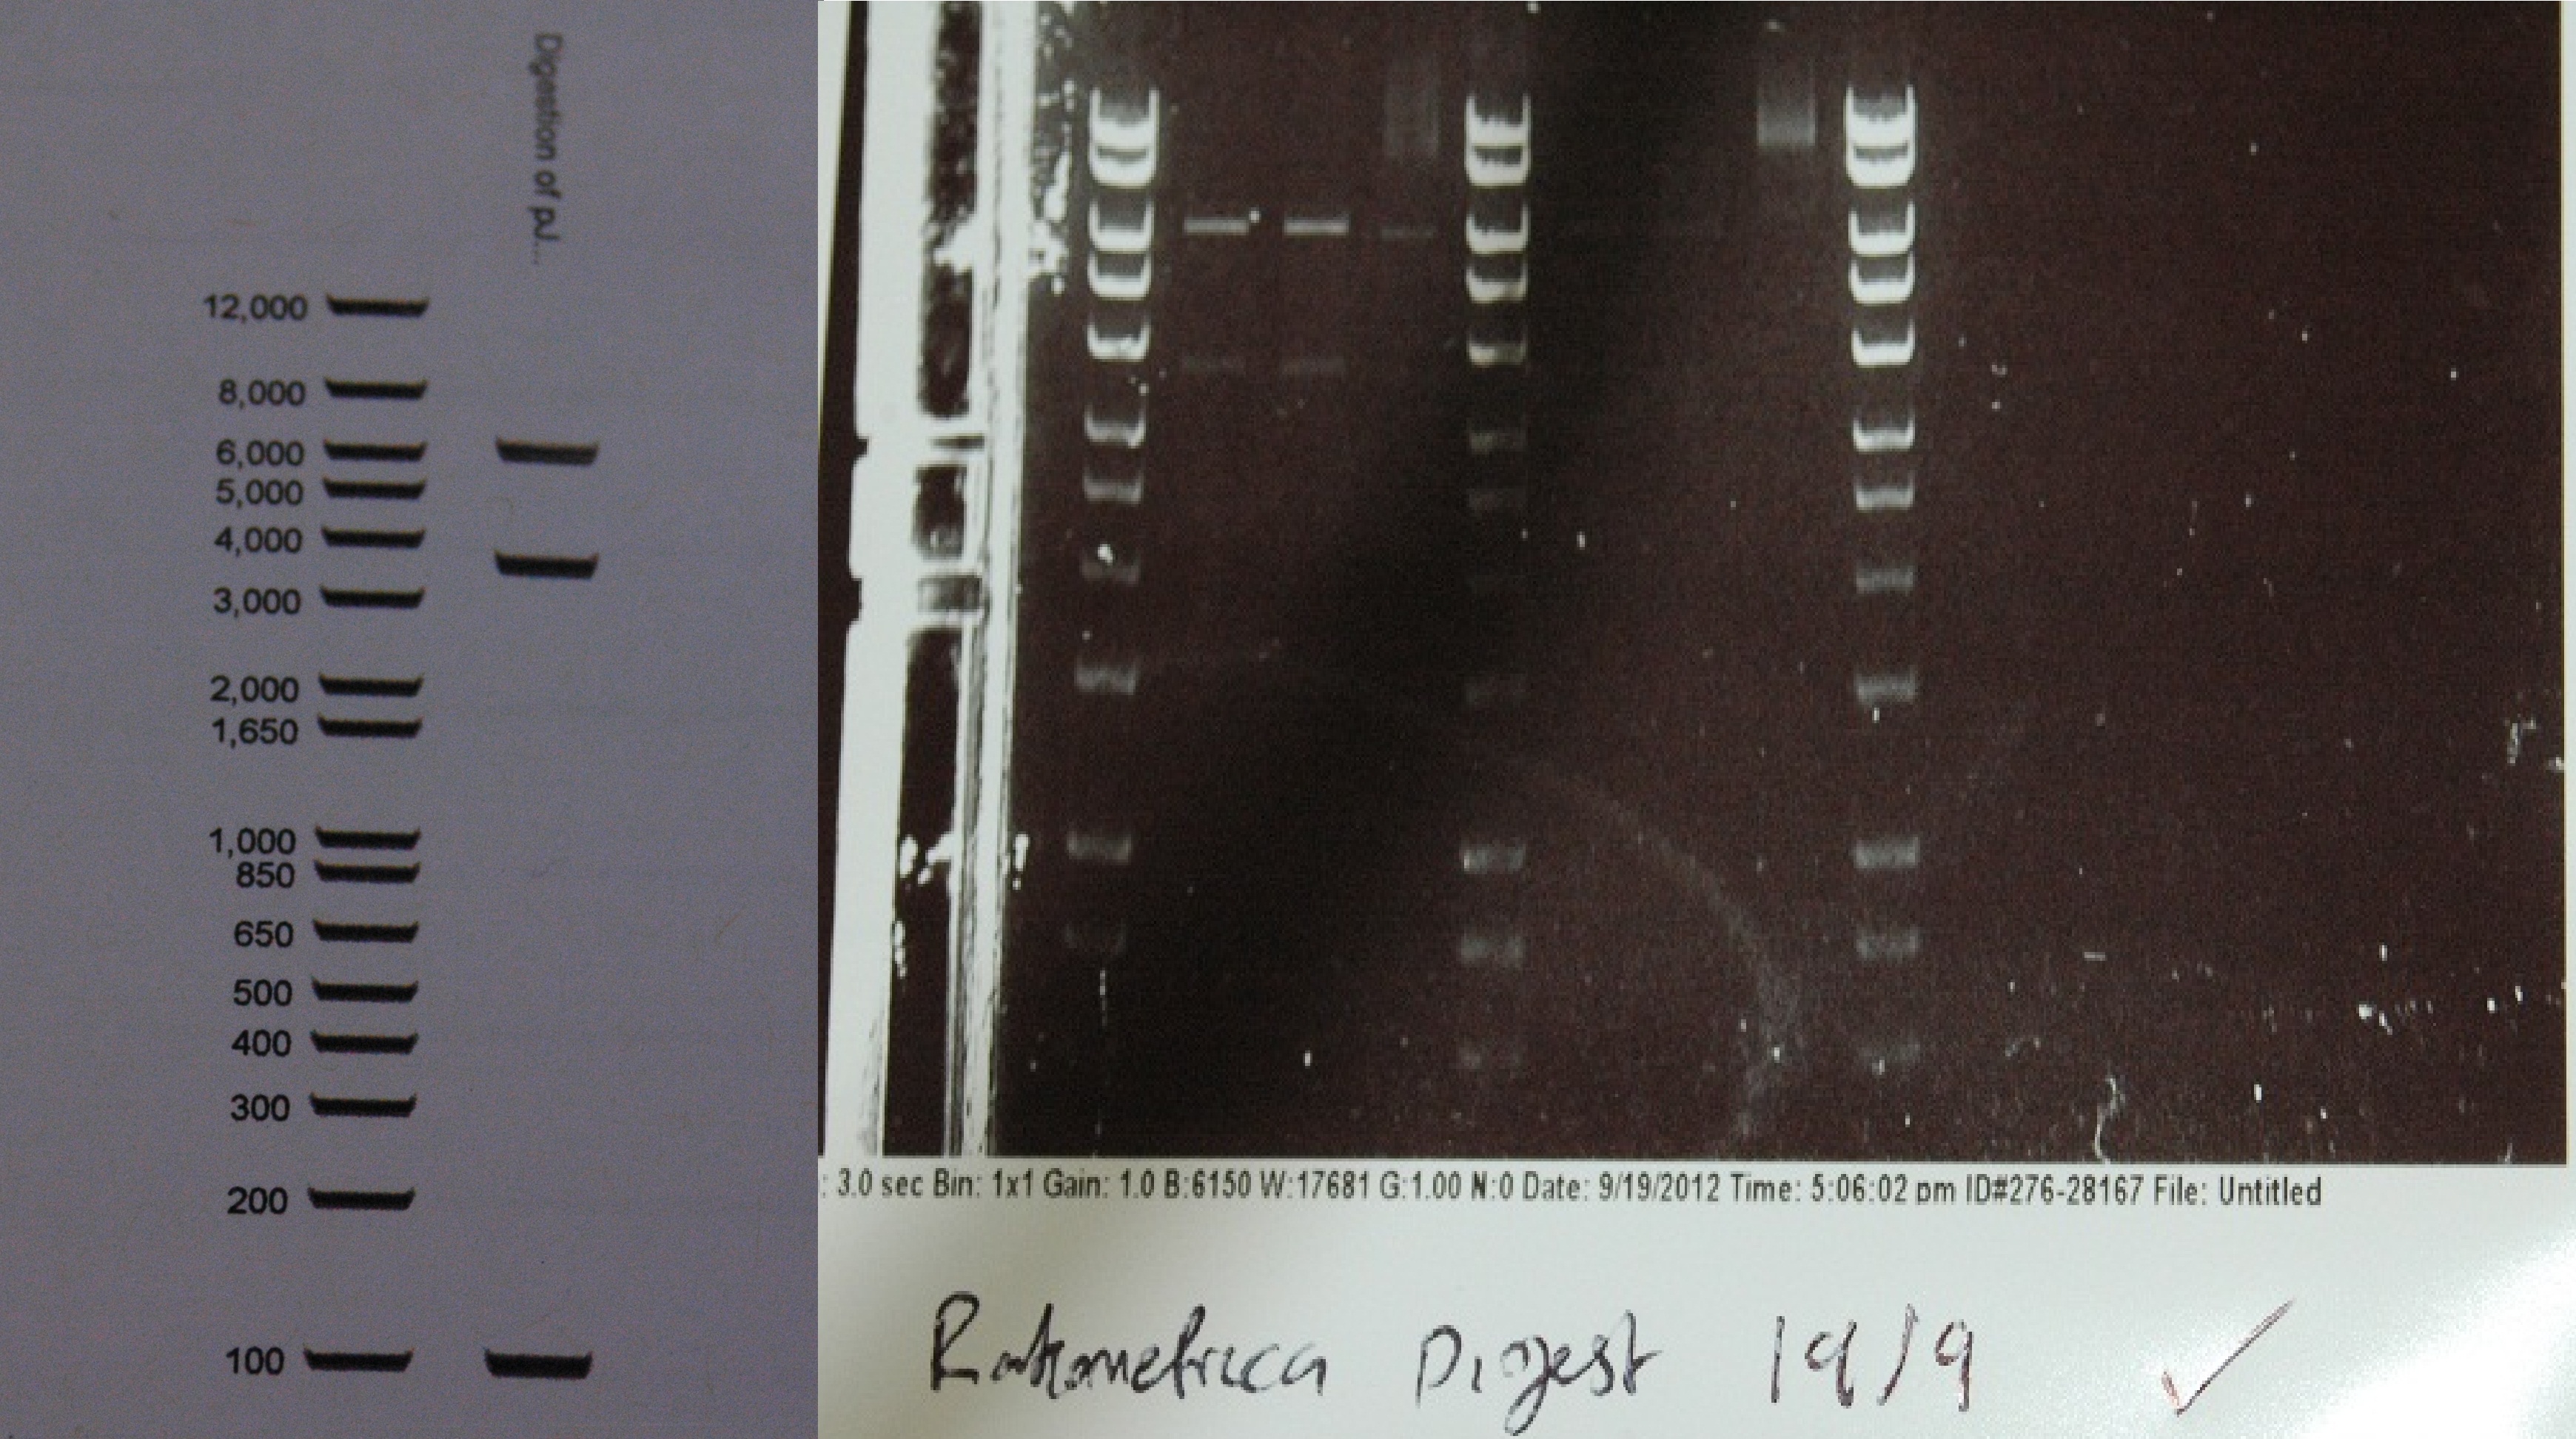
After a lot of technical difficulties, we were able to assemble our fluorescent construct using Gibson assembly. The photo below shows the predicted and obtained digest pattern using HINDIII.
Our ratiometric luciferase construct arrived with full sequence coverage. Unfortunately, it was unexpectedly toxic. This hampered characterisation, and necessitated its submission to the registry in a low copy number backbone.
TO ADD:
luminescence images orange, cosegregation
Instrumentation (Biologger)
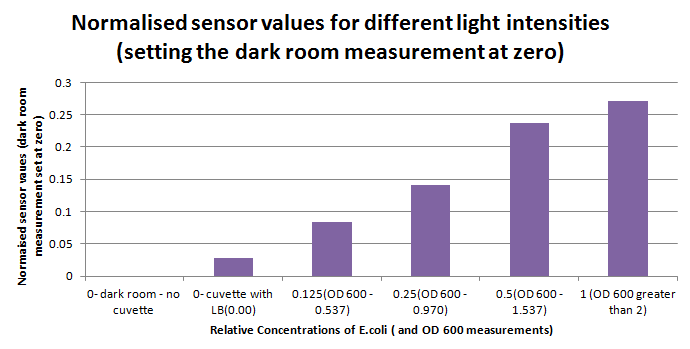
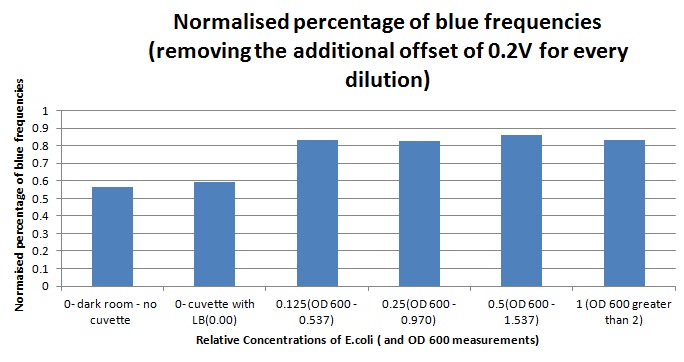
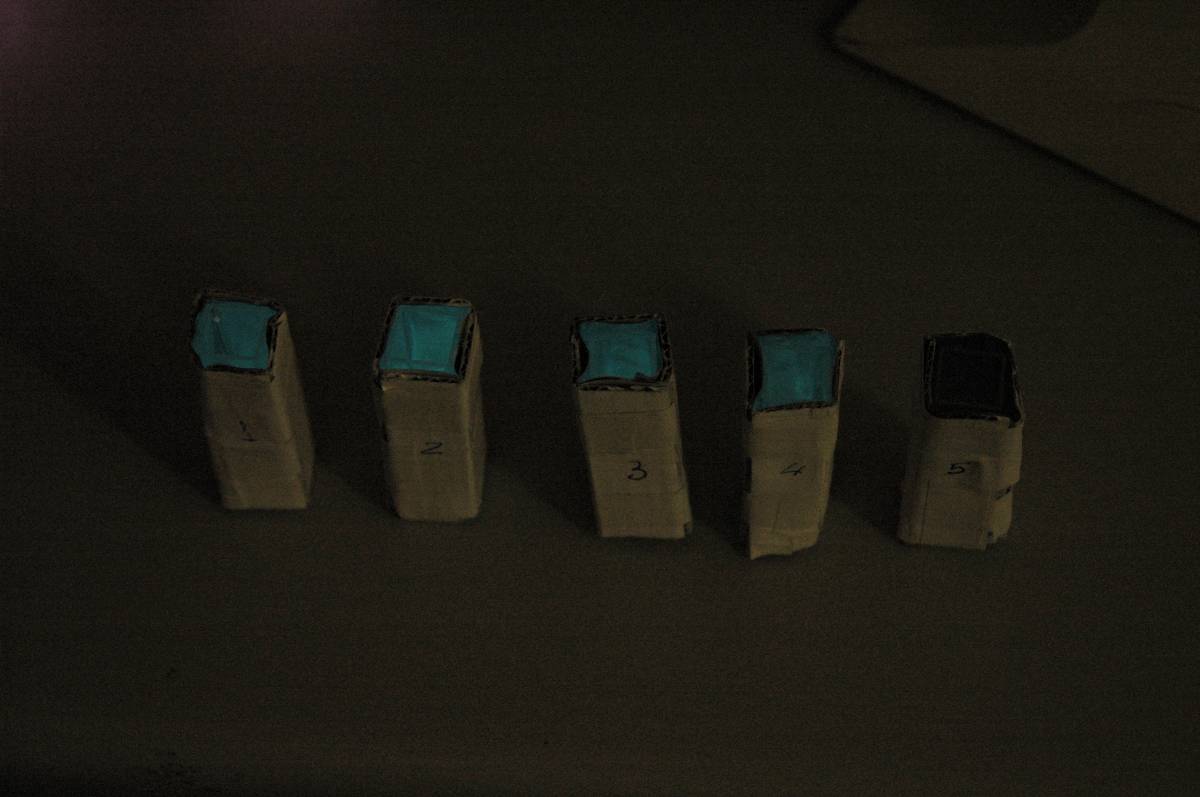
Having our instrumentation completed, as can be seen in our Instrumentation (Biologger) page, the sensitivity of the sensor placed in the right position was tested using a dilution series of luciferase-producing E.coli. 20ml Cultures were grown overnight from single colonies. The cultures were induced with 40ul of 1.5M arabinose (for a final concentration of 3mM). Cultures were left for 2 1/2 hours for full induction. Subsequently, a culture was pelleted and resuspended in 4ml LB. Doubling dilutions, of volume 2ml, were made from this concentrate, down to 1/8th concentration. 1ml of each 2ml dilution was analysed in each cuvette, which was placed in the cuvette holder we made ourselves. The result was very good. An almost linear relationship was obtained when data were normalised with the sensor value taken in the dark room (the latter set at zero) without using the cuvette holder (1-(sensor value/sensor value in absolute dark)), presenting the sensitivity of the sensor to different intensities of light. This behaviour was expected due to the changing offset affecting the luciferase spectrum curve at different light intensities. The offset, using our data, was calculated to be about 0.2V for each dilution. A second graph is shown which takes into account this offset (and removes it), thus showing the presence of blue frequencies. The result was as expected, as the presence of blue frequencies throughout the dilution series is not only detected, but also found to be approximately constant. The raw data of this investigation can be found in the Lab book.
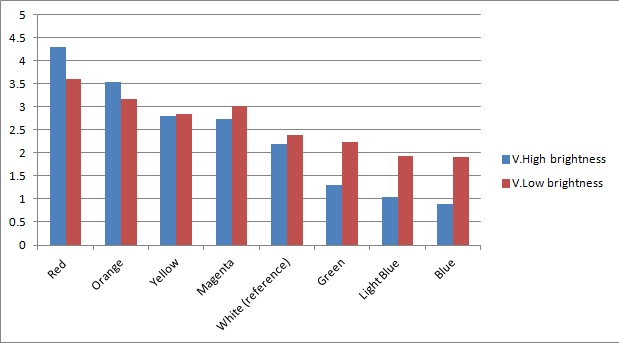
Once the sensor was tested for sensitivity, we tested that our circuitry correctly identified different frequencies (colours) of light. As can be seen below, measurements taken from orange and blue light yield values respectively above and below those from white light (our reference point). The data was taken using constant intensity of light for each case (V.High and V.Low brightness, as specified in the application). This was done with the aid of an Android phone and a specialised software application, called Color Flashlight, downloaded from the official Market.
As expected from the potential-divider design of our circuitry, orange and red frequencies caused the resistance of the LDR with the orange filter to decrease, leading to a higher voltage across the LDR with the blue filter. The opposite effect was observed with blue light. The reason that the white reference point is a bit lower than 2.5V (the expected value for a non-biased circuitry with a 5V source), is because we use resistors of total net resistance 1.67 kΩ before the blue LDR. This was done to bias the circuitry towards blue (i.e. decreasing the starting value, thus the sensor identifies always a bit more blue - this can be shown in previous graphs as well) and thus cause orange light to have a larger impact when present. This was used in an attempt to compensate for the fact that the peak at 560nm (Orange) in MOrange/luciferase fusion spectrum is lower than the one at 490 nm (Blue). Even though we did not manage to test the latter with transformed bacteria, the data collected in all the previous experiments makes us confident that the instrumentation is at least adequately functional.
As the major part of the instrumentation, the bio-electronic interface, had been made and tested, now we turned to testing the other parts of our deveoped kit. This included the mechanical chassis of the prototype, the electronic/mechatronic (sensory and motory) components, and of course the software. The overview of the finished hardware/software can be seen in our Intstrumentation (Biologger) page. Below, the videos showing our instrumentation in action can be seen.
 "
"
