Team:TU Darmstadt/Labjournal/Metabolism
From 2012.igem.org
Labjournal Metabolism
week 1 (14.-18.05.12)
Other
- Reconstitution of C. testosteroni KF-1 according to DSMZ [http://www.dsmz.de/fileadmin/Bereiche/Microbiology/Dateien/Kultivierungshinweise/engl_Opening.pdf protocol]
- Cultivation of C. testosteroni KF-1 on agar plates with [http://www.dsmz.de/microorganisms/medium/pdf/DSMZ_Medium1.pdf Medium 1]
- Production of chemically competent E. coli DH5α and E. coli BL21(DE3)pLysS cells
week 2 (21.-25.05.12)
tphA1
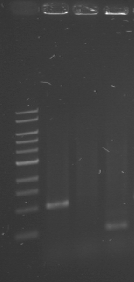
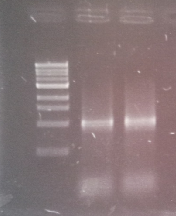
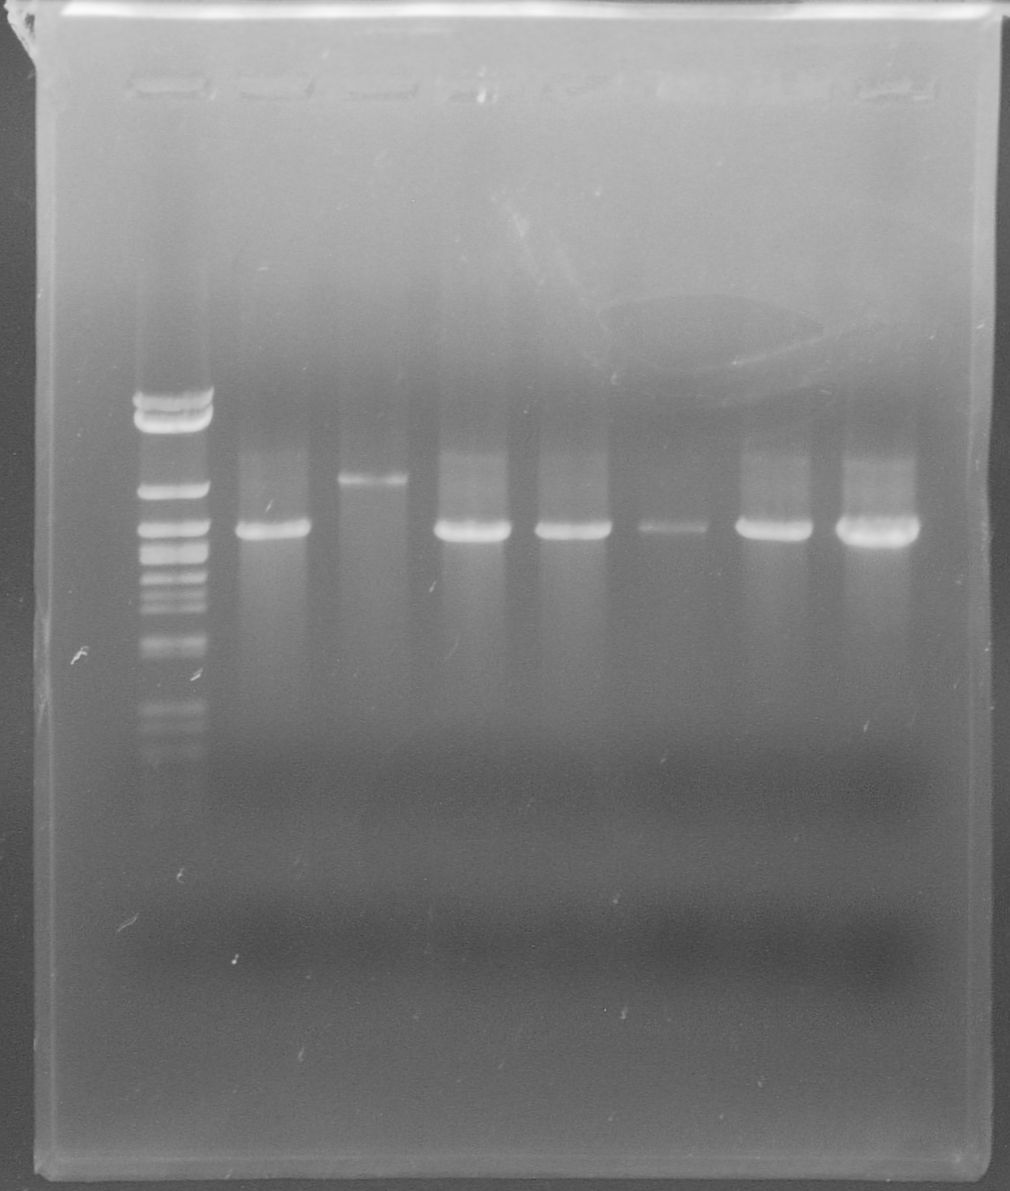
- Isolation of the gene from C. testosteroni KF-1 genome using colony-PCR
- Annealing temperature: 49 °C
- Primer: tphA1-l-F and tphA1-l-R
- Both PCR products were purified via gel extraction
- Concentrations measured by Nanodrop
PCR product Concentration [ng/µl] tphA1 0.6
tphA3
- Isolation of the gene from C. testosteroni KF-1 genome using colony-PCR
- Annealing temperature: 59 °C
- Primer: tphA3-l-F and tphA3-l-R
- Both PCR products were purified via gel extraction
- Concentrations measured by Nanodrop
PCR product Concentration [ng/µl] tphA3 0.1
tphB
- Isolation of the gene from C. testosteroni KF-1 genome using colony-PCR
- Annealing temperature: 59 °C
- Primer: tphB-l-F and tphB-l-R
- Both PCR products were purified via gel extraction
- Concentrations measured by Nanodrop
PCR product Concentration [ng/µl] tphB 0.1
Other
- Transformation and midi prep of all used Biobricks
- Concentrations measured by Nanodrop
Biobrick Concentration [ng/µl] BBa_K316003 114.9 BBa_J23100 450.2 BBa_B0015 314.1 BBa_J61101 86.1
week 3 (28.05.-01.06.12)
tphA1
- Two PCRs were performed to mutate the PstI site in the wild type gene. The primer tphA1-l-PstI(99)-R and tphA1-l-PstI(99)-F respectively introduced a BsaI site
- tphA1 fragment 1
- PCR on tphA1 isolated from C. testosteroni
- Annealing temperature: 69 °C
- Primer: tphA1-l-PstI(99)-R and tphA1-l-R
- tphA1 fragment 2
- PCR on tphA1 isolated from C. testosteroni
- Annealing temperature: 69 °C
- Primer: tphA1-l-PstI(99)-F and tphA1-l-F
- Both PCR products were purified via gel extraction
- Concentrations measured by Nanodrop
PCR product Concentration [ng/µl] Fragment 1 40.3 Fragment 2 62.1
- Both fragments were cut with BsaI in a restriction
- The ligation mix differed from our standard protocol in the following manner
- 100 ng of fragment 1
- 200 ng of fragment 2
- 2 µL of 10x reaction buffer
- 1 µL of T4 DNA ligase
- add DI water up to 20 µL
- incubate for 15 minutes at 37 °C
- PCR on ligation mix
- Annealing temperature: 59 °C
- Primer: tphA1-l-R and tphA1-l-F
- The PCR product was purified via gel extraction
- Concentrations measured by Nanodrop
- The ligation mix differed from our standard protocol in the following manner
PCR product Concentration [ng/µl] Mutated tphA1 86.1
week 4 (04.-08.06.12)
Other
- restriction digest of BBa_K316003 by EcoRI and PstI
- Purification of plasmid backbone pSB1C3 via gel extraction
- Concentrations measured by Nanodrop
Plamid backbone Concentration [ng/µl] pSB1C3 42.6
- restriction digest of BBa_K316003 by XbaI and PstI
- Purification of insert xylE-dT via gel extraction
- Concentrations measured by Nanodrop
Insert Concentration [ng/µl] xylE-dT 22.2
week 5 (11.-15-06.12)
Other
- restriction digest of BBa_J23100 by SpeI and PstI
- Dephosphorylation of the restriction
- Ligation of BBa_J23100 (cut with SpeI and PstI) and xylE-dT (cut with XbaI and PstI)
- Transformation of the ligation mix
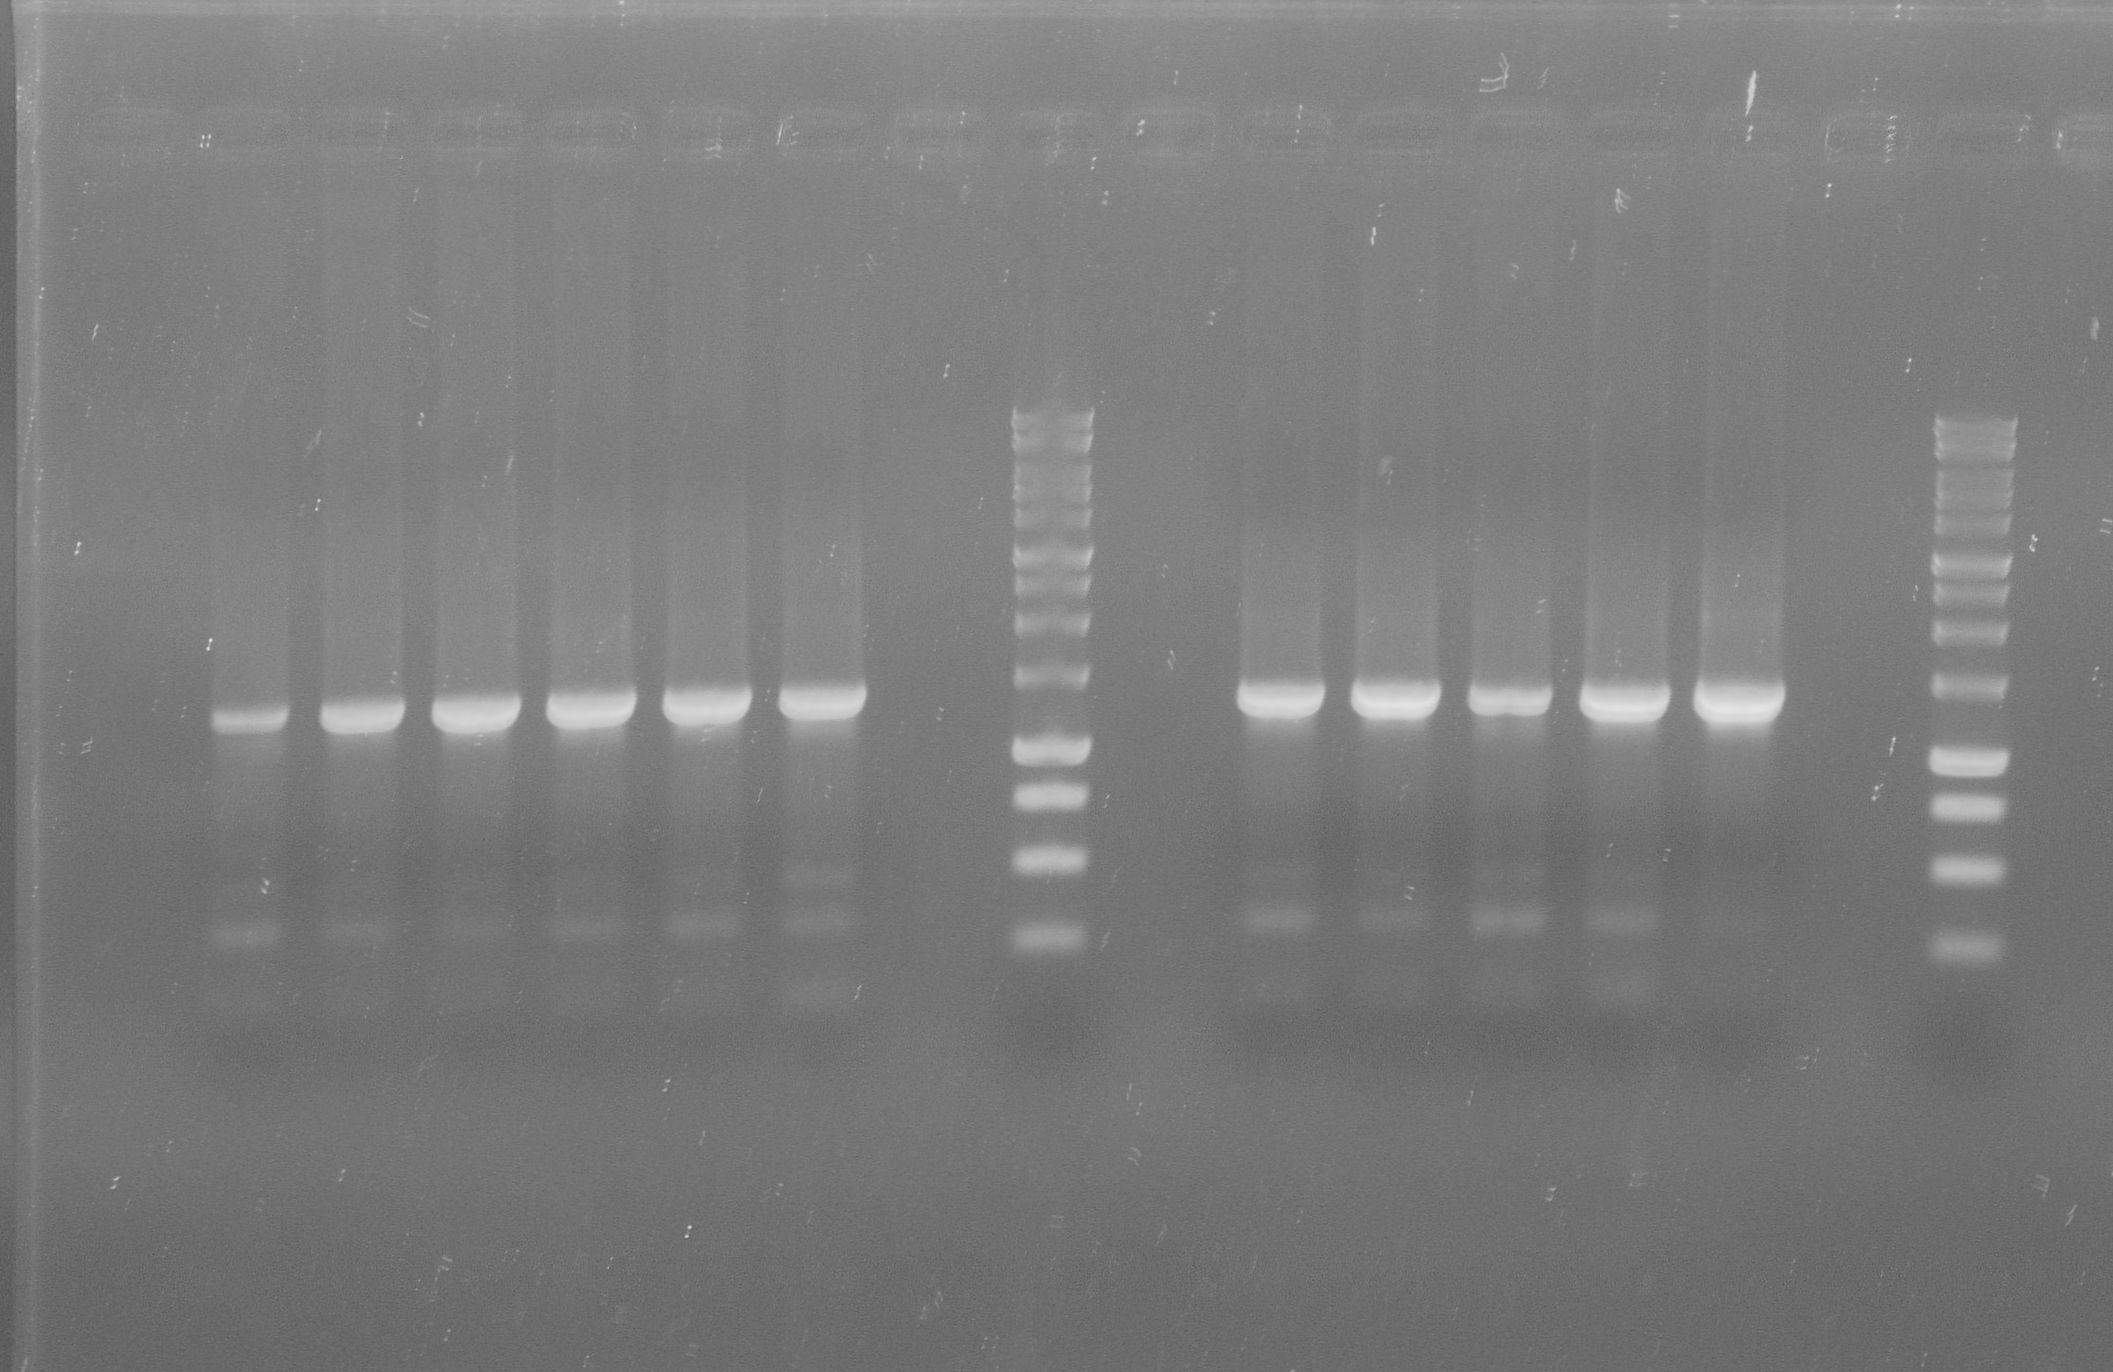
- colony-PCR of the transformation for verification
- After overnight incubation of colony x in LB medium with ampicilin a glycerine stock was made
week 6 (18.-22.06.12)
- No work progress
week 7 (25.-29.06.12)
Other
- Funktional testing of BBa_J23100-xylE-dT
- We inoculated 2 x 50 mL LB-medium-ampicilin with 10 µl of the glycerine stock BBa_J23100-xylE-dT
- After incubation we centrifuged the culture at 4600x g for 10 minutes
- We resuspended each pellet with the 1000 µL pipette in 3 mL PBS buffer and added PBS to 120 ml
- We added 2 mL of 0.5 M catechol solution to the first cell suspension
- We added 2 ml of 0.5 M protocatechuic acid to the second cell suspenion
- We observed in either colony a colour change from colourless to light yellow.
- Conclusion: XylE accepted protocatechuic acid as substrate.
- Kinetik mesure of XylE with protocatecuic acid as substrate.
- We inoculated 50 mL LB-medium-ampicilin with 10 µl of the glycerine stock BBa_J23100-xylE-dT
- After incubation we centrifuged the culture at 4600x g for 10 minutes
- We resuspended each pellet with the 1000 µL pipette in 3 mL PBS buffer and added PBS to 15 ml
- After cell disruption we centrifuged the suspension at 9600 rpm for 20 min and decant the supernatant in a fresh tube.
- For the kinetik we prepared this standard concentrations:
| Nummer | Standard [mM] |
| 1 | 1 |
| 2 | 2 |
| 3 | 5 |
| 4 | 10 |
| 5 | 12,5 |
| 6 | 15 |
| 7 | 20 |
- We measure the kinetik at wave length= 380 nM for 2 min and calculate the inital speed. From which we created a Michaelis Menten plot.
| [Protocatecuatuic acid] mM | Velocity units per minute |
| 1 | 0 |
| 2 | 0 |
| 5 | 0 |
| 10 | 0 |
| 12,5 | 0,285 |
week 8 (02.-06.07.12)
- No work progress
week 9 (09.-13.07.12)
Other
- Designing primers with prefix and suffix respectively
- Designing genes (aroY and tphA2 respectivley) according to the biobrick standard for gene synthesis. Gene synthesis was performed by [http://de-de.invitrogen.com/site/de/de/home/Products-and-Services/Applications/Cloning/gene-synthesis.html?s_kwcid=TC|17953|geneart||S|b|12191353721 GeneArt®]
week 10 (16.-20.07.12)
tphA1
- PCR on mutated tphA1
- Annealing temperature: 59 °C
- Primer: tphA1-Suffix_R and tphA1-l-Prefix
- Both PCR products were purified via gel extraction
- Concentrations measured by Nanodrop
PCR product Concentration [ng/µl] Mutated tphA1-prefix/suffix 62.0
- restriction of mutated tphA1-prefix/suffix with EcoRI and PstI
- Ligation of mutated tphA1-prefix/suffix (cut with EcoRI and PstI) and pSB1C3 (cut with EcoRI and PstI)
- Transformation of ligation mix
- colony-PCR for verification of the transformation
- The PCR was negative
tphA3
- PCR on tphA3 isolated from C. testosteroni
- Annealing temperature: 59 °C
- Primer: tphA3-Prefix_F and tphA3-Suffix_R
- Both PCR products were purified via gel extraction
- Concentrations measured by Nanodrop
PCR product Concentration [ng/µl] tphA3-prefix/suffix 30.5
- restriction of mutated tphA3-prefix/suffix with EcoRI and PstI
- Ligation of mutated tphA3-prefix/suffix (cut with EcoRI and PstI) and pSB1C3 (cut with EcoRI and PstI)
- Transformation of ligation mix
- colony-PCR for verification of the transformation
- The PCR was positive
- Inoculation of 10 mL of LB-medium-chloramphenicol with colony 1 and incubation
- Miniprep of the culture and a glycerine stock was made
- Concentrations measured by Nanodrop
Miniprep Concentration [ng/µl] pSB1C3-tphA3-prefix/suffix 79.6
- restriction of pSB1C3-tphA3-prefix/suffix with EcoRI and PstI
- Preparation for sequencing
- Sequence was confirmed
tphB
- PCR on tphB isolated from C. testosteroni
- Annealing temperature: 59 °C
- Primer: tphB-Prefix and tphB-Suffix_R
- Both PCR products were purified via gel extraction
- Concentrations measured by Nanodrop
PCR product Concentration [ng/µl] tphB_prefix/suffix 20.3
- restriction of mutated tphB-prefix/suffix with EcoRI and PstI
- Ligation of mutated tphB-prefix/suffix (cut with EcoRI and PstI) and pSB1C3 (cut with EcoRI and PstI)
- Transformation of ligation mix
- colony-PCR for verification of the transformation
- The PCR was negative
week 11 (23.-27.07.12)
tphB
- PCR on tphB isolated from C. testosteroni
- Annealing temperature: 59 °C
- Primer: tphB-Prefix and tphB-Suffix_R
- Both PCR products were purified via gel extraction
- Concentrations measured by Nanodrop
PCR product Concentration [ng/µl] tphB_prefix/suffix 52.5
- restriction of mutated tphB-prefix/suffix with EcoRI and PstI
- Ligation of mutated tphB-prefix/suffix (cut with EcoRI and PstI) and pSB1C3 (cut with EcoRI and PstI)
- Transformation of ligation mix
- colony-PCR for verification of the transformation
- The PCR was positive
- Inoculation of 10 mL of LB-medium-chloramphenicol with colony 1 and incubation
- Miniprep of the culture and a glycerine stock was made
- Concentrations measured by Nanodrop
Miniprep Concentration [ng/µl] pSB1C3-tphB-prefix/suffix 35.8
- restriction of pSB1C3-tphB-prefix/suffix with EcoRI and PstI
- Preparation for sequencing
- Sequence was confirmed
week 12 (30.07.-03.08.12)
tphA1
- PCR on mutated tphA1
- Annealing temperature: 59 °C
- Primer: tphA1-Suffix_R and tphA1-l-Prefix
- Both PCR products were purified via gel extraction
- Concentrations measured by Nanodrop
PCR product Concentration [ng/µl] Mutated tphA1-prefix/suffix 34.2
- restriction of mutated tphA1-prefix/suffix with EcoRI and PstI
- Ligation of mutated tphA1-prefix/suffix (cut with EcoRI and PstI) and pSB1C3 (cut with EcoRI and PstI)
- Transformation of ligation mix
- colony-PCR for verification of the transformation
- The PCR was positive
- Inoculation of 10 mL of LB-medium-chloramphenicol with colony 1 and incubation
- Miniprep of the culture and a glycerine stock was made
- Concentrations measured by Nanodrop
Miniprep Concentration [ng/µl] pSB1C3-tphA1 60.5
- restriction of pSB1C3-tphA1-prefix/suffix with EcoRI and PstI
- Preparation for sequencing
- Sequence was confirmed
week 13 (06.-10.08.12)
tphA2
- Reconstitution of the tphA2 gene synthesis
- Transformation of the tphA2 gene synthesis
- Inoculation of 10 mL LB-medium-kanamycin with one colony of the transformation and incubation
- Miniprep of the culture
Miniprep Concentration [ng/µl] tphA2 gene synthesis 112.6
- Restriktion digest of the tphA2 gene synthesis with EcoRI and PstI
- Ligation of the tphA2 gene synthesis and pSB1C3 (cut with EcoRI and PstI)
- Transformation of ligation mix
- colony-PCR for verification of the transformation
- The PCR was positive
- Inoculation of 10 mL of LB-medium-chloramphenicol with colony 1 and incubation
- Miniprep of the culture and a glycerine stock was made
- Concentrations measured by Nanodrop
Miniprep Concentration [ng/µl] pSB1C3-tphA2-prefix/suffix 111.1
- Preparation for sequencing
- Sequence was confirmed
week 14 (13.-17.08.12)
aroY
- Reconstitution of the aroY gene synthesis
- Transformation of the aroY gene synthesis
- Inoculation of 10 mL LB-medium-kanamycin with one colony of the transformation and incubation
- Miniprep of the culture
Miniprep Concentration [ng/µl] aroY gene synthesis 63.25
- Restriktion digest of the aroY gene synthesis with EcoRI and PstI
- Ligation of the aroY gene synthesis and pSB1C3 (cut with EcoRI and PstI)
- Transformation of ligation mix
- colony-PCR for verification of the transformation
- The PCR was negative
Other
- restriction digest of BBa_J23100 by EcoRI and PstI
- Purification of plasmid backbone J61002 via gel extraction
- Concentrations measured by Nanodrop
Plamid backbone Concentration [ng/µl] J61002 42.5
week 15 (20.-24.08.12)
Other
- Designing primers for over expression and operon construction
- Transformation of pPR-IBA2
- Inoculation of 10 mL of LB-medium-chloramphenicol with one colony and incubation
- Midiprep of the culture and a glycerine stock was made
- Concentrations measured by Nanodrop
Midiprep Concentration [ng/µl] pPR-IBA2 127
- restriction digest of pPR-IBA2 with EcoRI and PstI
- Purification of plasmid backbone pPR-IBA2 via gel extraction
- Concentrations measured by Nanodrop
Plamid backbone Concentration [ng/µl] pPR-IBA2 35.6
week 16 (27.-31.08.12)
Operon construction
tphA1
- PCR on pSB1C3-tphA1
- Annealing temperature: 59 °C
- Primer: RBS-tphA1 and Suffix
- Both PCR products were purified via gel extraction
- Concentrations measured by Nanodrop
PCR product Concentration [ng/µl] tphA1 with RBS 33.5
- restriction of RBS-tphA1 with EcoRI and PstI
- Ligation of RBS-tphA1 (cut with EcoRI and PstI) and J61002 (cut with EcoRI and PstI)
- Transformation of ligation mix
- colony-PCR for verification of the transformation
- The PCR was positive
- Inoculation of 10 mL of LB-medium-ampicillin with colony 4 and incubation
- Miniprep of the culture and a glycerine stock was made
- Concentrations measured by Nanodrop
Miniprep Concentration [ng/µl] J61002-RBS-tphA1 79,6
tphA2
- PCR on pSB1C3-tphA2
- Annealing temperature: 59 °C
- Primer: RBS-tphA2 and Suffix
- Both PCR products were purified via gel extraction
- Concentrations measured by Nanodrop
PCR product Concentration [ng/µl] tphA2 with RBS 46.8
- restriction of RBS-tphA2 with EcoRI and PstI
- Ligation of RBS-tphA2 (cut with EcoRI and PstI) and J61002 (cut with EcoRI and PstI)
- Transformation of ligation mix
- colony-PCR for verification of the transformation
- The PCR was positive
- Inoculation of 10 mL of LB-medium-ampicillin with colony 6 and incubation
- Miniprep of the culture and a glycerine stock was made
- Concentrations measured by Nanodrop
Miniprep Concentration [ng/µl] J61002-RBS-tphA2 80.3
tphA3
- PCR on pSB1C3-tphA3
- Annealing temperature: 59 °C
- Primer: RBS-tphA3 and Suffix
- Both PCR products were purified via gel extraction
- Concentrations measured by Nanodrop
PCR product Concentration [ng/µl] tphA3 with RBS 26.5
- restriction of RBS-tphA3 with EcoRI and PstI
- Ligation of RBS-tphA3 (cut with EcoRI and PstI) and J61002 (cut with EcoRI and PstI)
- Transformation of ligation mix
- colony-PCR for verification of the transformation
- The PCR was positive
- Inoculation of 10 mL of LB-medium-ampicillin with colony 6 and incubation
- Miniprep of the culture and a glycerine stock was made
- Concentrations measured by Nanodrop
Miniprep Concentration [ng/µl] J61002-RBS-tphA3 67.5
tphB
- PCR on pSB1C3-tphB
- Annealing temperature: 59 °C
- Primer: RBS-tphB and Suffix
- Both PCR products were purified via gel extraction
- Concentrations measured by Nanodrop
PCR product Concentration [ng/µl] tphB with RBS 49.2
- restriction of RBS-tphB with EcoRI and PstI
- Ligation of RBS-tphB (cut with EcoRI and PstI) and J61002 (cut with EcoRI and PstI)
- Transformation of ligation mix
- colony-PCR for verification of the transformation
- The PCR was positive
- Inoculation of 10 mL of LB-medium-ampicillin with colony 1 and incubation
- Miniprep of the culture and a glycerine stock was made
- Concentrations measured by Nanodrop
Miniprep Concentration [ng/µl] J61002-RBS-tphB 65.8
aroY
- PCR on pSB1C3-aroY
- Annealing temperature: 59 °C
- Primer: RBS-aroY and Suffix
- Both PCR products were purified via gel extraction
- Concentrations measured by Nanodrop
PCR product Concentration [ng/µl] aroY with RBS 55.2
- restriction of RBS-aroY with EcoRI and PstI
- Ligation of RBS-aroY (cut with EcoRI and PstI) and J61002 (cut with EcoRI and PstI)
- Transformation of ligation mix
- colony-PCR for verification of the transformation
- The PCR was positive
- Inoculation of 10 mL of LB-medium-ampicillin with colony 2 and incubation
- Miniprep of the culture and a glycerine stock was made
- Concentrations measured by Nanodrop
Miniprep Concentration [ng/µl] J61002-RBS-aroY 77.2
Over expression
tphA1
- PCR on pSB1C3-tphA1
- Annealing temperature: 59 °C
- Primer: EcoRIGFxa-tphA1 and Suffix
- Both PCR products were purified via gel extraction
- Concentrations measured by Nanodrop
PCR product Concentration [ng/µl] tphA1_over-ex 116.2
- restriction of tphA1_over-ex with EcoRI and PstI
- Ligation of tphA1_over-ex (cut with EcoRI and PstI) and pPR-IBA2 (cut with EcoRI and PstI)
- Transformation of ligation mix
- colony-PCR for verification of the transformation
- The PCR was positive
- Inoculation of 10 mL of LB-medium-ampicillin with colony XXX and incubation
- Miniprep of the culture and a glycerine stock was made
- Concentrations measured by Nanodrop
Miniprep Concentration [ng/µl] pPR-IBA2-tphA1_over-ex 98.5
tphA2
- PCR on pSB1C3-tphA2
- Annealing temperature: 59 °C
- Primer: EcoRIGFxa-tphA2 and Suffix
- Both PCR products were purified via gel extraction
- Concentrations measured by Nanodrop
PCR product Concentration [ng/µl] tphA2_over-ex 63.9
- restriction of tphA2_over-ex with EcoRI and PstI
- Ligation of tphA2_over-ex (cut with EcoRI and PstI) and pPR-IBA2 (cut with EcoRI and PstI)
- Transformation of ligation mix
- colony-PCR for verification of the transformation
- The PCR was positive
- Inoculation of 10 mL of LB-medium-ampicillin with colony XXX and incubation
- Miniprep of the culture and a glycerine stock was made
- Concentrations measured by Nanodrop
Miniprep Concentration [ng/µl] pPR-IBA2-tphA2_over-ex 85.2
tphA3
- PCR on pSB1C3-tphA3
- Annealing temperature: 59 °C
- Primer: EcoRIGFxa-tphA3 and Suffix
- Both PCR products were purified via gel extraction
- Concentrations measured by Nanodrop
PCR product Concentration [ng/µl] tphA3_over-ex 90.4
- restriction of tphA3_over-ex with EcoRI and PstI
- Ligation of tphA3_over-ex (cut with EcoRI and PstI) and pPR-IBA2 (cut with EcoRI and PstI)
- Transformation of ligation mix
- colony-PCR for verification of the transformation
- The PCR was positive
- Inoculation of 10 mL of LB-medium-ampicillin with colony XXX and incubation
- Miniprep of the culture and a glycerine stock was made
- Concentrations measured by Nanodrop
Miniprep Concentration [ng/µl] pPR-IBA2-tphA3_over-ex 85.9
tphB
- PCR on pSB1C3-tphB
- Annealing temperature: 59 °C
- Primer: EcoRIGFxa-tphB and Suffix
- Both PCR products were purified via gel extraction
- Concentrations measured by Nanodrop
PCR product Concentration [ng/µl] tphB_over-ex 87.5
- restriction of tphB_over-ex with EcoRI and PstI
- Ligation of tphB_over-ex (cut with EcoRI and PstI) and pPR-IBA2 (cut with EcoRI and PstI)
- Transformation of ligation mix
- colony-PCR for verification of the transformation
- The PCR was positive
- Inoculation of 10 mL of LB-medium-ampicillin with colony XXX and incubation
- Miniprep of the culture and a glycerine stock was made
- Concentrations measured by Nanodrop
Miniprep Concentration [ng/µl] pPR-IBA2-tphB_over-ex 85.2
aroY
- PCR on pSB1C3-aroY
- Annealing temperature: 59 °C
- Primer: EcoRIGFxa-aroY and Suffix
- Both PCR products were purified via gel extraction
- Concentrations measured by Nanodrop
PCR product Concentration [ng/µl] aroY_over-ex 105.1
- restriction of aroY_over-ex with EcoRI and PstI
- Ligation of aroY_over-ex (cut with EcoRI and PstI) and pPR-IBA2 (cut with EcoRI and PstI)
- Transformation of ligation mix
- colony-PCR for verification of the transformation
- The PCR was positive
- Inoculation of 10 mL of LB-medium-ampicillin with colony XXX and incubation
- Miniprep of the culture and a glycerine stock was made
- Concentrations measured by Nanodrop
Miniprep Concentration [ng/µl] pPR-IBA2-aroY_over-ex 92.1
week 17 (03.-07.09.12)
Operon construction
RBS-tphA1-RBS-tphA2
- restriction digest of J61002-RBS-tphA1 by EcoRI and SpeI
- Purification of insert RBS-tphA1 RBS-tphA1 (cut with EcoRI and SpeI) via gel extraction
- Concentrations measured by Nanodrop
Insert Concentration [ng/µl] RBS-tphA1 (cut with EcoRI and SpeI) 50.2
- restriction of J61002-RBS-tphA2 EcoRI and XbaI
- Dephosphorylation of the plasmid backbone J61002-RBS-tphA2 (cut with EcoRI and XbaI)
- Ligation of the plasmid backbone J61002-RBS-tphA2 (cut with EcoRI and XbaI)and RBS-tphA1 (cut with EcoRI and SpeI)
- Transformation of the ligation mix
- colony-PCR of the transformation for verification
- The PCR was positive
- Inoculation of 10 mL of LB-medium-ampicillin with colony 4 and incubation
- Miniprep of the culture and a glycerine stock was made
- Concentrations measured by Nanodrop
Miniprep Concentration [ng/µl] J61002-RBS-tphA1-RBS-tphA2 112.5
RBS-tphA3-RBS-tphB
- restriction digest of J61002-RBS-tphA3 by EcoRI and SpeI
- Purification of insert RBS-tphA3 (cut with EcoRI and SpeI) via gel extraction
- Concentrations measured by Nanodrop
Insert Concentration [ng/µl] RBS-tphA3 (cut with EcoRI and SpeI) 178.9
- restriction of J61002-RBS-tphB EcoRI and XbaI
- Dephosphorylation of the plasmid backbone J61002-RBS-tphB (cut with EcoRI and XbaI)
- Ligation of the plasmid backbone J61002-RBS-tphB (cut with EcoRI and XbaI)and RBS-tphA3 (cut with EcoRI and SpeI)
- Transformation of the ligation mix
- colony-PCR of the transformation for verification
- The PCR was positive
- Inoculation of 10 mL of LB-medium-ampicillin with colony 1 and incubation
- Miniprep of the culture and a glycerine stock was made
- Concentrations measured by Nanodrop
Miniprep Concentration [ng/µl] J61002-RBS-tphA3-RBS-tphB 225.5
RBS-tphA1-RBS-tphA2-RBS-tphA3-RBS-tphB
- restriction of J61002-RBS-tphA1-RBS-tphA2 by EcoRI and SpeI
- Purification of insert RBS-tphA1-RBS-tphA2 (cut with EcoRI and SpeI) via gel extraction
- Concentrations measured by Nanodrop
Insert Concentration [ng/µl] RBS-tphA1-RBS-tphA2 (cut with EcoRI and SpeI) 129.5
- restriction of J61002-RBS-tphA3-RBS-tphB EcoRI and XbaI
- Dephosphorylation of the plasmid backbone J61002-RBS-tphA3-RBS-tphB (cut with EcoRI and XbaI)
- Ligation of the plasmid backbone J61002-RBS-tphA3-RBS-tphB EcoRI (cut with EcoRI and XbaI)and RBS-tphA1-RBS-tphA2 (cut with EcoRI and SpeI)
- Transformation of the ligation mix
- colony-PCR of the transformation for verification
- The PCR was positive
- Inoculation of 10 mL of LB-medium-ampicillin with colony 2 and incubation
- Miniprep of the culture and a glycerine stock was made
- Concentrations measured by Nanodrop
Miniprep Concentration [ng/µl] J61002-RBS-tphA1-RBS-tphA2-RBS-tphA3-RBS-tphB 312.2
Overexpression
tphA2
- Inoculate 10 mL of LB-medium-ampicillin with pPR-IBA2-tphA1_over-ex and incubate
- Over expression according to standard protocol
tphB
- Inoculate 10 mL of LB-medium-ampicillin with pPR-IBA2-tphA1_over-ex and incubate
- Over expression according to standard protocol
aroY
- Inoculate 10 mL of LB-medium-ampicillin with pPR-IBA2-tphA1_over-ex and incubate
- Over expression according to standard protocol
tphA1
- Inoculate 10 mL of LB-medium-ampicillin with pPR-IBA2-tphA1_over-ex and incubate
- Over expression according to standard protocol
tphA3
- Inoculate 10 mL of LB-medium-ampicillin with pPR-IBA2-tphA1_over-ex and incubate
- Over expression according to standard protocol
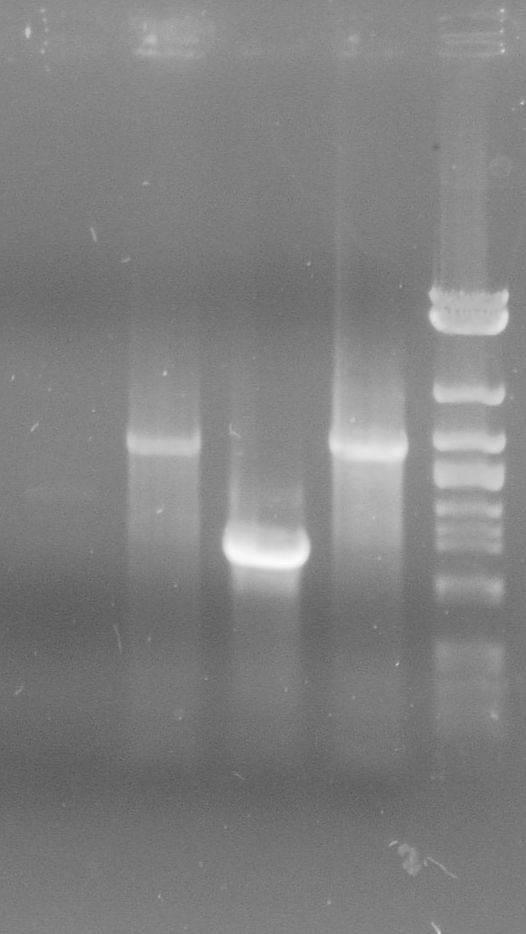
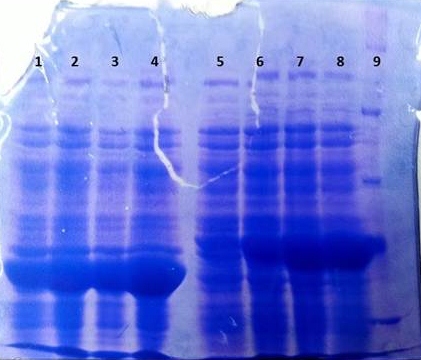
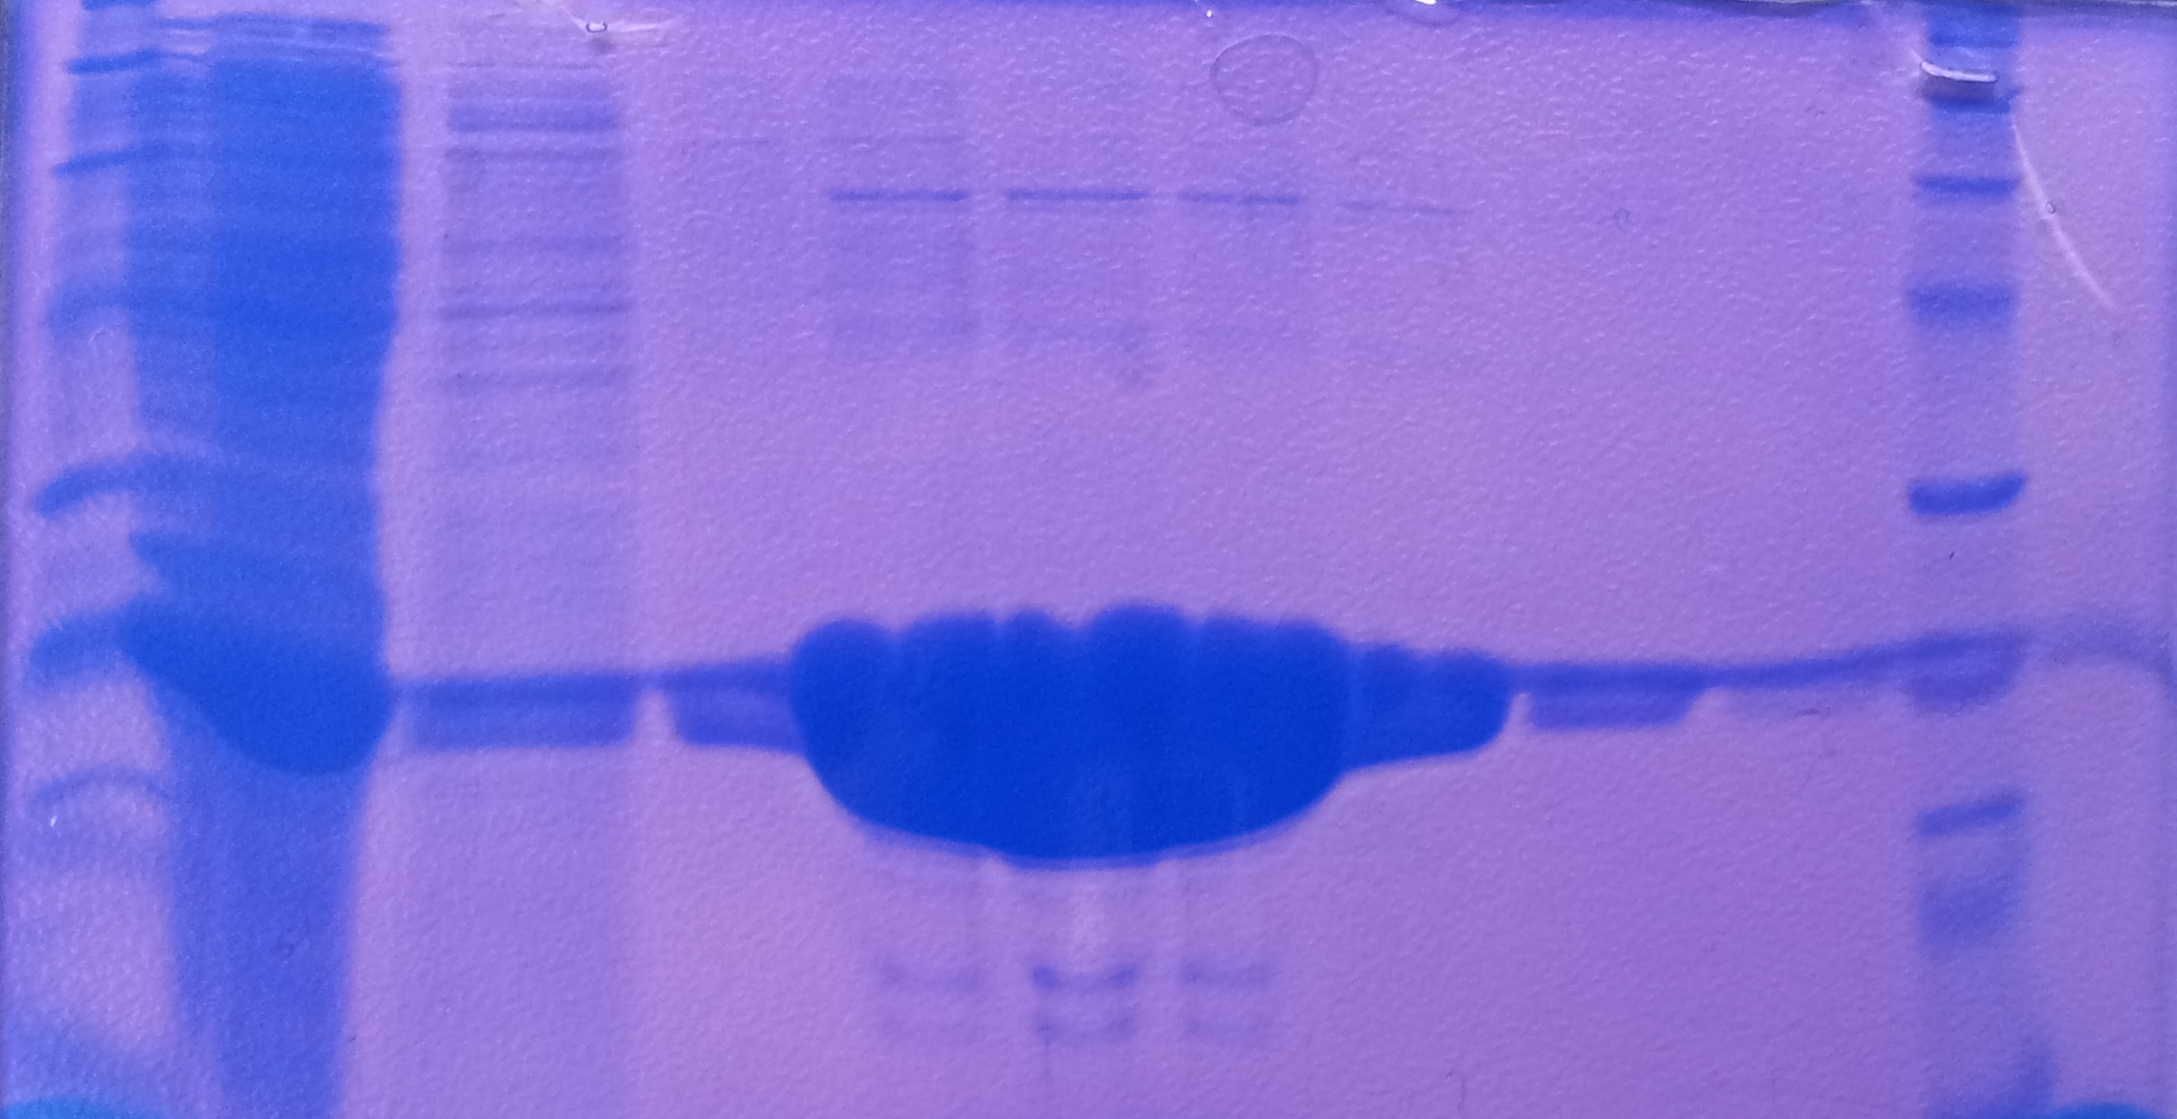
SDS-PAGE of tphB overexpression and tphA2 overexpression respectively
- SDS-Page according to standard protocol
| Band | Sample | Time [h] |
|---|---|---|
| 1 | tphB | 0 |
| 2 | tphB | 1 |
| 3 | tphB | 2 |
| 4 | tphB | 3 |
| 5 | tphA2 | 0 |
| 6 | tphA2 | 1 |
| 7 | tphA2 | 2 |
| 8 | tphA2 | 3 |
| 9 | [http://www.applichem.com/fileadmin/produktinfo/a4402_de.pdf Protein marker] | - |
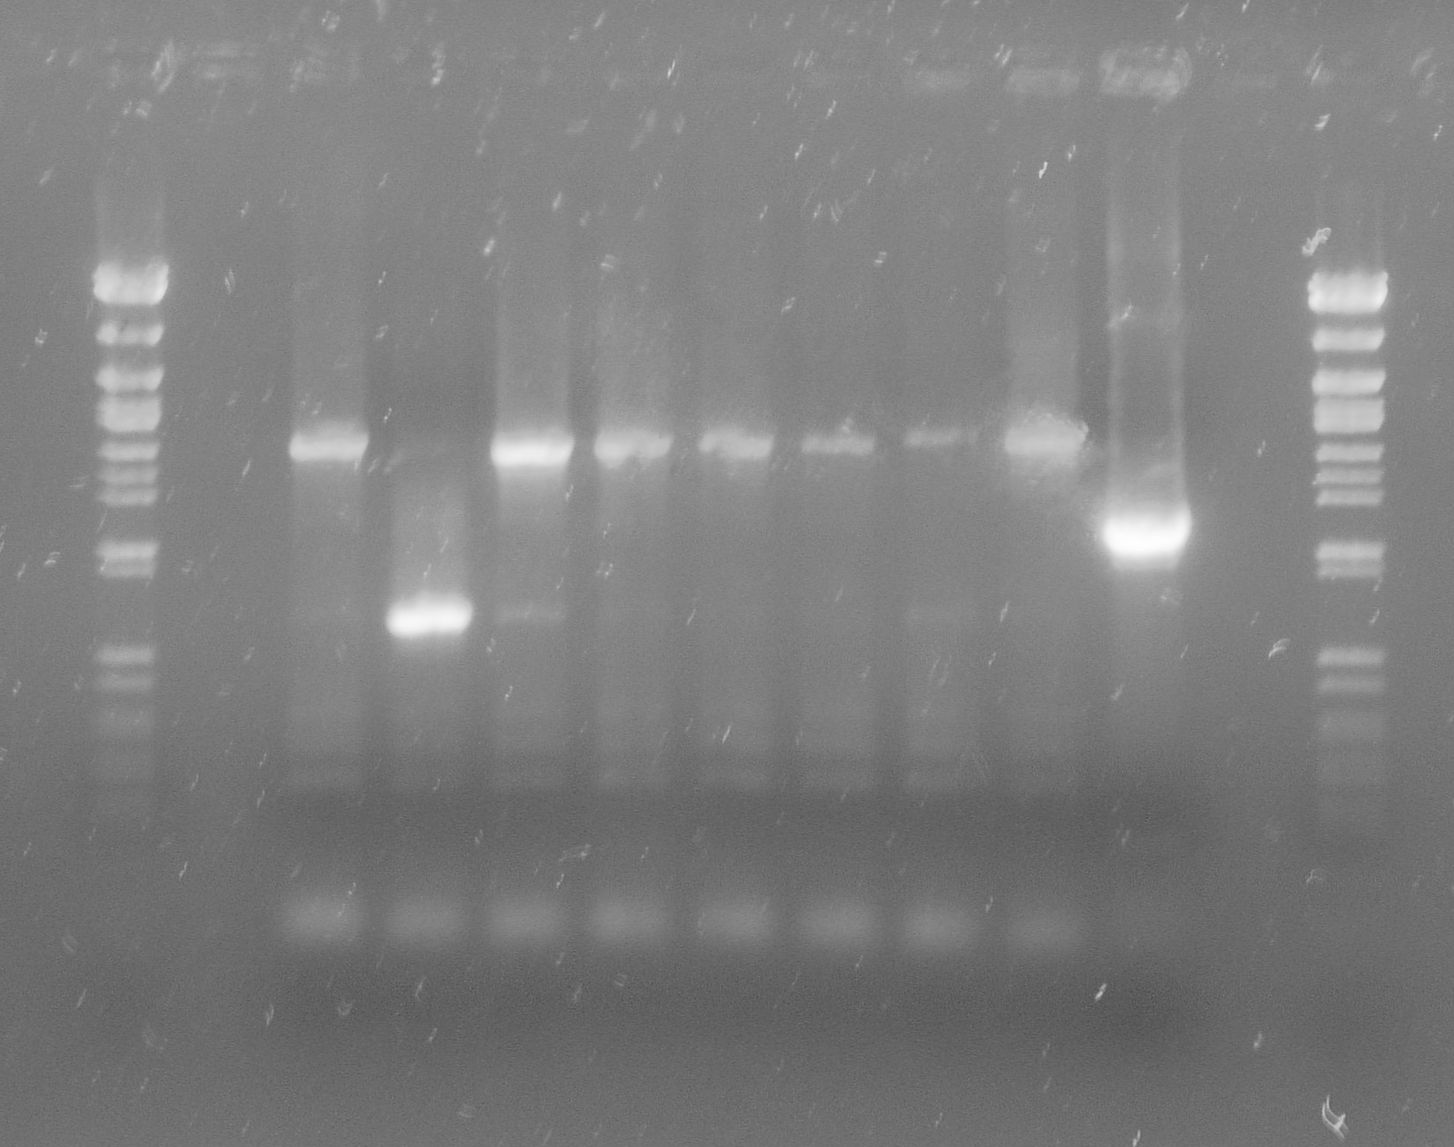
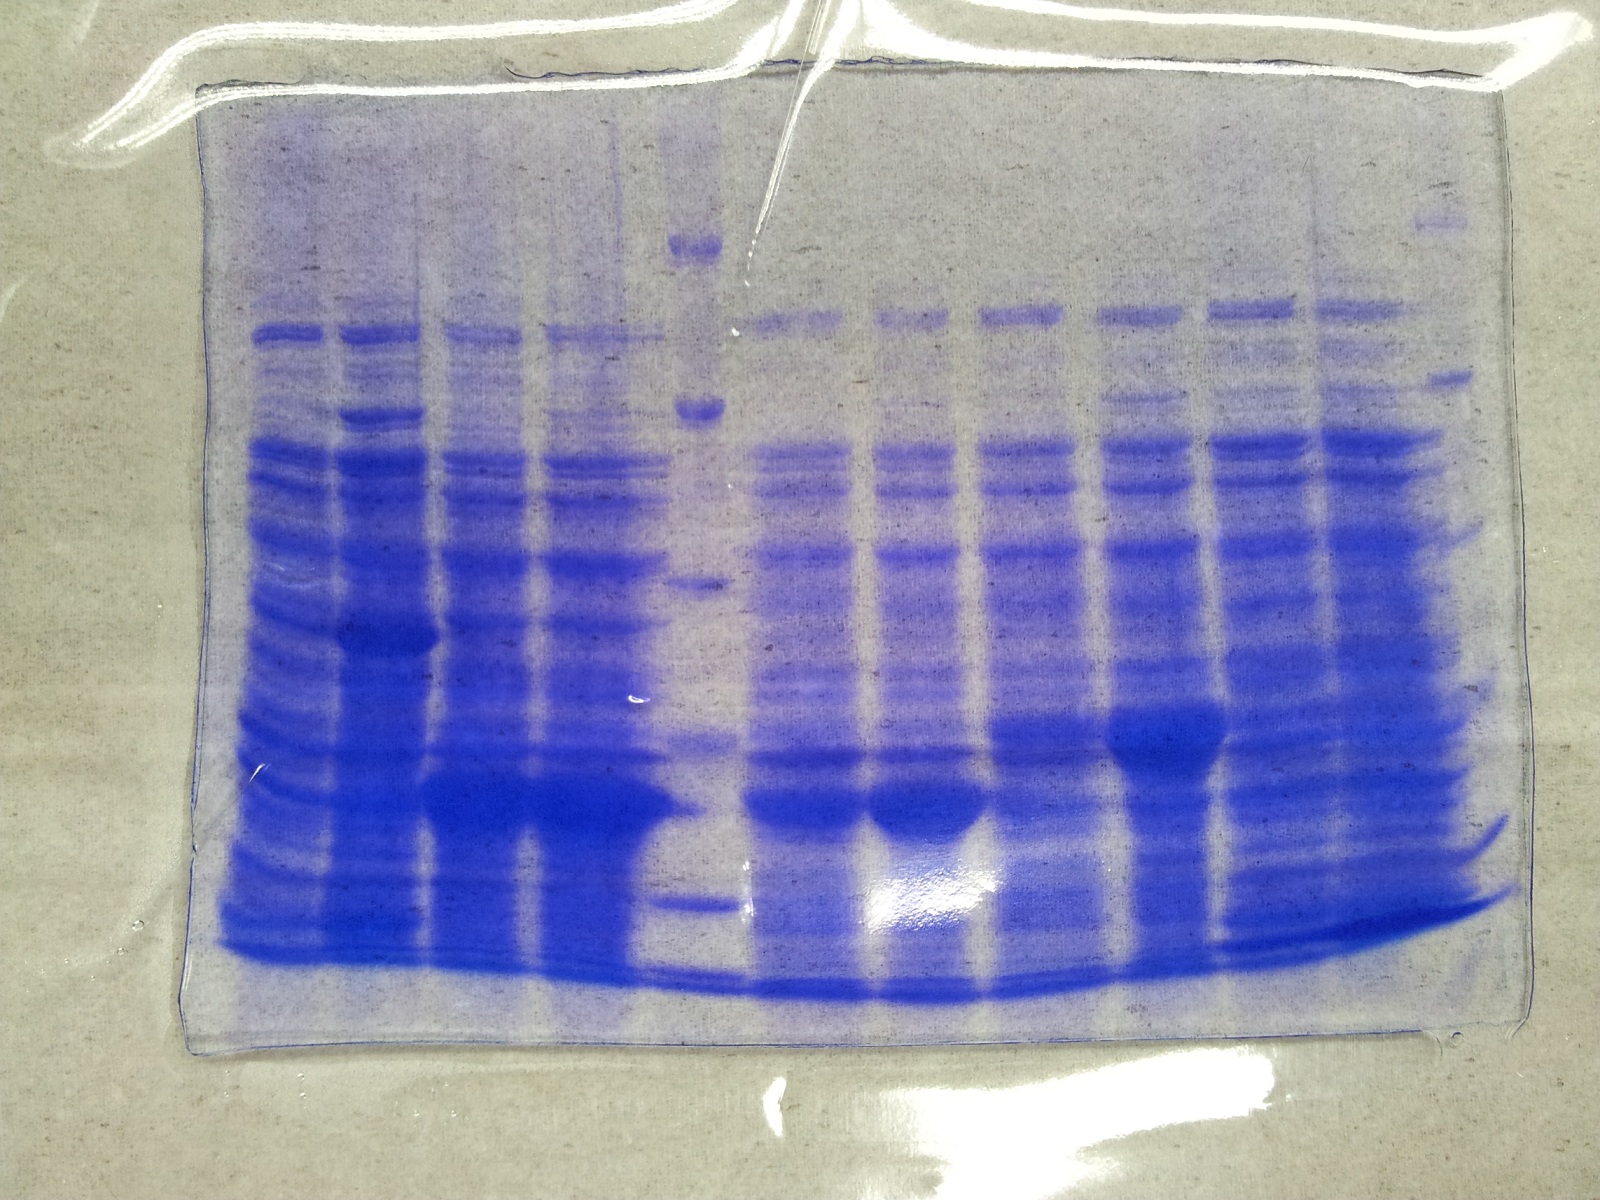
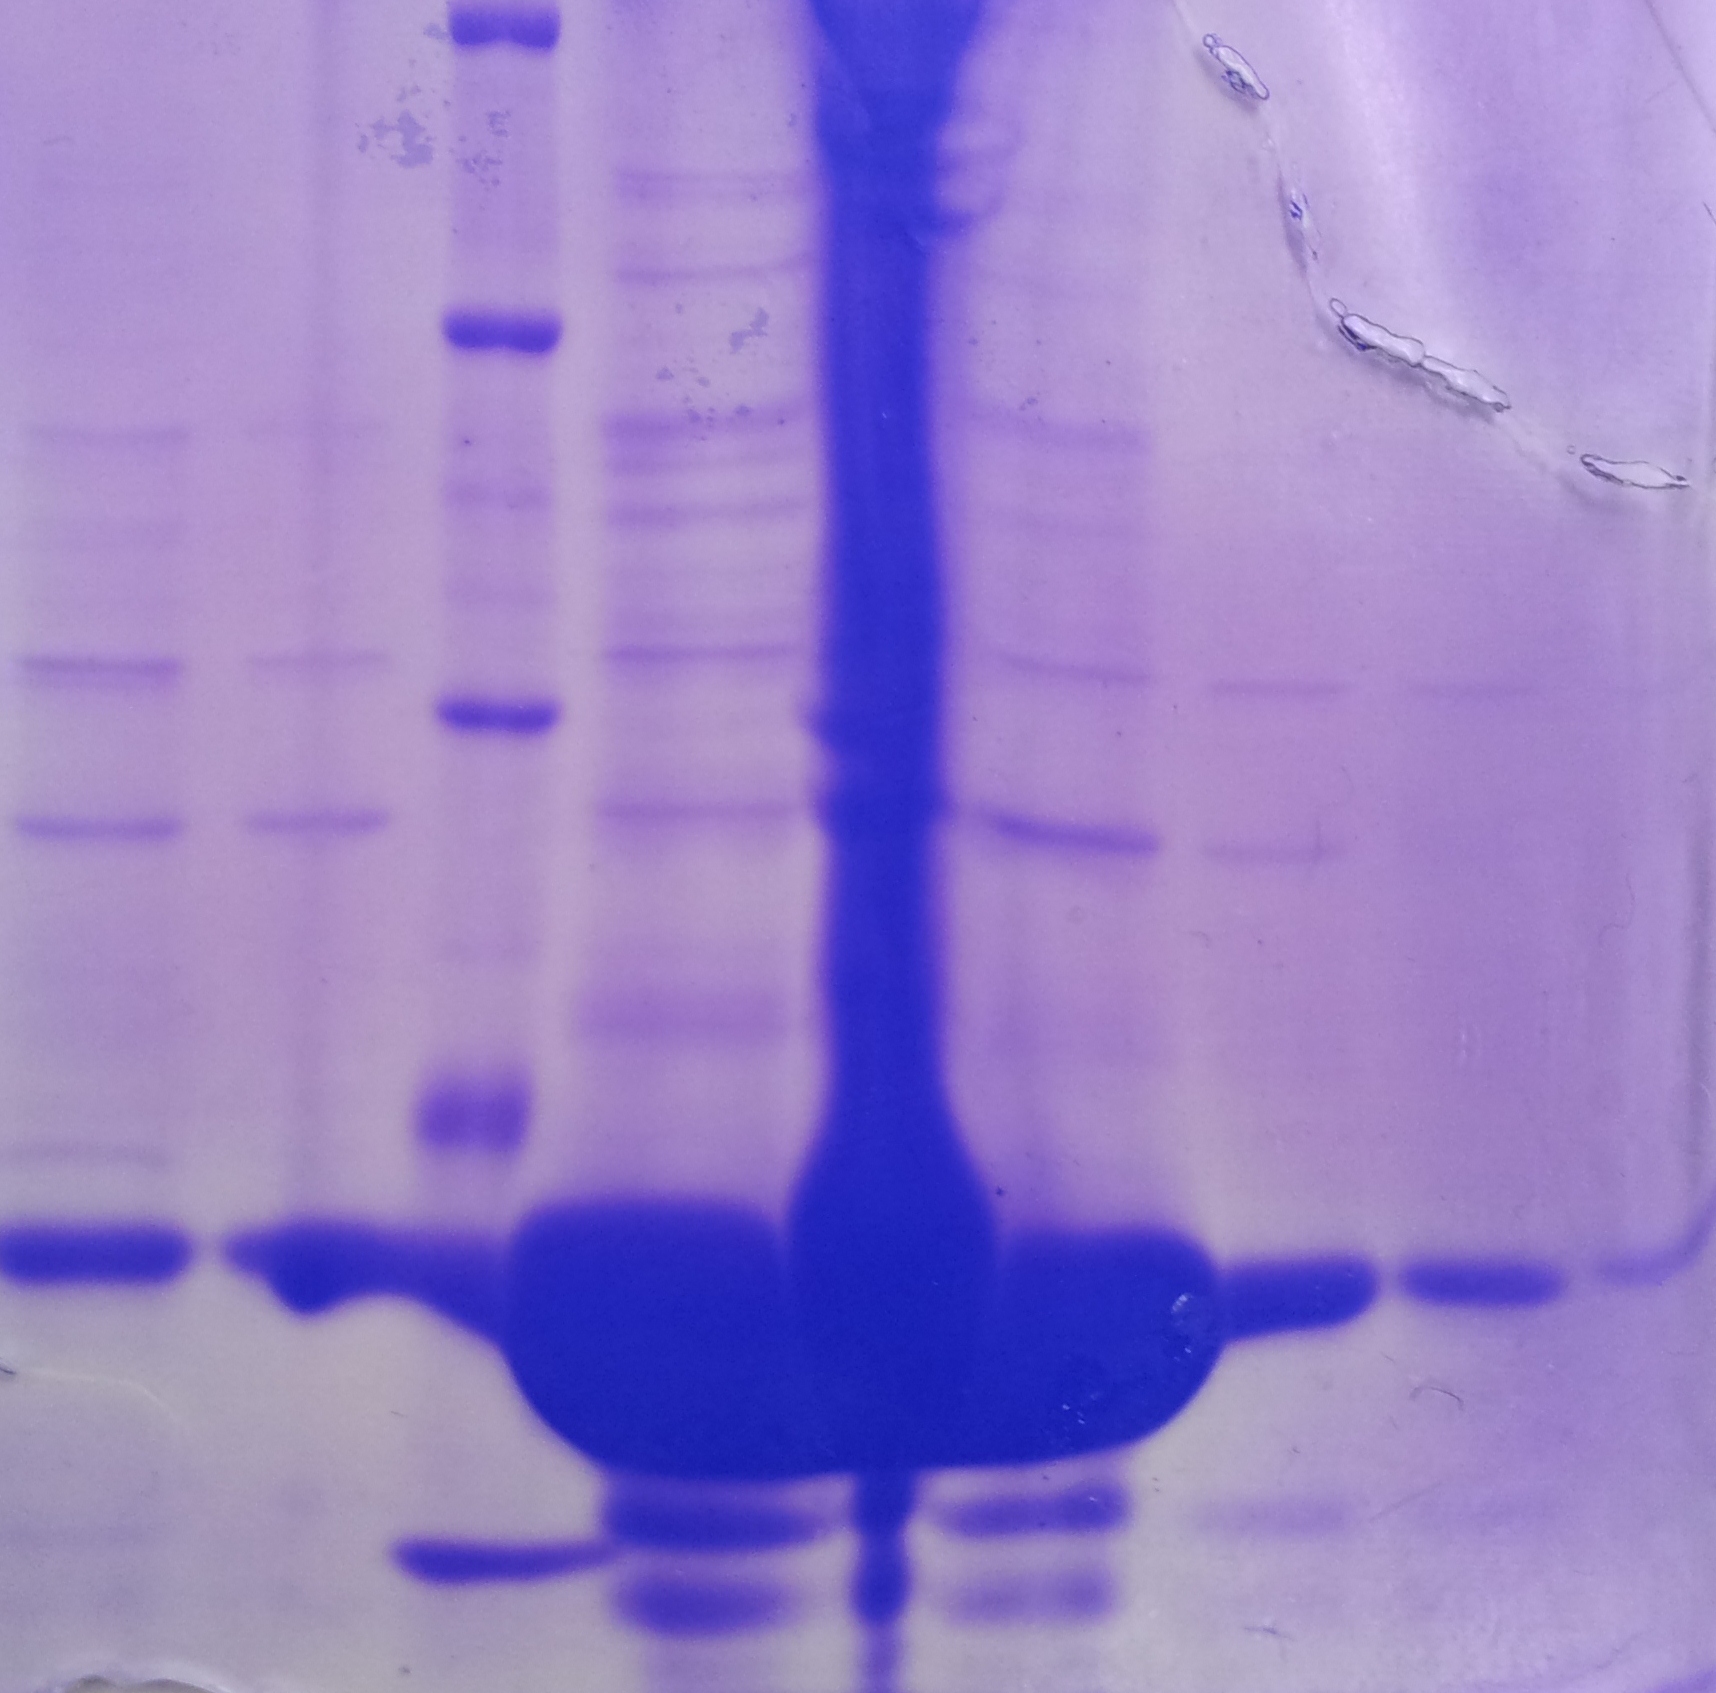
SDS-PAGE of overexpression from all five genes
- SDS-Page according to standard protocol
| Band | Sample | Time [h] |
|---|---|---|
| 1 | aroY | 0 |
| 2 | aroY | 3 |
| 3 | tphB | 0 |
| 4 | tphB | 3 |
| 5 | [http://www.applichem.com/fileadmin/produktinfo/a4402_de.pdf Protein marker] | - |
| 6 | tphA1 | 0 |
| 7 | tphA1 | 3 |
| 8 | tphA2 | 0 |
| 9 | tphA2 | 3 |
| 10 | tphA3 | 0 |
| 11 | tphA3 | 3 |
| 12 | [http://www.applichem.com/fileadmin/produktinfo/a4402_de.pdf Protein marker] | - |
week 18 (10.-17.09.12)
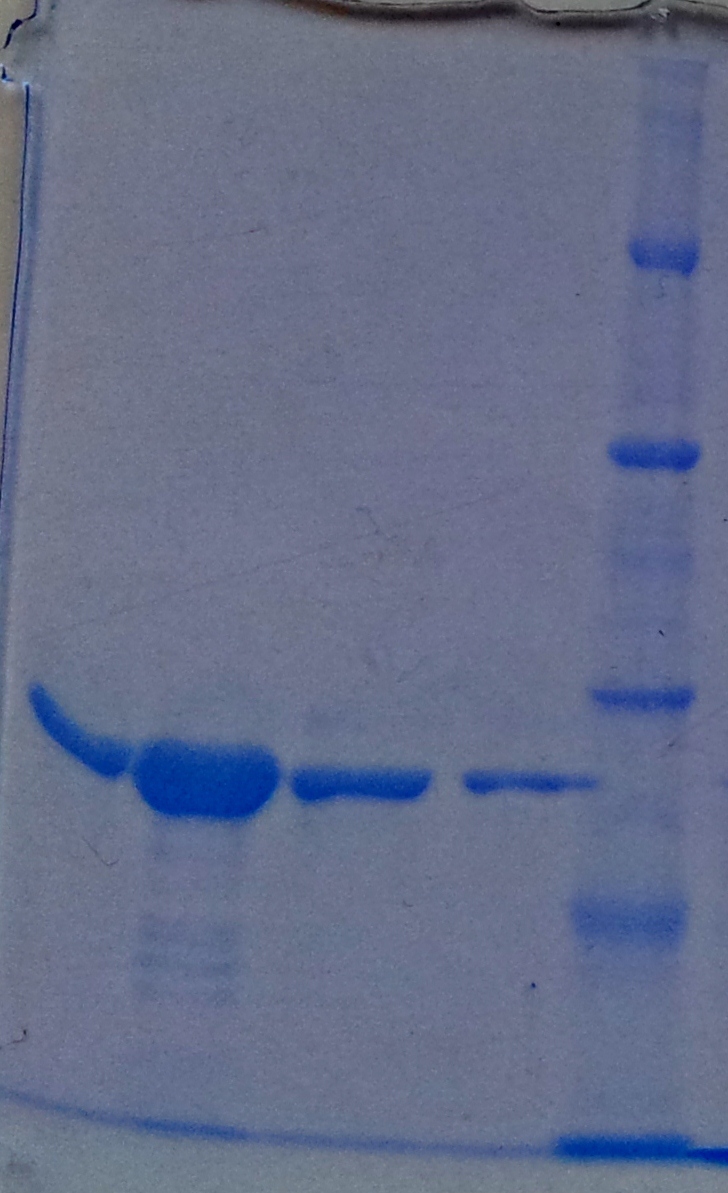
Purification of aroY
- Protein purification according to standard strep-tag purification protocol
| Band | Sample | Fraction |
|---|---|---|
| 1 | aroY | 1 |
| 2 | aroY | 2 |
| 3 | aroY | 3 and 4 together |
| 4 | aroY | 5 and 6 together |
| 5 | [http://www.applichem.com/fileadmin/produktinfo/a4402_de.pdf Protein marker] | - |
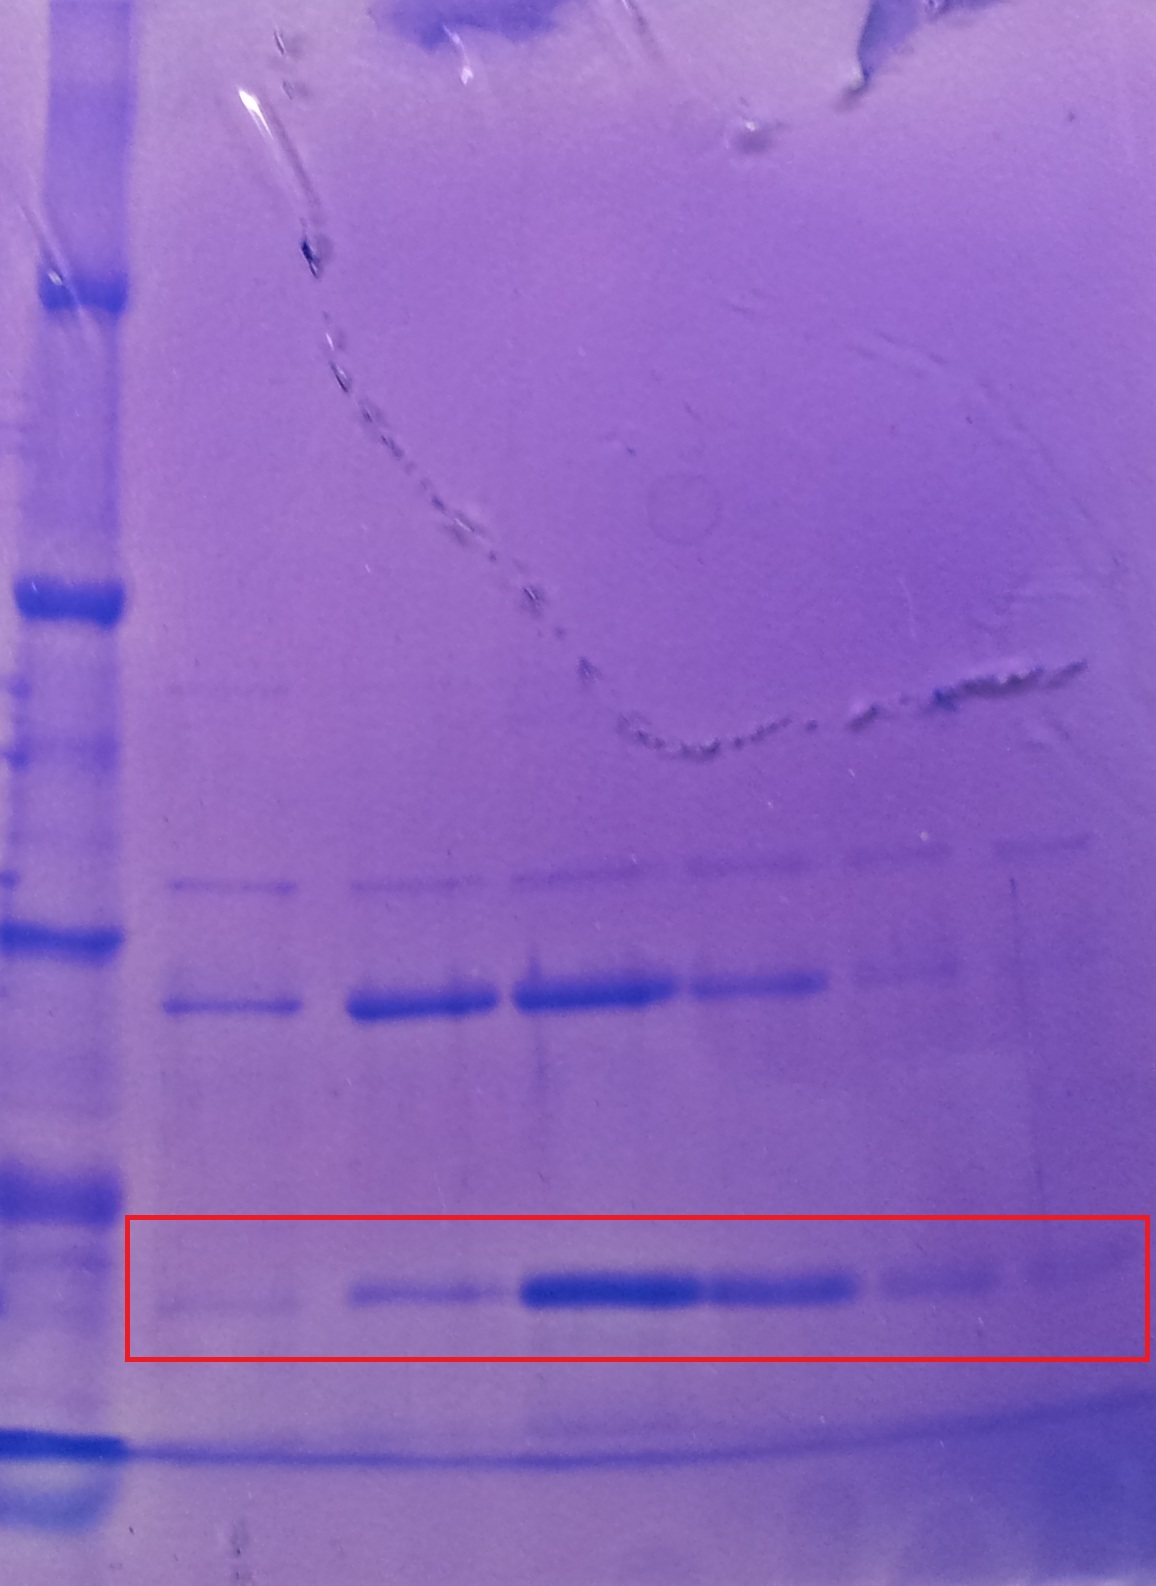
Purification of TphA3
- Protein purification according to standard strep-tag purification protocol
| Band | Sample | Fraction |
|---|---|---|
| 1 | [http://www.applichem.com/fileadmin/produktinfo/a4402_de.pdf Protein marker] | |
| 2 | TphA3 | Cell suspension |
| 3 | TphA3 | Cytoplasm |
| 4 | TphA3 | 1 |
| 5 | TphA3 | 2 |
| 6 | TphA3 | 3 |
| 7 | TphA3 | 4 |
| 8 | TphA3 | 5 |
| 9 | TphA3 | 6 |
| 10 | TphA3 | 7 |
| 11 | [http://www.applichem.com/fileadmin/produktinfo/a4402_de.pdf Protein marker] | - |
Purification of TphA1
- Protein purification according to standard strep-tag purification protocol
| Band | Sample | Fraction |
|---|---|---|
| 1 | [http://www.applichem.com/fileadmin/produktinfo/a4402_de.pdf Protein marker] | |
| 2 | TphA1 | 1 |
| 3 | TphA1 | 2 |
| 4 | TphA1 | 3 |
| 5 | TphA1 | 4 |
| 6 | TphA1 | 5 |
| 7 | TphA1 | 6 |
- Note: The other bands over TphA1 represent a contamination by aroY
Purification of TphB
- Protein purification according to standard strep-tag purification protocol
| Band | Sample | Fraction |
|---|---|---|
| 1 | TphA1 | 1 |
| 2 | TphA1 | 2 |
| 3 | [http://www.applichem.com/fileadmin/produktinfo/a4402_de.pdf Protein marker] | |
| 4 | TphA1 | 3 |
| 5 | TphA1 | 4 |
| 6 | TphA1 | 5 |
| 7 | TphA1 | 6 |
| 7 | TphA1 | 7 |
Purification of TphA2
- Protein purification according to standard strep-tag purification protocol
- Note: We don´t perform an SDS-Page from the purification.
week 19 (17.-21.09.12)
Operon Construction
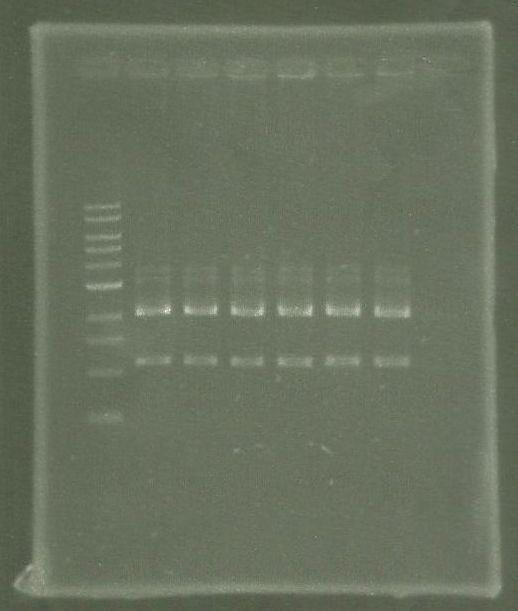
- After several failed cloning attempts a test restriction digest was performed
- J61002-RBS-tphA1-RBS-tphA2-RBS-tphA3-RBS-tphB showed unexpected bands although only one was expected after cutting with SpeI and PstI
- BBa_K316003 showed two bands when cut with PstI and SpeI and PstI respectively where only one was expected
- This lead us to the assumption that our PstI enzyme was contaminated with EcoRI (note the slightly differences between BBa_K316003 cut with SpeI and PstI and BBa_K316003 cut with XbaI and PstI)
- Nevertheless also J61002-RBS-tphA1-RBS-tphA2-RBS-tphA3-RBS-tphB seemed to possess mutation(s) introducing new recognition sites for SpeI and/or PstI
- As we lacked time to confirm our assumptions by sequencing we decided to cancel further operon construction
week 20 (24.-26.09.12)
Enzyme assys
- TpH enzymes
- For protocol see here
- We mesure no activity
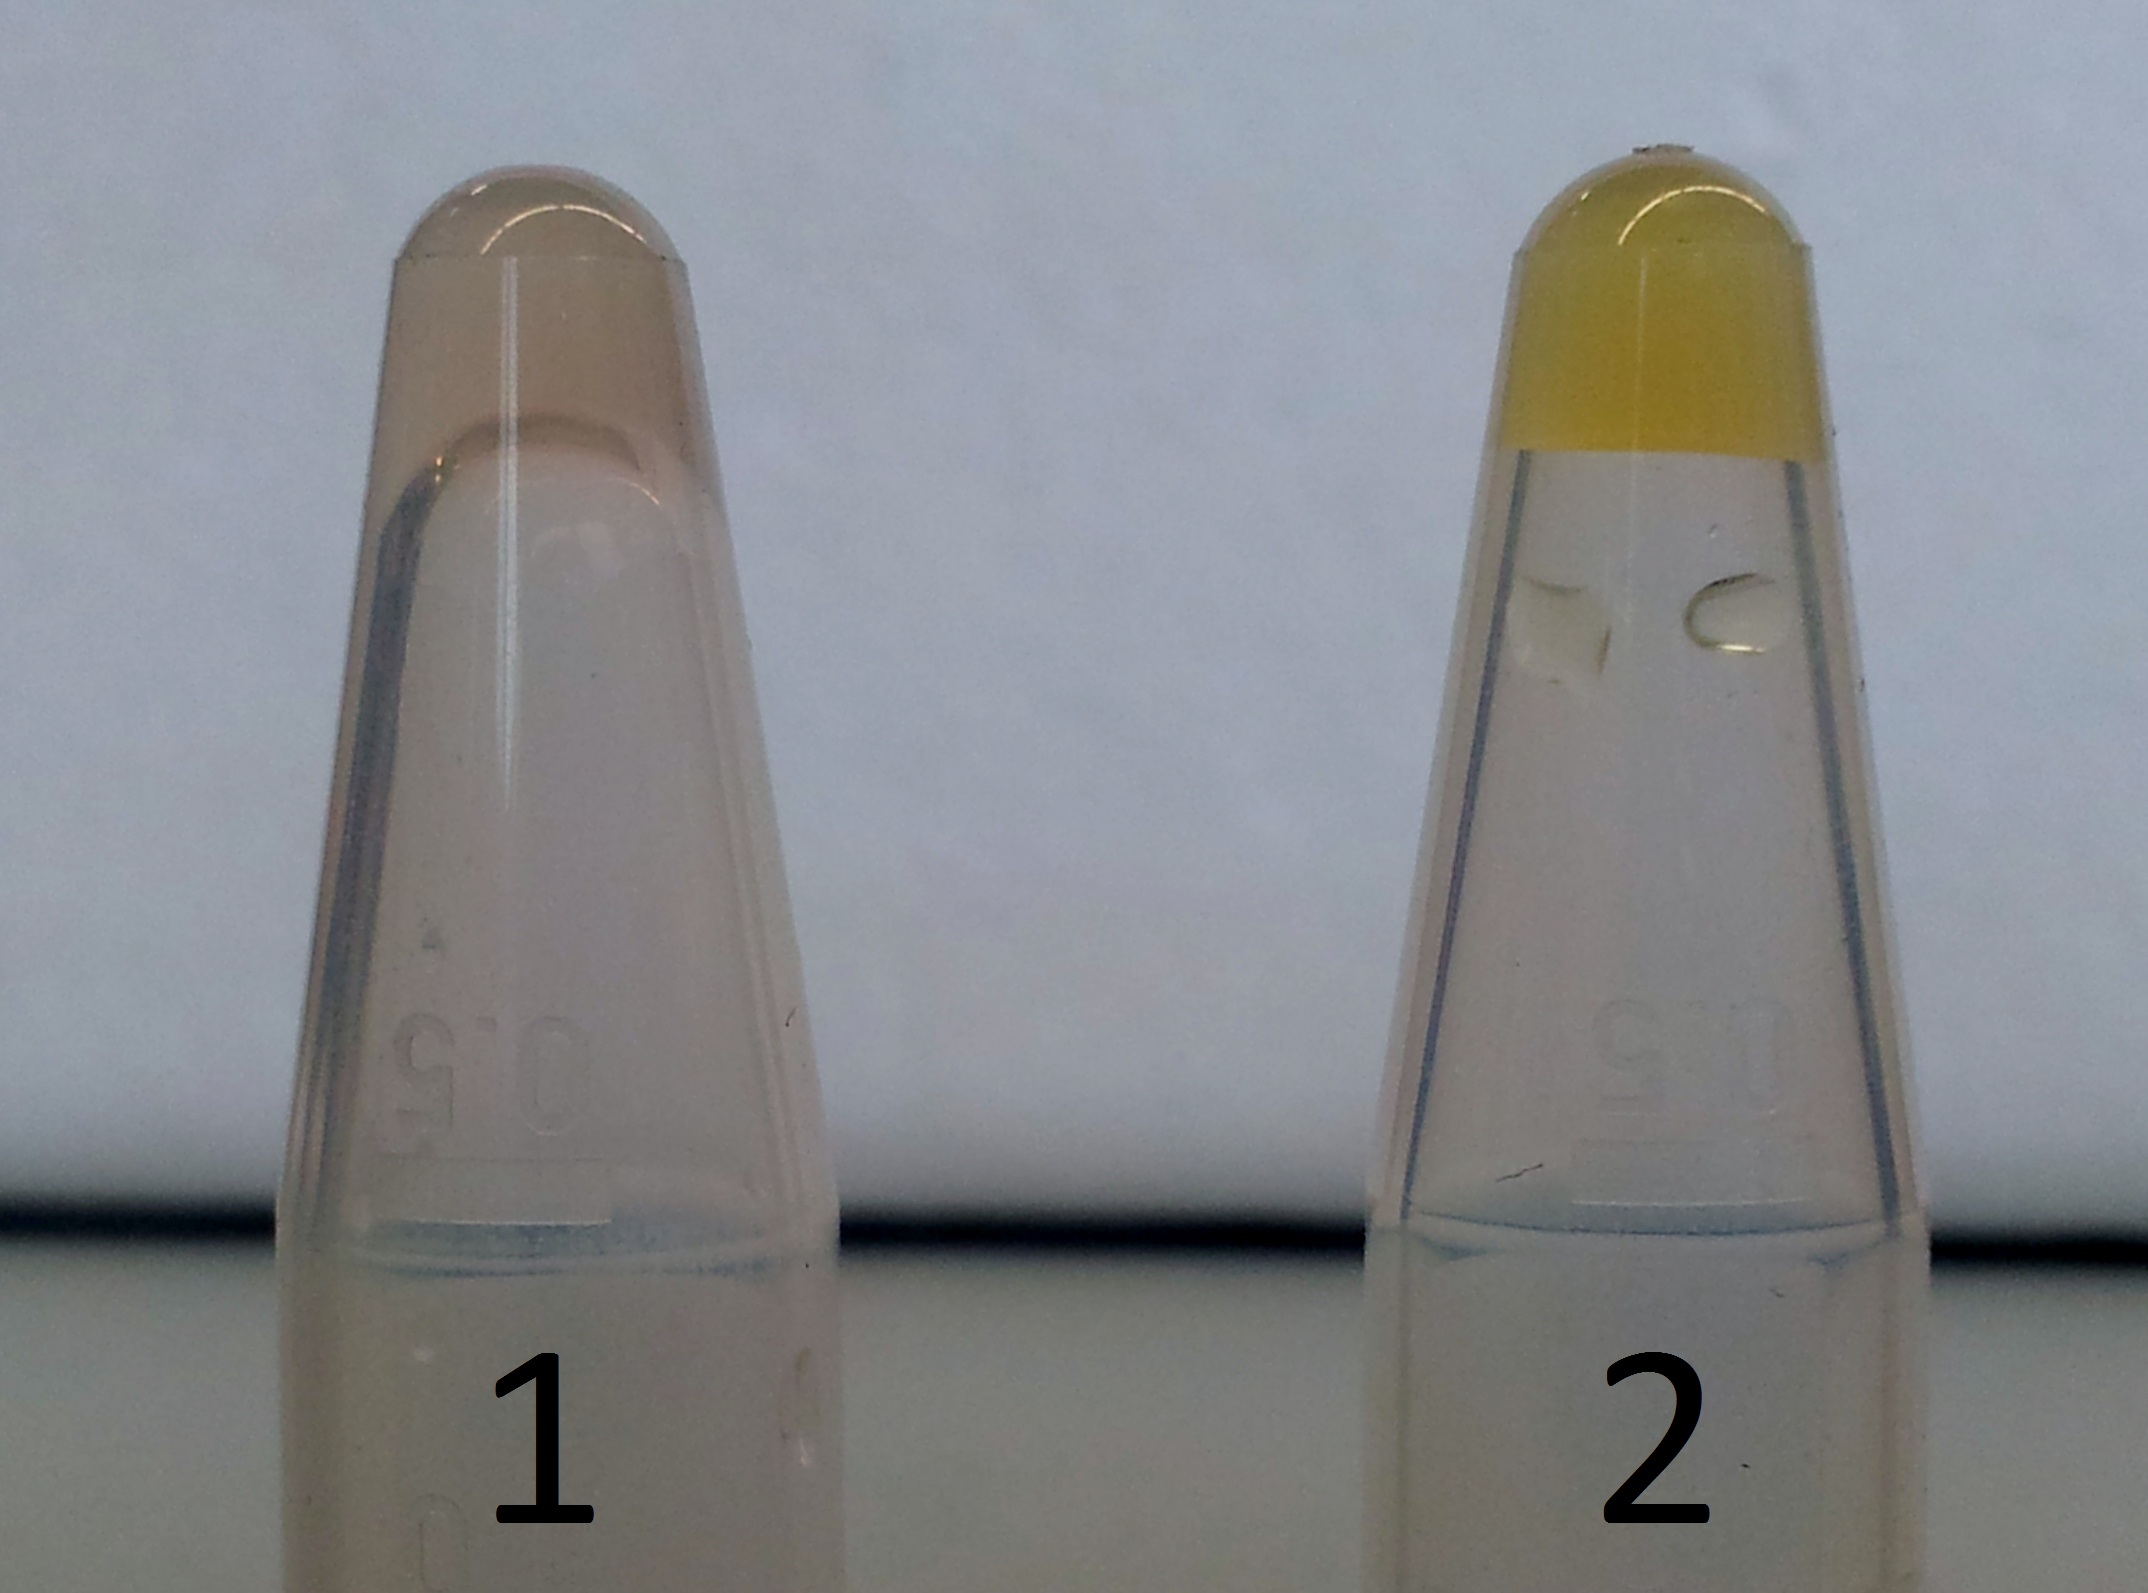
- AroY
- For protocol see here
- Bevor addition of XylE we see a brown solution. The brown color is typical for 1,2-Benzoquinone.
- After the addition of XylE we see a very high activity.
 "
"
