Team:Peking/Modeling/Ring/Simulation
From 2012.igem.org
m |
|||
| Line 1: | Line 1: | ||
<html></p></html>{{Template:Peking2012_Color_Prologue}}{{Template:Peking2012_Color_Modeling}}<html> | <html></p></html>{{Template:Peking2012_Color_Prologue}}{{Template:Peking2012_Color_Modeling}}<html> | ||
<script type="text/javascript"> | <script type="text/javascript"> | ||
| - | sublists_Now = | + | sublists_Now = 3; |
var subsubitem=subfirst.getElementsByTagName('ul')[sublists_Now].getElementsByTagName('a')[1]; | var subsubitem=subfirst.getElementsByTagName('ul')[sublists_Now].getElementsByTagName('a')[1]; | ||
subsubitem.style.color='#60b0f0'; | subsubitem.style.color='#60b0f0'; | ||
Revision as of 05:07, 26 October 2012
ODE Model
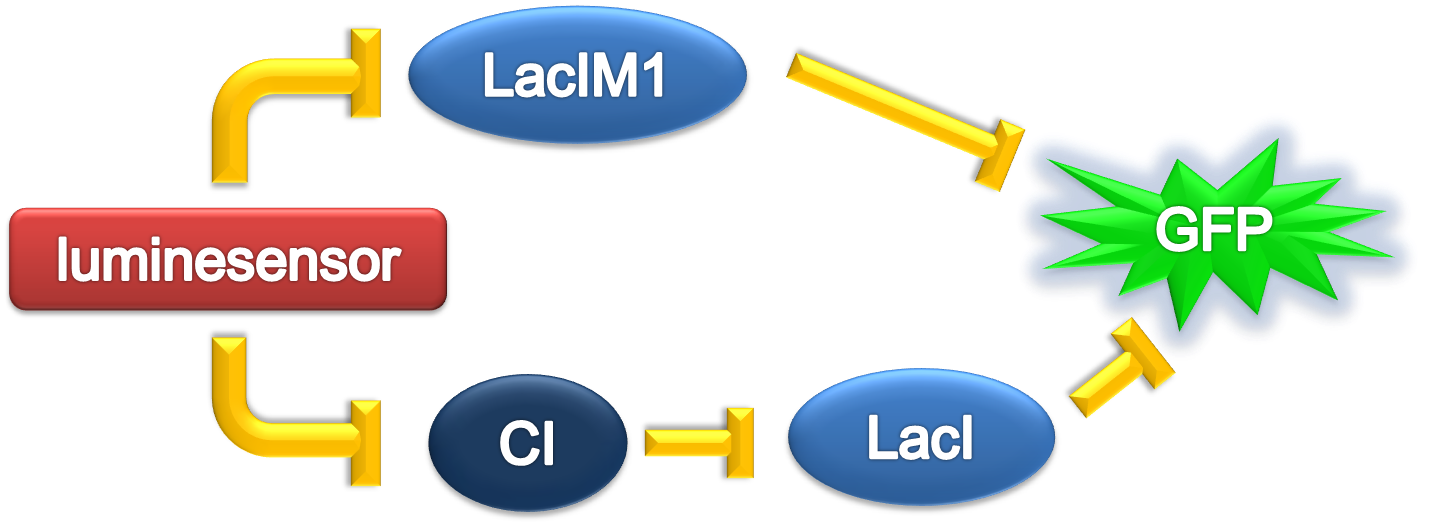
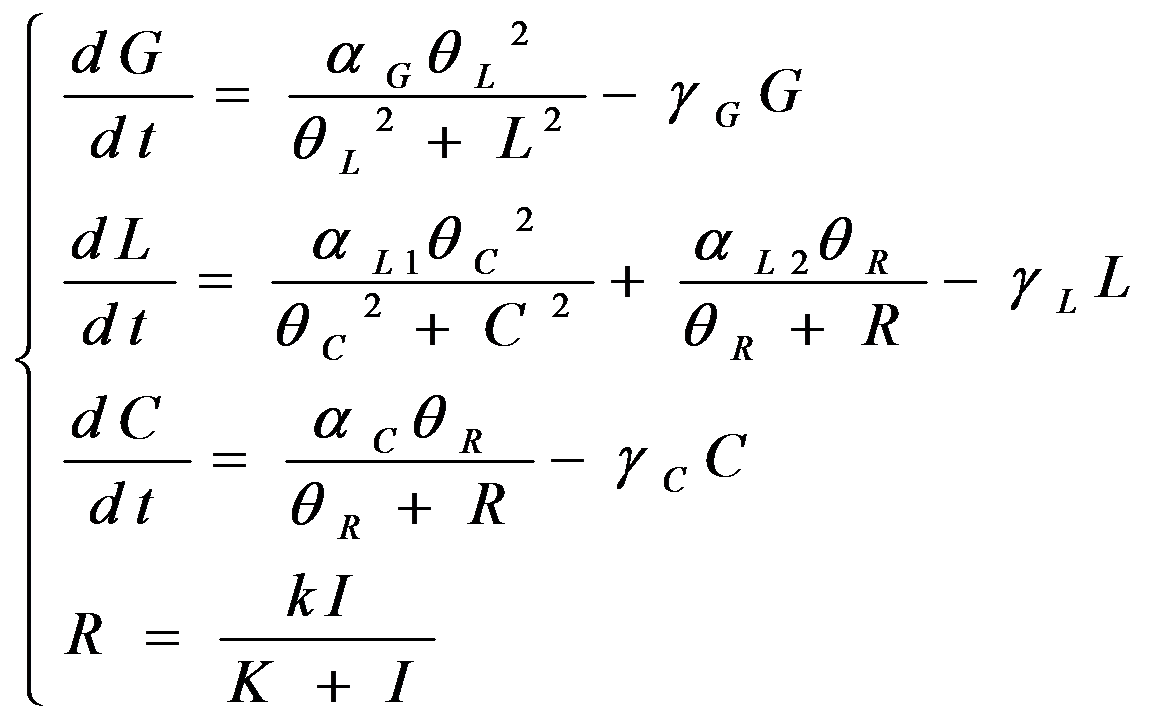
According to the previous circuit and ODE model, we listed all the differential equations and simulated this system in MATLAB with equations listed as below:


We applied the inverse square law to describe the light intensity distribution on the plate according to different radius, with a central intensity I0 in a region of r=1mm. Here, parameters are:
| Parameter | Value | Unit | Description | Source |
| aG | 2 | 10-6M/min | GFP production rate constant | [1] |
| aC | 2 | 10-6M/min | CI production rate constant | [1] |
| aL1 | 1 | 10-6M/min | LacI production rate constant | [1] |
| aL2 | 1 | 10-6M/min | LacIM1 production rate constant | [1] |
| bC | 8.x10-3 | 10-6M | Binding strength of CI on LacI operator | [1] |
| bL | 8.x10-1 | 10-6M | Binding strength of LacI or LacIM1 on GFP operator | [1] |
| bR | 1.x10-2 | 10-6M | Binding strength of Luminesensor on corresponding operator | |
| rG | 6.92x10⁻² | min-1 | GFP dissociation rate constant | [1] |
| rC | 6.92x10⁻² | min-1 | CI dissociation rate constant | [1] |
| rL | 2.31x10⁻² | min-1 | LacI and LacIM1 dissociation rate constant | [1] |
| I0 | 1000 | AU | Maximum light intensity in the middle of the plate | |
| k | 500 | 10-6M | Luminesensor activation rate under light | |
| K | 10000 | AU | Light sensitivity of Luminesensor activation |
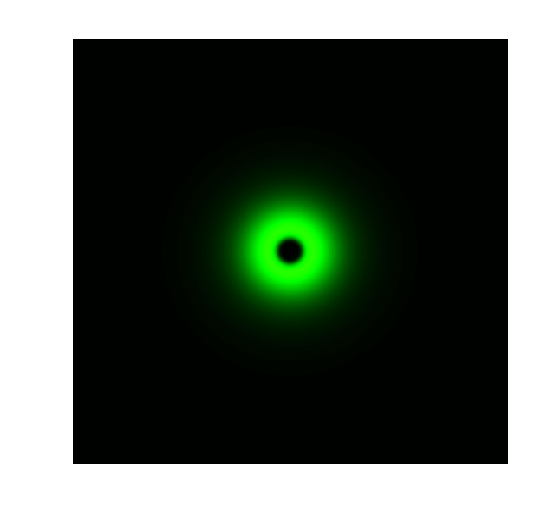
The simulation results in static state are shown below:

Figure 1. ODE Simulation in a plate of the ring-like pattern formation.

Figure 2. ODE Simulation for the radial expression amplitude of the ring-like pattern formation.
From the Figure 1 & 2 above, we discover that, with wildtype parameters, ring-like pattern is formed based on sender-receiver communication through bio-luminescence.
Parameter Analysis
After modeling the ring-like pattern formation with wildtype parameters, we attempted to optimize it in a rational way. We have tuned the parameters both up and down, one by one, and finally discovered several parameters which predominantly influence the expression intensity, ring radius, and band width of pattern formation.
| Parameter | Function | Description | Remark |
| aG/rG | If increasing, the expression intensity will be amplified, but the ring radius and the band width will not change. | Related to the production and dissociation of GFP | The production rate of GFP is easily tuned. |
| aC/(bC*rC) | If increasing, the expression intensity will increase, but the ring radius will decease and the band width will not change. | Related to the production and dissociation of CI | The production rate of CI is easily tuned |
| (k*I0)/(bR*K) | If increasing, the ring radius and the band width will increase, leaving the expression amplitude unchanged. | Related to the light intensity emitted by sender cells and the activation rate, light sensitivity, and binding efficiency of Luminesensor. | Light intensity could be tuned, although the effect may noe be obvious experimentally. |
| LacI and LacIM1 related parameters | Tend to influence all three criteria. | Related to the production and dissociation rate and binding efficiency of LacI and LaciM1. | Tuning is not useful to make a better pattern. |
As we can see, aG/rG, aC/(bC*rC), and (k*I0)/(bR*K) are the most important and accessible parameters for pattern formation. To make it clear, we tuned several of the parameters each in one of the three groups to see the effect on pattern formation, while holding other parameters unchanged.
Firstly, we tuned aG, the production rate of GFP:
.png)
Figure 3. Ring Pattern Simulation for aG=1x10⁻⁶M/min.
.png)
Figure 4. Ring Pattern Simulation for aG=2x10⁻⁶M/min.
.png)
Figure 5. Ring Pattern Simulation for aG=4x10⁻⁶M/min.
Then, we tuned aC, the production rate of CI:
.png)
Figure 6. Ring Pattern Simulation for aC=0.2x10⁻⁶M/min.
.png)
Figure 7. Ring Pattern Simulation for aC=2x10⁻⁶M/min.
.png)
Figure 8. Ring Pattern Simulation for aC=20x10-6M/min.
Ultimately, we tuned I0/K, the ratio of central light intensity to the sensitivity of Luminesensor:
.png)
Figure 9. Ring Pattern Simulation for I0/K=1x10-2M/min.
.png)
Figure 10. Ring Pattern Simulation for I0/K=1x10-1M/min.
.png)
Figure 11. Ring Pattern Simulation for I0/K=1x100M/min.
Reference
- 1. Subhayu Basu et al.(2005), A synthetic multicellular system for programmed pattern formation. Nature, vol.434: 1130: 1134
 "
"


