Team:TU-Eindhoven/LEC/Modelling
From 2012.igem.org
PetraAlkema (Talk | contribs) |
PetraAlkema (Talk | contribs) |
||
| Line 114: | Line 114: | ||
</h3> | </h3> | ||
| - | + | As we could not yet accomplish a complete sensitivity analysis on the model, we only consider the basic characteristics of the different parts of the model. Furthermore, the influences of some basic experimental setup values are stated, i.e. the concentration of extracellular calcium, Ca<sub>{ex}</sub>, and the duration of the pulse. | |
| - | + | ||
| - | + | ||
| - | + | ||
| - | + | ||
| - | + | ||
| - | + | ||
| - | As we could not yet accomplish a complete sensitivity analysis on the model, we only consider the basic characteristics of the different parts of the model. Furthermore, the influences of some basic experimental setup values are stated, i.e. the concentration of extracellular calcium, | + | |
As shown in figure \ref{pic:1a}, the basic model for calcium homeostasis in yeast cells shows an oscillatory system. As a result of the increase of the cytosolic $Ca^{2+}$-level, the concentrations $[CaM]$ and $[CaN]$ also increase, since calmodulin and calcineurin bind to calcium. Due to the negative feedback system caused by the protein Vcx1, the cytosolic $Ca^{2+}$-level decreases after obtaining a maximum value. This maximum value seems to be constant in time. In figure \ref{pic:1b}, a different initial value of the cytosolic $Ca^{2+}$ level is used, $20 \mu M$ instead of $10 \mu M$ in figure \ref{pic:1a}. This initial value does not seem to influence the overall values of the final state. | As shown in figure \ref{pic:1a}, the basic model for calcium homeostasis in yeast cells shows an oscillatory system. As a result of the increase of the cytosolic $Ca^{2+}$-level, the concentrations $[CaM]$ and $[CaN]$ also increase, since calmodulin and calcineurin bind to calcium. Due to the negative feedback system caused by the protein Vcx1, the cytosolic $Ca^{2+}$-level decreases after obtaining a maximum value. This maximum value seems to be constant in time. In figure \ref{pic:1b}, a different initial value of the cytosolic $Ca^{2+}$ level is used, $20 \mu M$ instead of $10 \mu M$ in figure \ref{pic:1a}. This initial value does not seem to influence the overall values of the final state. | ||
Revision as of 15:21, 25 September 2012

Global introduction
Biological cells use highly regulated homeostasis systems to keep a very low cytosolic Ca2+ level. In normal-growing yeast the cytosolic Ca2+ concentration is maintained in the range of 50-200nM in the presence of environmental Ca2+ concentrations ranging from µM to 100mM [1].
The homeostatis system in yeast cells has two basic characteristics. The cytosolic Ca2+ concentration is tightly controlled by zero steady-state error to extracellular stimuli and the system is relatively insensitive to specific kinetic parameters, due to robustness of such adaptation [2].
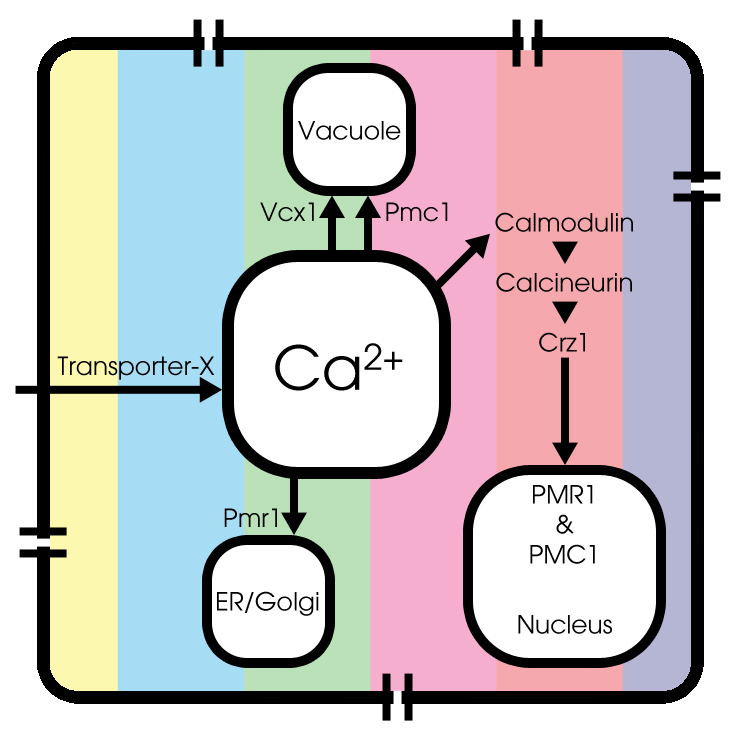
To achieve an accurate model, the influences of voltage-dependent calcium channels are added to a basic model for yeast calcium homeostasis. In this model, first described by J. Cui et al, the main contributions of calcium transport are defined [3].

Basic model
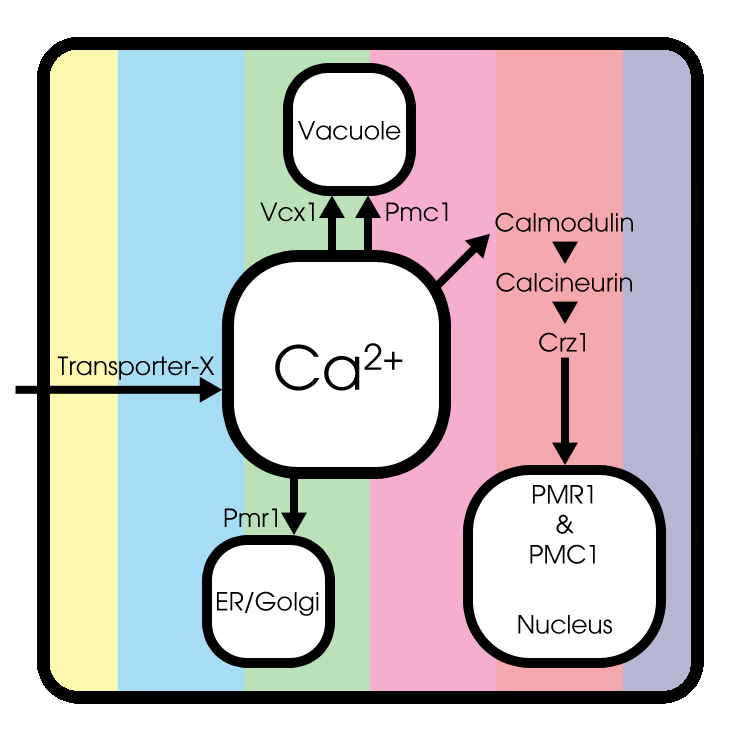
Under normal conditions, extracellular Ca2+ enters the cytosol through an unknown Transporter X, whose encoded gene has not been identified yet. Cytosolic Ca2+ can be pumped into the endoplasmic reticulum (ER) and Golgi system through Pmr1 and can be sequestered into the vacuole through Pmc1 and Vcx1.
Both the expression and function of Pmc1, Pmr1 and Vcx1 are regulated by calcineurin, a highly conserved protein phosphatase that is activated by Ca2+-bound calmodulin[3]. Therefore, the transcription factor Crz1 can be dephosporylated by activated calcineurin. A conformational switch model is used to simulate Crz1 translocation, as described by Okamura et al [4].

Voltage-dependent calcium channels
In literature, little can be found about modeling calcium channels in Saccaromyces Cerevisiae, most commonly known as budding yeast. Therefore we still used the model of sympathetic ganglion `B' type cells of a bullfrog to describe this process, since the type of voltage-dependent calcium channels is the same in both the bullfrog cells and the yeast cells.
More information on the voltage-dependent calcium channels is presented in the description of the inital model.

GECO-proteins
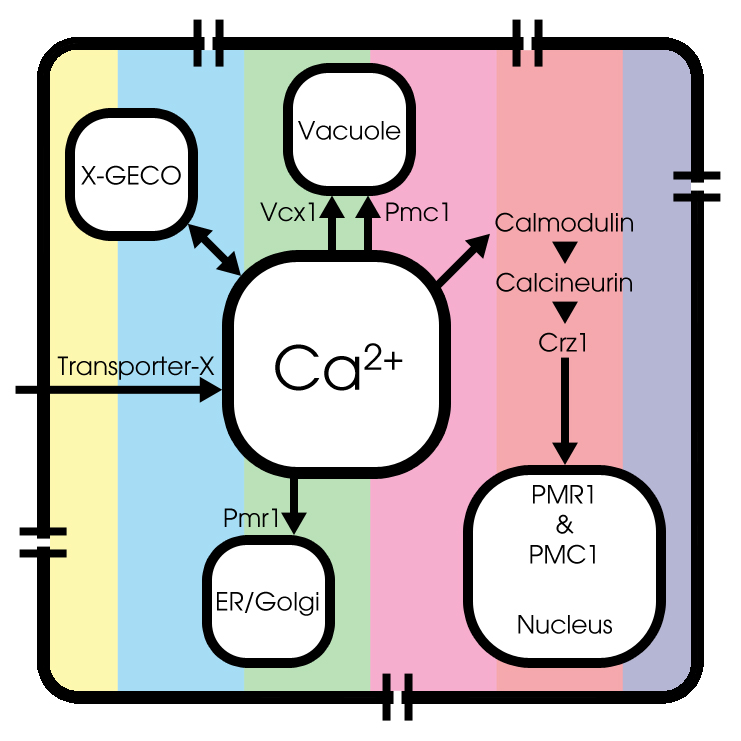
Last, but certainly not least, we added the kinetics of calcium binding by the GECO-proteins, since we use the fluorescent activity of CMV-X-GECO.1 proteins as light-emitting part of the cell, as a result of an increase of the cytosolic Ca2+-level.
The kinetic characterization of the GECO-proteins:

In short, we formulated a new basic calcium model for yeast cells. This model is extended with overexpression of voltage-dependent calcium channels and addition of GECO-kinetics. The model is made in MATLAB and the code can be found here.
In more detail
Since we do not want to bother the semi-interested readers with the complete derivation of the differential equations describing this model, this can be found in the bachelor thesis of one of our team members, Petra Alkema. In order to understand the results, discussion and conclusion in more detail, we really recommend to study this chapter ADD LINK CHAPTER 3. In an addition, a more detailed introduction to the conformational switch model, part of the total model, can be found here ADD LINK CONFORMATIONAL SWITCH MODEL.
The main differential equations are:

Parameters
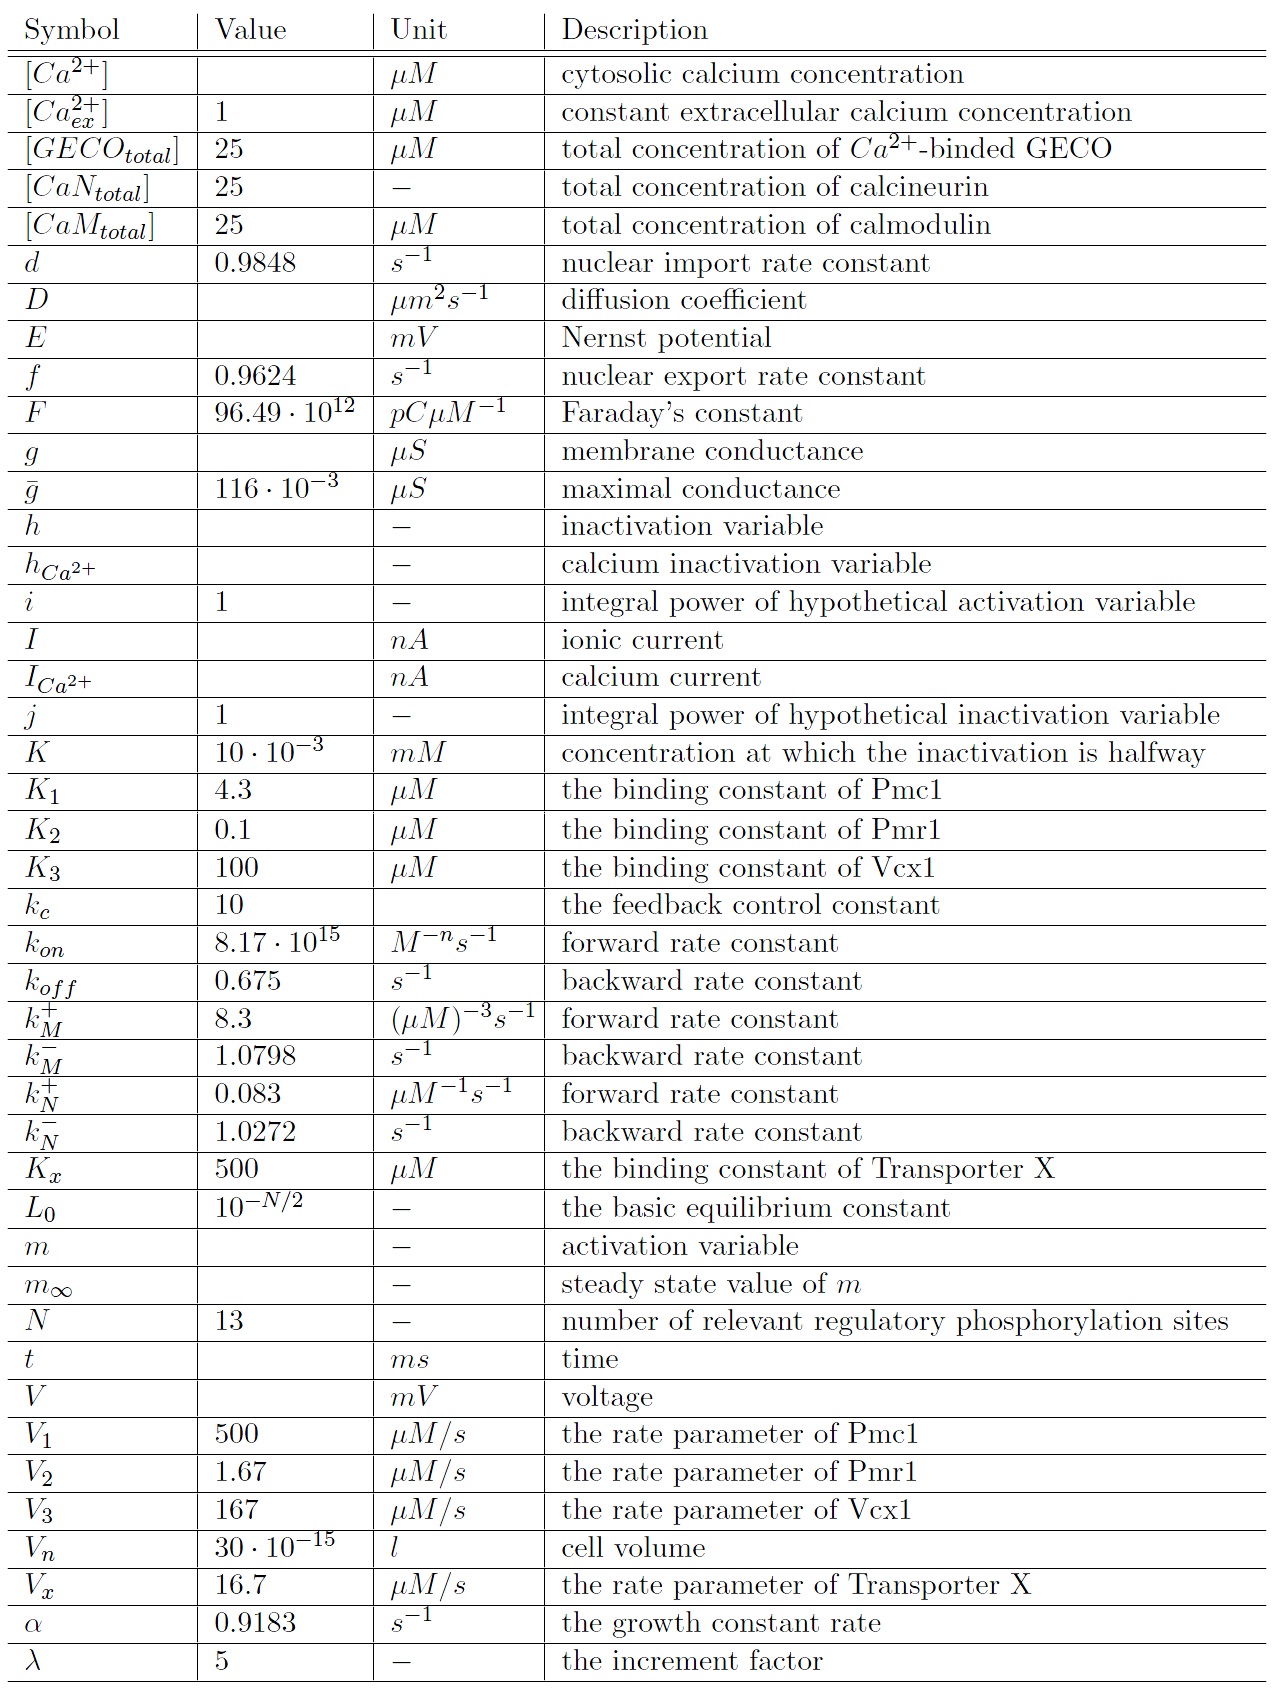
The model parameters for which all results are calculated, unless otherwise stated:
Results
As we could not yet accomplish a complete sensitivity analysis on the model, we only consider the basic characteristics of the different parts of the model. Furthermore, the influences of some basic experimental setup values are stated, i.e. the concentration of extracellular calcium, Ca{ex}, and the duration of the pulse.
As shown in figure \ref{pic:1a}, the basic model for calcium homeostasis in yeast cells shows an oscillatory system. As a result of the increase of the cytosolic $Ca^{2+}$-level, the concentrations $[CaM]$ and $[CaN]$ also increase, since calmodulin and calcineurin bind to calcium. Due to the negative feedback system caused by the protein Vcx1, the cytosolic $Ca^{2+}$-level decreases after obtaining a maximum value. This maximum value seems to be constant in time. In figure \ref{pic:1b}, a different initial value of the cytosolic $Ca^{2+}$ level is used, $20 \mu M$ instead of $10 \mu M$ in figure \ref{pic:1a}. This initial value does not seem to influence the overall values of the final state.
The concentration of $[Ca^{2+}]_{ex}$, however, does influence the behavior of the oscillation. In table \ref{tab: oscillatory period} the different times for one period of oscillation are shown. Looking at these values, it is shown that the decrease of this parameter has approximately the an increasing effect on the oscillation time of the system.
\begin{table}[h] \centering
   \begin{tabular}{l|l|}
       $[Ca^{2+}]_{ex}$ & Oscillatory period \\ \hline
       $10$ $\mu M$ & $2$ seconds \\
       $25$ $\mu M$ & $2.5$ seconds  \\
       $50$ $\mu M$ & $3.3$ seconds  \\
   \end{tabular}
\caption{Oscillatory period for different values of $[Ca^{2+}]_{ex}$} \label{tab: oscillatory period} \end{table}
Furthermore, we need to look into the results of the complete model, including the kinetics of the GECO-proteins and the characteristics of the voltage-dependent calcium channels. In figures \ref{pic:2a} and \ref{pic:2b} multiple pulses are shown, with different duration times. During the pulse, the calcium concentration increases and therefore also the concentrations of CaGECO and CaM. On the other hand, $[Crz]$ turns out to be constant in time and therefore no oscillatory system can be observed. After the pulse, the calcium concentration decreases remarkably fast, while the concentration of the GECO-calcium complex decreases much slower, as expected.
Looking at the results of the model in more detail, fig. \ref{pic:2c}, with a pulse duration of one second, the different influences of the specific parts of the model can be made more clear. Since the calcium level increases as a response to the pulse, both calmodulin and the GECO-protein will bind to calcium. Therefore, both $[CaM]$ and $[CaGECO]$ will reach their maximum. Next to it, the graphs of $[CaN]$ show clear influences of $[CaM]$. This is caused by the fact that calcineurin binds to calcium-bounded calmodulin.
When a shorter opening time of the calcium channels is modeled, fig \ref{pic:2c}, almost the same $Ca^{2+}$-level is reached. When the opening time of the calcium channels is reduced even more (fig. \ref{pic:2d}, \ref{pic:2e}), the $[Ca^{2+}]$-level does not reach the same maximum anymore. Both calmodulin and the GECO-protein are in total bounded to $[Ca^{2+}]$. Since this is only for a short duration, $[CaN]$ does not reach same level as for larger opening times. The figures \ref{pic:2c}, \ref{pic:2d} and \ref{pic:2e} however have a similar shape when it comes to the decrease of $[CaGECO]$, since the same maximum of $[CaGECO]$ is reached.
Discussion
One of the most important points of discussion is the overall correctness of the calcium model. Due to the fact that the characteristics of both the voltage-dependent calcium channels and the GECO-proteins are added to the calcium homeostasis of the organism Saccaromyces Cerevisiae, a completely new system is created. As far as we know, in literature, no experimental data can be found about this specific system. At the moment of writing, the wetwork of the iGEM team of Eindhoven University of Technology 2012 is unfortunately not able to provide applicable information. A great step forward could be made when this model can be checked with experimental data. Nevertheless this model does give some quantitative insight in the behavior.
The simplification of the calcium homeostasis in a living yeast cell certainly leads to some imperfections upon the level of the actual physiology. For example, in the current model, we assume that the concentrations of Pmc1 and Pmr1 are directly proportional to the quantity of transcriptionally active Crz1. This is a big simplification since in real cells, this process involves the increased gene expression through Crz1 followed by translation and transport of the proteins to the respective intracellular destinations. Moreover, the current model does not include the influence from other relevant pathways whereas in real cells, any response to given extracellular stimulus is likely to be the result of complex cross-talk between multiple pathways.
Also some other assumptions need to be taken into account. First, we assumed that only fully dephosphorylated Crz1 molecules in the nucleus are transcriptionally active since this has been shown the case for NFAT1. Although the mechanism of Crz1 translocation in yeast cells is strikingly similar to NFAT, not all processes can be regarded the same, since there are no experimental data found to validate this assumption. Second, we assumed the behavior of the voltage-dependent calcium channels in yeast cells to be the same as in sympathetic ganglion `B' type cells of a bullfrog.
The results, as presented in the previous section, show a large drop of the cytosolic Ca2+-level after removal of the potential difference. Although we could expect a fast recovery to the steady state, this drop is remarkably fast. This is one of the unexpected results of this model and therefore one of the more interesting parts to check with the experimental data. Especially since this drop will influence the concentration of calcium bounded GECO-protein.
In order to provide more quantitative insights in the experimental setup for the total project, we have to obtain information about the fluorescent properties of the GECO-proteins. At this moment we can only predict when the CaGECO concentration reaches a set percentage of the maximum amount of Ca2+-bounded GECO-protein. An important value is the amount of calcium bounded GECO-protein that needs to be there in order to detect fluorescent light.
Conclusion
To examine the calcium in the cell, a dynamic calcium model was designed. As a start a basic model of calcium homeostasis in yeast cells was presented and tested. This model was extended with overexpression of voltage-dependent calcium channels and addition of GECO-kinetics. With this model, we can test and verify theoretical hypotheses by comparing simulation results with corresponding experimental results and generate new hypotheses on the regulation of calcium homeostasis. On the other hand, due to the existence of unknown factors and the lack of experimental data, this model is not an exact model yet. However, it does can give some quantitative insight into the possible dynamics of the whole process and provide a general framework for more elaborate investigations.
We really hope that in the future of the iGEM competition one of the new iGEM teams will adapt our modeling project of calcium dynamics in yeast cells! :-)
References
- [1] A. Miseta, L. Fu, R. Kellermayer, J. Buckley, D.M. Bedwell, “The Golgi Apparatus plays a significant role in the maintainance of Ca2+ homeostasis in the vps33 vacuolar biogenesis mutant of Saccharomyces cerevisiae”, J. Biol. Chem. 274: 5939-5947, (1999)
- [2] H. Kitano, Systems biology : a brief overview, Nature 295: 1662-1664, (2002).
- [3] J. Cui, Mathematical modeling of metal ion homeostasis and signaling systems, (2009)
- [4] H. Okamura, J. Aramburu, C. Garca-Rodrguez, et al. Concerted dephosphorylation of the transcription factor NFAT1 induces a conformational switch that regulates transcriptional activity, Mol. Cell 6: 539-550, (2000).
 "
"
