Team:BYUProvo/Project
From 2012.igem.org
Johnwshumway (Talk | contribs) (→Thermosensor Library) |
(→The Experiments) |
||
| (8 intermediate revisions not shown) | |||
| Line 38: | Line 38: | ||
== Project Details== | == Project Details== | ||
| - | + | ===Circuit Diagram=== | |
| + | |||
| + | [[Image:Final_Draft_Poster_Circuit_Design.png|800px|center]] | ||
| + | |||
| + | ===Generating a Cre-Lox System for Stable Thermosensor Output=== | ||
| + | The Goal: Since temperature increases are likely to be transient, we desired to link | ||
| + | the thermosensor to a stable output that would maintain a signal long after the | ||
| + | temperature increase was gone. To do this, we used the well characterized Cre- | ||
| + | Lox system. Cre is a recombinase which removes DNA between flanking LoxP sites. | ||
| + | Thus, we linked Cred to the thermosensor (the ATG of the thermosensor now serves | ||
| + | as the ATG of Cre), and then also linked a reporter (GFP) to a promoter that would | ||
| + | only work when Cre was expressed. | ||
| + | |||
| + | Take 1: Testing a Cre-Lox system. | ||
| + | First, we attempted to create a Cre-Lox system that could be tested independent | ||
| + | of our thermosensor. To do this, we constructed Cre that was expressed from an | ||
| + | arabinose-inducible promoter (pBAD). This construct also had a reporter gene | ||
| + | (GFP) downstream of a constitutive promoter(PCon). Between the GFP and its | ||
| + | promoter, we placed a loxP cassette which consisted of a LoxP site followed by a | ||
| + | gentamicin resistance gene, a terminator, and another LoxP site. Thus, when Cre | ||
| + | was induced with arabinose, the gentamicin resistance gene and terminator would | ||
| + | be removed, allowing GFP to be expressed from the constitutive promoter. We | ||
| + | obtained a plasmid containing the LoxP-Gentamicin resistance gene-terminator- | ||
| + | LoxP from the Joel Griffitt's lab at BYU and made the following construct. | ||
| + | |||
| + | --------PBAD--Cre--PCon--LoxP--Gentamicin resistance gene--Terminator-- | ||
| + | LoxP--SD--GFP-- | ||
| + | |||
| + | Unfortunately, when we tested this construct it did not work. When we grew | ||
| + | the cells on arabinose and then tested for both Gentamicin resistance and GFP | ||
| + | fluorescence, the cells were all gentamycin resistance and non were expressing | ||
| + | detectable GFP. We then decided to try a simpler system with our on LoxP | ||
| + | terminator design as follows: | ||
| + | |||
| + | --------PBAD--Cre--PCon--LoxP--Terminator--LoxP--SD--GFP-- | ||
| + | |||
| + | We are in the process of testing this system for green fluorescence following | ||
| + | arabinose induction. Hopefully we will have some data to show you at the iGEM | ||
| + | regionals! | ||
| + | |||
| + | ===Generating a Lactate Sensor=== | ||
| + | |||
| + | Our lactate sensors were generated using the findings of Looger et al. (Looger, | ||
| + | |||
| + | LL. et al., Computational design of receptor and sensor proteins with novel | ||
| + | functions (Nature 2003). The MglB protein was mutated at the 7 sites | ||
| + | reported by Looger et al., (Y10K, D14K, N91K, K92L, H152M, D154H, | ||
| + | R158K, W183K, D236A and N256D) by proper primer design and use | ||
| + | of the Strategene Multi Site-directed Mutagenesis Kit and protocol. Due | ||
| + | |||
| + | to the multiple mutations, two rounds of mutagenesis were necessary to | ||
| + | incorporate all mutations, and several colonies had to be sequenced after | ||
| + | each round in order to identify colonies that contained all of the mutations. | ||
| + | |||
| + | This sensor interacts with the Trz fusion protein when it binds lactate. | ||
| + | Trz is a Trg-EnvZ fusion that phosphorylates the OmpC transcriptional | ||
| + | regulator when activated. We received a plasmid with Trz as well as an | ||
| + | OmpC-LacZ reporter from Dr Hazelbauer’s lab at the University of Missouri . | ||
| + | The reporter we are using is this lacZ reporter, which gives a 4X induction | ||
| + | with 100uM L-lactate when using the mutate Mgl2 protein. The Kd (2 uM) | ||
| + | is within the physiological range of lactate concentrations for many cell | ||
| + | growth conditions. | ||
=== The Experiments === | === The Experiments === | ||
| Line 45: | Line 106: | ||
PUT PLATE PICTURES FROM JORDAN HERE | PUT PLATE PICTURES FROM JORDAN HERE | ||
| + | |||
| + | '''Key for the pictures''' | ||
| + | |||
| + | Ctr: Control, Clockwise: TS short; 5-3; 10-1; TSA | ||
| + | |||
| + | P: Clockwise from top: P1, P8, P7, P6, P5, P4, P3, P2 | ||
| + | |||
| + | P-G: Clockwise from left: G12, G10, G9, P12, P10 | ||
| + | 30, 35, 37 in the file names refer to the temperatures at which the plates were incubated. | ||
| + | |||
| + | <gallery> | ||
| + | Image:30 Ctr.JPG|30 Ctr | ||
| + | Image:30 P.jpg|30 P | ||
| + | Image:30 P-G.jpg|30 P-G | ||
| + | </gallery> | ||
| + | |||
| + | <gallery> | ||
| + | Image:35 Ctr.jpg|35 Ctr | ||
| + | Image:35 P.jpg|35 P | ||
| + | Image:35 P-G.jpg|35 P-G | ||
| + | </gallery> | ||
| + | |||
| + | <gallery> | ||
| + | Image:37 Ctr.jpg|37 Ctr | ||
| + | Image:37 P .jpg|37 P | ||
| + | Image:37 P-G.jpg|37 P-G | ||
| + | Image:37 P-G2.jpg|37 P-G2 | ||
| + | </gallery> | ||
| + | |||
PUT LACTATE SENSOR HERE | PUT LACTATE SENSOR HERE | ||
| Line 72: | Line 162: | ||
[[File:PR3.png|maxwidth=400|right]] | [[File:PR3.png|maxwidth=400|right]] | ||
| + | It is interesting to note the change in enzyme activity for many thermosensors from 35°C to 37°C. These thermosensors are particularly useful for our project, because this range is close to the physiological temperature range for mutating cells. Higher temperatures and smaller temperature ranges in which the thermosensor unfolds indicate a better quality thermosensor. We determined the secondary structure of each thermosensor using Matlab (we also compared this with the online program RNAfold, seeing almost identical results). A few of the secondary structures are shown below. We used these secondary structures to determine the total number of bonds within each RNA hairpin. Using text values, G-C = -2.0 kcal/mol, U-A = -1.0 kcal/mol, and U-G = -0.8 kcal/mol, we calculated the bonding energies. We then compared the bonding energies to the change in enzyme activity and to the total number of bonds. In both comparisons, we identified the data point representing the wild type thermosensor as an outlier (G-test) and removed it. | ||
| + | [[File:PR.4.png|maxwidth=400|left]] | ||
| + | Performing a linear regression on the data comparing bonding energies to enzyme activity, we found a line with slope m = 0.969 and intercept b = 0.343. The r^2 value for this dataset was 0.4703. We performed a similar regression on the data comparing Total number of bonds to enzyme activity, finding a line with slope m = 0.940 and intercept b = 0.236. The r^2 value for this dataset was 0.639. Thus, for our thermosensor library, to determine which species would have a large change in enzyme activity, another a measure of quality, it is more useful to look at the total number of bonds than to look at the individual G-C, A-U and G-U bond content which determine the bonding energy. | ||
| - | |||
| - | |||
| - | |||
[[File:TSA.png|maxwidth=100]] | [[File:TSA.png|maxwidth=100]] | ||
Latest revision as of 02:53, 4 October 2012

|

|

|
| Home | Team | Team Profile | Project | Parts | Modeling |
|
Safety | Outreach | Collaboration | Attributions |
Contents |
Abstract
E. Colonoscopy
INSERT ABSTRACT HERE
Project Details
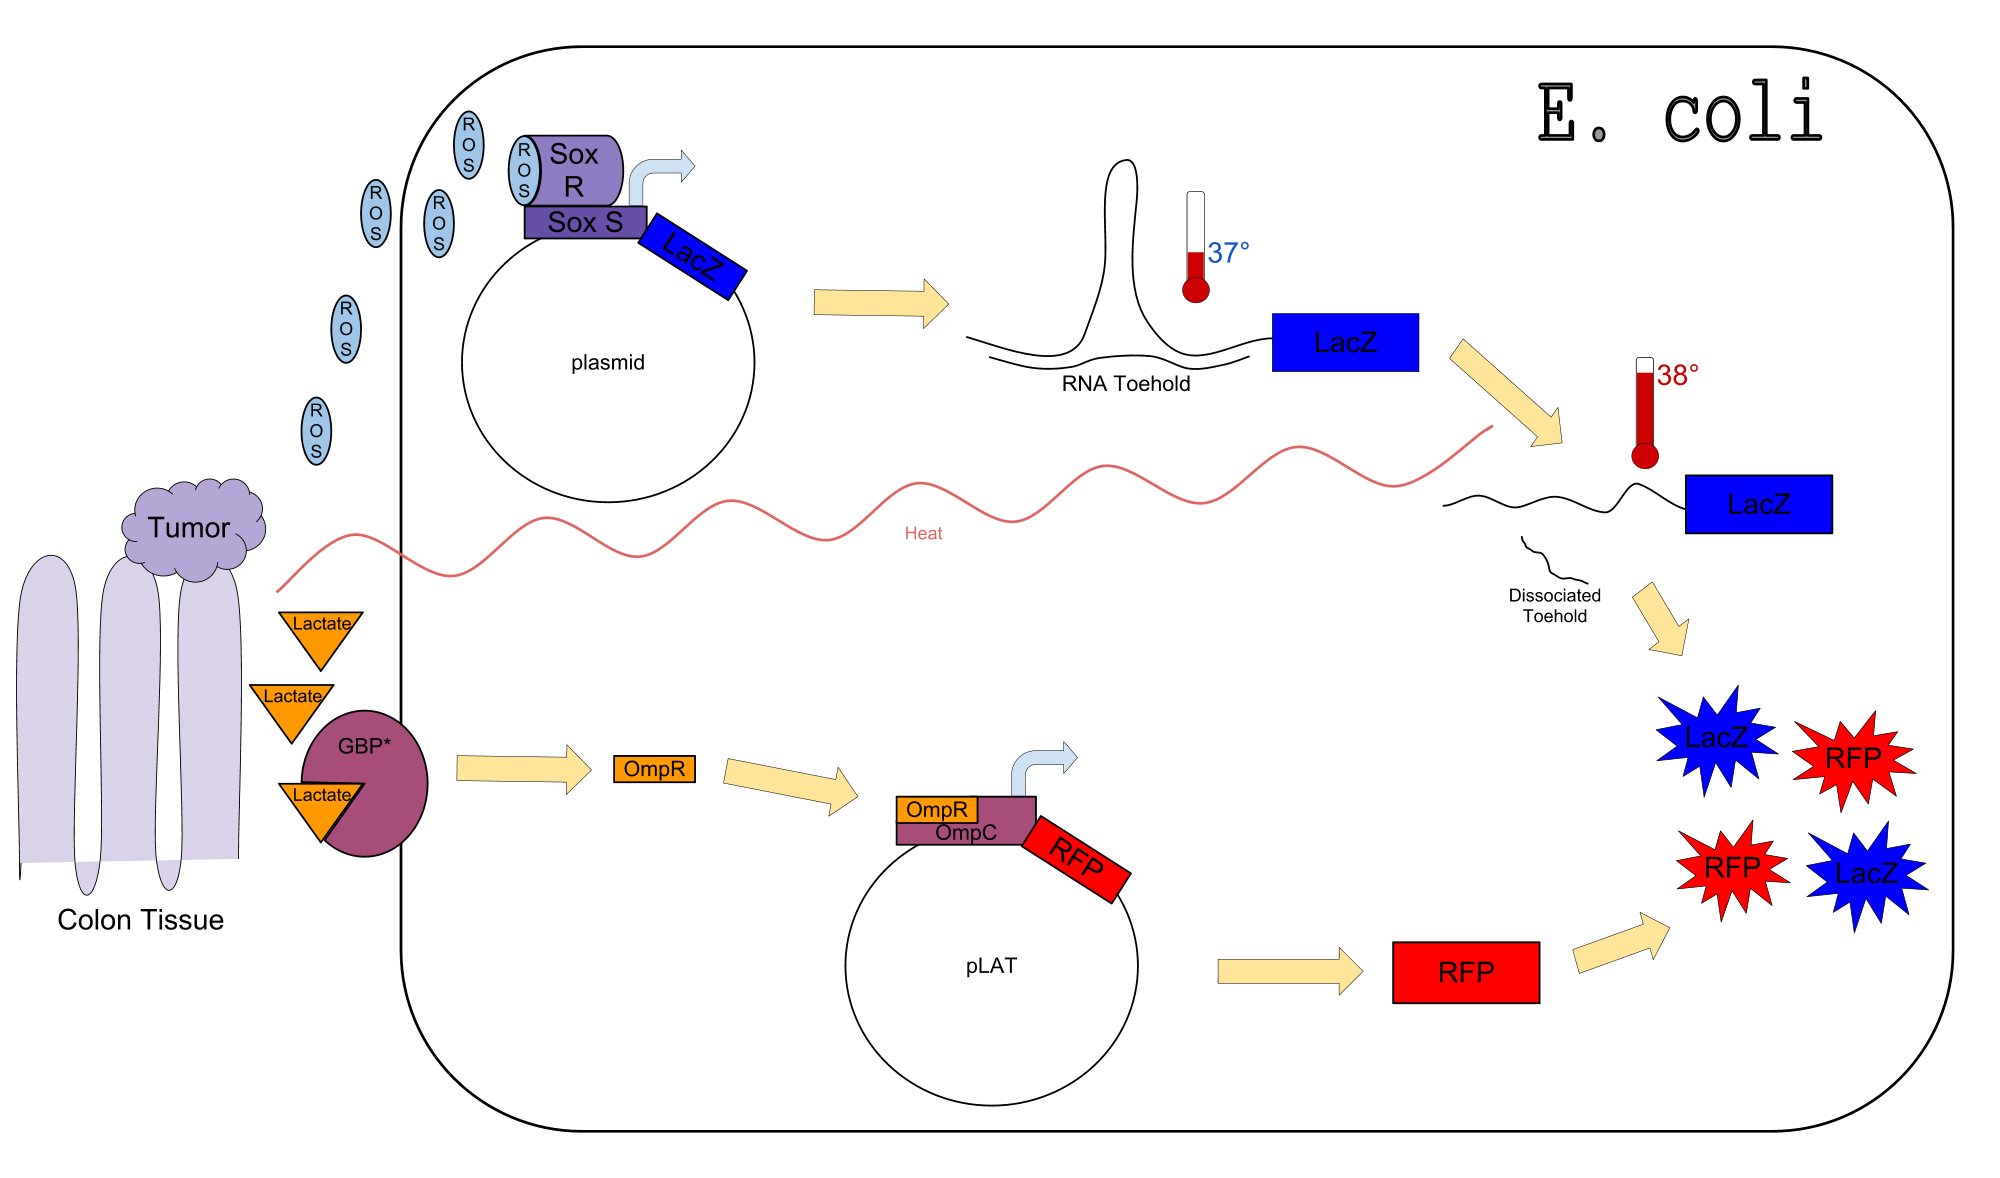
Circuit Diagram
Generating a Cre-Lox System for Stable Thermosensor Output
The Goal: Since temperature increases are likely to be transient, we desired to link the thermosensor to a stable output that would maintain a signal long after the temperature increase was gone. To do this, we used the well characterized Cre- Lox system. Cre is a recombinase which removes DNA between flanking LoxP sites. Thus, we linked Cred to the thermosensor (the ATG of the thermosensor now serves as the ATG of Cre), and then also linked a reporter (GFP) to a promoter that would only work when Cre was expressed.
Take 1: Testing a Cre-Lox system. First, we attempted to create a Cre-Lox system that could be tested independent of our thermosensor. To do this, we constructed Cre that was expressed from an arabinose-inducible promoter (pBAD). This construct also had a reporter gene (GFP) downstream of a constitutive promoter(PCon). Between the GFP and its promoter, we placed a loxP cassette which consisted of a LoxP site followed by a gentamicin resistance gene, a terminator, and another LoxP site. Thus, when Cre was induced with arabinose, the gentamicin resistance gene and terminator would be removed, allowing GFP to be expressed from the constitutive promoter. We obtained a plasmid containing the LoxP-Gentamicin resistance gene-terminator- LoxP from the Joel Griffitt's lab at BYU and made the following construct.
PBAD--Cre--PCon--LoxP--Gentamicin resistance gene--Terminator--
LoxP--SD--GFP--
Unfortunately, when we tested this construct it did not work. When we grew the cells on arabinose and then tested for both Gentamicin resistance and GFP fluorescence, the cells were all gentamycin resistance and non were expressing detectable GFP. We then decided to try a simpler system with our on LoxP terminator design as follows:
PBAD--Cre--PCon--LoxP--Terminator--LoxP--SD--GFP--
We are in the process of testing this system for green fluorescence following arabinose induction. Hopefully we will have some data to show you at the iGEM regionals!
Generating a Lactate Sensor
Our lactate sensors were generated using the findings of Looger et al. (Looger,
LL. et al., Computational design of receptor and sensor proteins with novel functions (Nature 2003). The MglB protein was mutated at the 7 sites reported by Looger et al., (Y10K, D14K, N91K, K92L, H152M, D154H, R158K, W183K, D236A and N256D) by proper primer design and use of the Strategene Multi Site-directed Mutagenesis Kit and protocol. Due
to the multiple mutations, two rounds of mutagenesis were necessary to incorporate all mutations, and several colonies had to be sequenced after each round in order to identify colonies that contained all of the mutations.
This sensor interacts with the Trz fusion protein when it binds lactate. Trz is a Trg-EnvZ fusion that phosphorylates the OmpC transcriptional regulator when activated. We received a plasmid with Trz as well as an OmpC-LacZ reporter from Dr Hazelbauer’s lab at the University of Missouri . The reporter we are using is this lacZ reporter, which gives a 4X induction with 100uM L-lactate when using the mutate Mgl2 protein. The Kd (2 uM) is within the physiological range of lactate concentrations for many cell growth conditions.
The Experiments
We generated a library of thermosensors via TAQ random mutagenesis. Colonies were plated at 30'C and then shifted to 37'C to monitor the reporter gene expression, LacZ. Colonies that appeared to express LacZ differently from the wildtype thermosensor were picked, patched and retested for their phenotype. From over 200,000 colonies screened, we identified 11 thermosensors that produced a more robust output when shifted from 35'C to 37'C.
PUT PLATE PICTURES FROM JORDAN HERE
Key for the pictures
Ctr: Control, Clockwise: TS short; 5-3; 10-1; TSA
P: Clockwise from top: P1, P8, P7, P6, P5, P4, P3, P2
P-G: Clockwise from left: G12, G10, G9, P12, P10 30, 35, 37 in the file names refer to the temperatures at which the plates were incubated.
30 Ctr.JPG
30 Ctr |
30 P.jpg
30 P |
30 P-G.jpg
30 P-G |
35 Ctr.jpg
35 Ctr |
35 P.jpg
35 P |
35 P-G.jpg
35 P-G |
37 Ctr.jpg
37 Ctr |
37 P .jpg
37 P |
37 P-G.jpg
37 P-G |
37 P-G2.jpg
37 P-G2 |
PUT LACTATE SENSOR HERE
PUT CRE HERE
Results
We successfully completed 2 main projects in the time we spent from January to September.
- First we created a circuit within E. Coli that senses 3 different products that cancer cells produce in abundance: reactive oxygen species (ROS), increased temperatures, and lactate.
- Second, we created a library of thermosensors react to different temperatures along different time steps.
Circuit
Our circuit has been constructed and is currently under testing.
Thermosensor Library
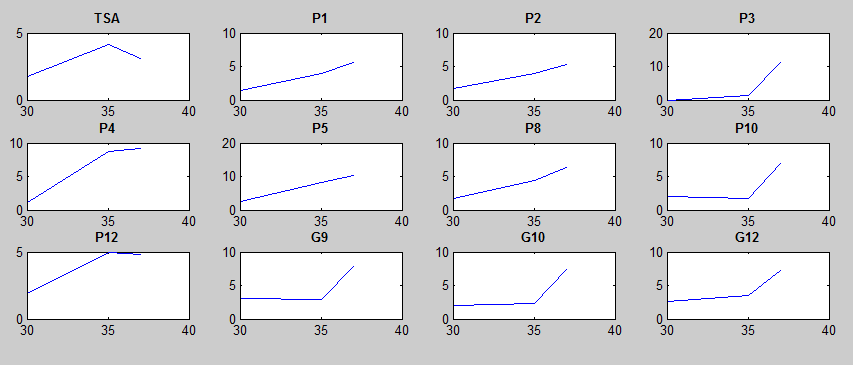
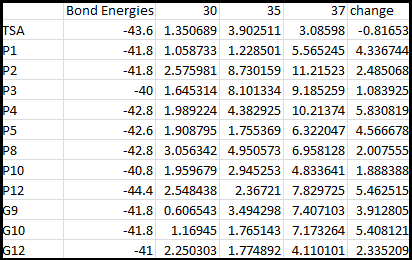
After doing multiple genetic screens using error-prone polymerase, we identified, out of thousands of different colonies, 11 mutant thermosensors that function in different, more useful ways than the wild type thermosensor (TSA). TSA is a thermosensor that slowly unfolds when the temperature changes from 30°C to 35°C. The 11 thermosensors we chose are unique because they unfold at a higher, narrower temperature range. Most of them only responded at a temperature somewhere in between 35°C and 37°C. Below we present data obtained by doing beta-galactosidase assays, which reports, in Miller units, the enzyme activity of each thermosensor at 3 different temperatures: 30°C, 35°C, and 37°C.
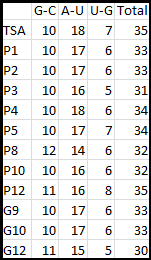
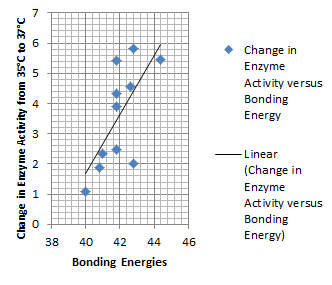
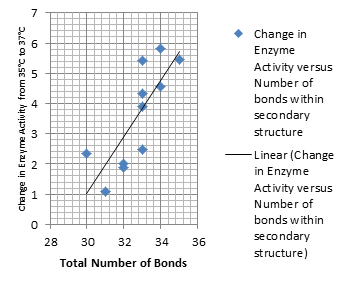
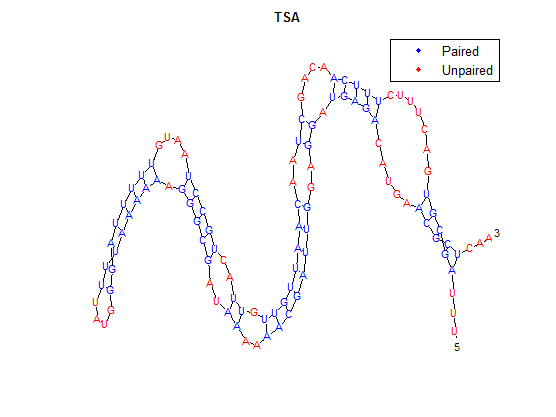
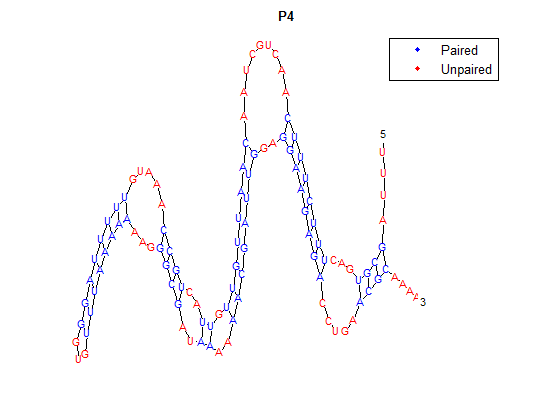
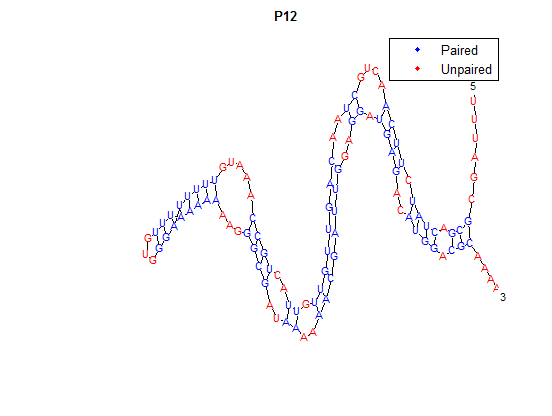
It is interesting to note the change in enzyme activity for many thermosensors from 35°C to 37°C. These thermosensors are particularly useful for our project, because this range is close to the physiological temperature range for mutating cells. Higher temperatures and smaller temperature ranges in which the thermosensor unfolds indicate a better quality thermosensor. We determined the secondary structure of each thermosensor using Matlab (we also compared this with the online program RNAfold, seeing almost identical results). A few of the secondary structures are shown below. We used these secondary structures to determine the total number of bonds within each RNA hairpin. Using text values, G-C = -2.0 kcal/mol, U-A = -1.0 kcal/mol, and U-G = -0.8 kcal/mol, we calculated the bonding energies. We then compared the bonding energies to the change in enzyme activity and to the total number of bonds. In both comparisons, we identified the data point representing the wild type thermosensor as an outlier (G-test) and removed it.
Performing a linear regression on the data comparing bonding energies to enzyme activity, we found a line with slope m = 0.969 and intercept b = 0.343. The r^2 value for this dataset was 0.4703. We performed a similar regression on the data comparing Total number of bonds to enzyme activity, finding a line with slope m = 0.940 and intercept b = 0.236. The r^2 value for this dataset was 0.639. Thus, for our thermosensor library, to determine which species would have a large change in enzyme activity, another a measure of quality, it is more useful to look at the total number of bonds than to look at the individual G-C, A-U and G-U bond content which determine the bonding energy.
 "
"
