Team:Shenzhen/Result/YAO.Sensor
From 2012.igem.org
(Difference between revisions)
XiaopengXu (Talk | contribs) |
|||
| (5 intermediate revisions not shown) | |||
| Line 105: | Line 105: | ||
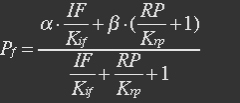
<ul><p>At equilibrium: [[File:Eqn26.jpg]] , so</p> | <ul><p>At equilibrium: [[File:Eqn26.jpg]] , so</p> | ||
<p>[[File:Eqn27.jpg]] (19)</p></ul> | <p>[[File:Eqn27.jpg]] (19)</p></ul> | ||
| - | + | ||
<ul><div class="figurep"> | <ul><div class="figurep"> | ||
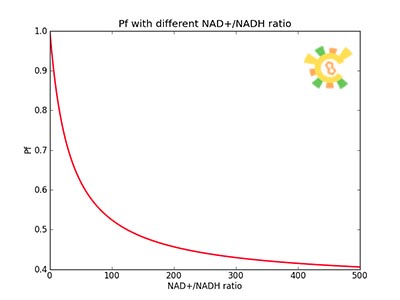
[[File:result_yao_sensor_p5.jpg]] | [[File:result_yao_sensor_p5.jpg]] | ||
| Line 118: | Line 118: | ||
<p>With (21) in (20),</p> | <p>With (21) in (20),</p> | ||
<p>[[File:Eqn30.jpg]] (22)</p></ul> | <p>[[File:Eqn30.jpg]] (22)</p></ul> | ||
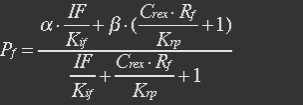
| - | <ul><p>At equilibrium , so</p> | + | <ul><p>At equilibrium: [[File:Eqn31.jpg]] , so</p> |
| - | <p>[[File: | + | <p>[[File:Eqn32.jpg]] (23)</p> |
<p><i>Nrib = 1. Kp = 288 U/h, assuming 40 amino acids per second. KdGFP = 1.386 h-1 equal to a half time of 30 min [3]. Growth rate = 0.1 h-1.</i></p></ul> | <p><i>Nrib = 1. Kp = 288 U/h, assuming 40 amino acids per second. KdGFP = 1.386 h-1 equal to a half time of 30 min [3]. Growth rate = 0.1 h-1.</i></p></ul> | ||
<ul><div class="figurep"> | <ul><div class="figurep"> | ||
| Line 129: | Line 129: | ||
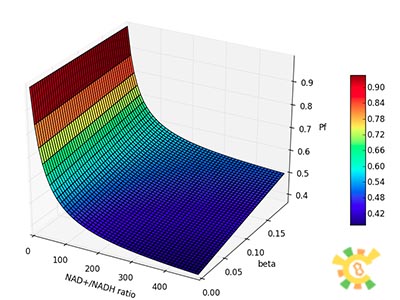
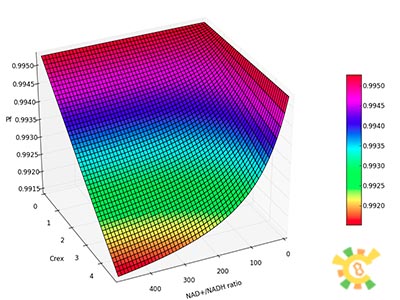
<ul><div class="figurep"> | <ul><div class="figurep"> | ||
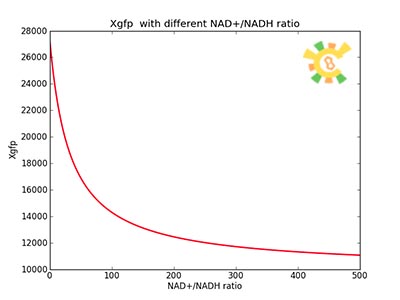
[[File:result_yao_sensor_p8.jpg]] | [[File:result_yao_sensor_p8.jpg]] | ||
| - | <p>Figure 8. | + | <p>Figure 8. XGFP with different NAD+/NADH ratio.</p></div></ul> |
| - | <ul>< | + | <ul><li>Response for Dynamic states</li></ul> |
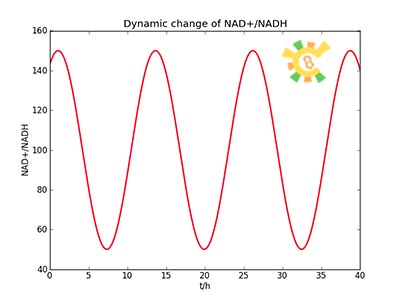
<ul><p>Because the NAD+/NADH level might change in times, so we assume that the change is sinusoidal function as follows: </p> | <ul><p>Because the NAD+/NADH level might change in times, so we assume that the change is sinusoidal function as follows: </p> | ||
<p> NH=Asin(t/2)+B</p> | <p> NH=Asin(t/2)+B</p> | ||
| - | <p> A=100, B=50, t=0~40. </p></ul> | + | <p> A=100, B=50, t=0~40 h. </p></ul> |
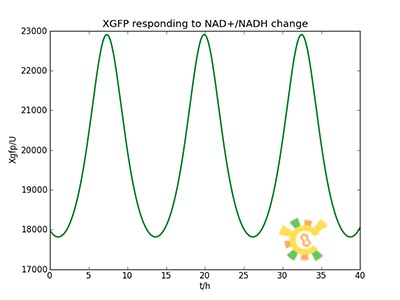
<ul><p>The curve is shown in Figure 9. Then as a result the production of GFP might also changes as a response to the change in NAD+/NADH.</p></ul> | <ul><p>The curve is shown in Figure 9. Then as a result the production of GFP might also changes as a response to the change in NAD+/NADH.</p></ul> | ||
<ul><div class="figurep"> | <ul><div class="figurep"> | ||
| Line 141: | Line 141: | ||
[[File:result_yao_sensor_p10.jpg]] | [[File:result_yao_sensor_p10.jpg]] | ||
<p>Figure 10. Response in GFP production</p></div></ul> | <p>Figure 10. Response in GFP production</p></div></ul> | ||
| - | + | </div> | |
<div class="context"> | <div class="context"> | ||
<h5>References</h5> | <h5>References</h5> | ||
| Line 150: | Line 150: | ||
<ul><p>[5] Deshpande, A. P. and S. S. Patel 2012. "Mechanism of transcription initiation by the yeast mitochondrial RNA polymerase." Biochim Biophys Acta.</p></ul> | <ul><p>[5] Deshpande, A. P. and S. S. Patel 2012. "Mechanism of transcription initiation by the yeast mitochondrial RNA polymerase." Biochim Biophys Acta.</p></ul> | ||
<ul><p>[6] Modelling of The Redoxilator by 2009 DTU-DENMARK iGEM team.</p></ul> | <ul><p>[6] Modelling of The Redoxilator by 2009 DTU-DENMARK iGEM team.</p></ul> | ||
| - | <div> | + | </div> |
</div> | </div> | ||
{{:Team:Shenzhen/Temp/gallery.htm}} | {{:Team:Shenzhen/Temp/gallery.htm}} | ||
Latest revision as of 01:54, 27 September 2012
 "
"


