Team:Shenzhen/Result/YAO.Factory
From 2012.igem.org
-
S
BioBricks
- Summary
- YAO.Genome
- YAO.Channel
- YAO.Sensor
- YAO.Suicider
-
p
Notebook
- Team History
- YAO.Genome
- YAO.Channel
- YAO.Sensor
- YAO.Suicider
- YAO.Factory
-
e
Practices


Contents |
Introduction
In order to estimate to what extent our YAO system has improved the ability of producing IPP, FPP and GPP in the engineered cell, we construct a model for biochemical reactions of mevalonate pathway in yeast.
At first we plan to model the reactions at equilibrium states. However, as Gibbs free energy for most of the reactions in mevalonate pathway are unavailable, we decide to model them by Michealis-Menton kinetics at the beginning of the reactions when no products have been accumulated.
Simulation
For acetoacetyl-CoA thiolase, the reaction is
The rate expression is defined as
Table 1. Parameters for acetoacetyl-CoA thiolase
| Parameter | Defination |
Value(mM) |
Organism |
KmA |
binding constant of AcCoA |
0.33 |
Zoogloea ramigera |
KiA |
Inhibit constant of AcCoA |
0.0014 |
Rattus norvegicus |
For 3-hydroxy-3-methylglutaryl coenzyme A synthase, the reaction is
The rate expression is defined as
Table 2. Parameters for 3-hydroxy-3-methylglutaryl coenzyme A synthase
| Parameter | Definition |
Value(mM) |
Organism |
KmA(mM) |
binding constant for AcCoA |
0.014 |
Saccharomyces cerevisiae |
KmB(mM) |
binding constant for AcacCoA |
0.003 |
Saccharomyces cerevisiae |
KiB(mM) |
inhibit constant for AcacCoA |
0.008 |
Saccharomyces cerevisiae |
KiC1(mM) |
inhibit constant for CoA on AcCoA |
0.038 |
Saccharomyces cerevisiae |
KiC2(mM) |
Inhibit constant for CoA on AcacCoA |
0.06 |
Saccharomyces cerevisiae |
For HMG-CoA Reductase, the reaction is
The rate expression is defined as
Table 3. Parameters for HMG-CoA Reductase
| Parameter | Definition |
Value(mM) |
Organism |
KmA |
binding constant for HMG-CoA |
0.045 |
Sulfolobus solfataricus |
KmB |
Binding constant for NADPH |
0.023 |
Sulfolobus solfataricus |
For mevalonate kinase, the reference reaction is
The rate expression is defined as
Table 4. Parameters for mevalonate kinase
| Parameter | Definition |
Value(mM) |
Organism |
KmA |
binding constant for MVA |
0.0408 |
Homo sapiens |
KmB |
binding constant for ATP |
7.4 |
Saccharomyces cerevisiae |
KiADP |
inhibit constant for ADP |
2.7 |
Enterococcus faecalis |
For phosphomevalonate kinase, the reference reaction is
The rate expression is defined as
Table 5. Parameters for phosphomevalonate kinase
| Parameter | Definition |
Value(mM) |
Organism |
KmA |
binding constant for MVA-5P |
0.034 |
Homo sapiens |
KmB |
binding constant for ATP |
0.107 |
Homo sapiens |
KiB |
inhibit constant for ATP |
0.137 |
Streptococcus pneumoniae |
KiADP |
Inhibit constant for ADP |
0.41 |
Streptococcus pneumoniae |
For mevalonate pyrophosphate decarboxylase, the reference reaction is
The rate expression is defined as
Table 6. Parameters of mevalonate pyrophosphate decarboxylase
| Parameter | Definition |
Value(mM) |
Organism |
KmA |
binding constant for MVA-5PP |
0.123 |
Saccharomyces cerevisiae |
KmB |
binding constant for ATP |
0.061 |
Saccharomyces cerevisiae |
For isopentenyl diphosphate:dimethylallyl diphosphate isomerase, the reaction is
The rate expression is defined as
Table 7.
| Parameter | Definition | Value(mM) | Organism |
| Km | Binding constant for IPP | 0.035 | Saccharomyces cerevisiae |
For farnesyl diphosphate synthase, the first reaction is:
The rate expression is defined as
The second reaction is
The rate expression is
Table 7. Parameters for the ERG20
| Parameter | Definition | Value(mM) | Organism |
| KmA | binding constant for DMA-PP | 0.009 | Abies grandis |
| KmB | binding constant for I-PP | 0.0018 | Abies grandis |
| KmC | binding constant for GPP | 0.0153 | Abies grandis |
Table 8. The turnover rate for each enzyme
| Enzyme | Substrate |
Turnover rate(1/s) |
Organism |
acetoacetyl-CoA thiolase |
Acetyl-CoA |
2.1 |
Zoogloea ramigera |
3-hydroxy-3-methylglutaryl coenzyme A synthase |
Acetyl-CoA |
0.0667 |
Gallus gallus |
hydroxymethylglutaryl-CoA reductase |
hydroxymethylglutaryl-CoA |
0.023 |
Rattus norvegicus |
mevalonate kinase |
(R)-mevalonate |
21.9 |
Rattus norvegicus |
phosphomevalonate kinase |
phosphomevalonate |
10.2 |
Sus scrofa |
mevalonate pyrophosphate decarboxylase |
5-diphosphomevalonate |
4.9 |
Saccharomyces cerevisiae |
isopentenyl diphosphate:dimethylallyl diphosphate isomerase |
isopentenyl diphosphate |
0.2 |
Sulfolobus shibatae |
farnesyl diphosphate synthase |
isopentenyl diphosphate |
0.49 |
Mycobacterium tuberculosis H37Rv |
farnesyl diphosphate synthase |
geranyl diphosphate |
0.2 |
Mycobacterium tuberculosis H37Rv |
We set the concentration of Actyl-CoA to 1000μM, and consider it as a constant. For simplicity, we assume the concentration of Actyl-CoA is the same in YAO and cytoplasm. The concentration of ATP, ADP and NADPH is set to 1500μM, 1500μM and 100μM respectively and considered as constants. Concentrations of all other metabolite are set to 0 in the beginning.
Result
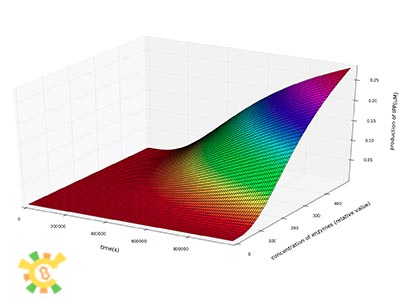
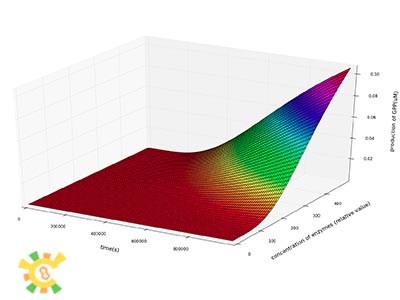
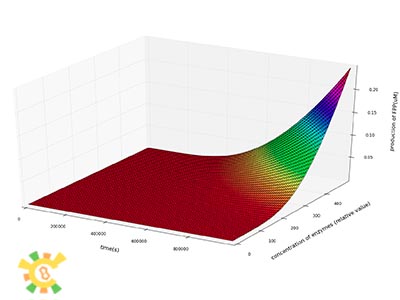
Our Yao clustered the enzymes in a small space, so that the concentration of enzymes in YAO will be higher than in cytoplasm. We assume that the volume of YAO is 1/10000 of that of cell, and a cell often contains 20 YAOs. Thus the concentrations of enzymes in YAO should be 500 times of that in cytoplasm. However, the transported rate of enzymes with signal peptides should be considered. We let it range from 0.002 to 1, thus ratio of concentrations of enzymes between YAO and cytoplasm range from 0 to 500.
We then plot the concentration of IPP, GPP and FPP as a function of time at different concentration of enzymes.
We can see from the plot that the production of IPP, GPP and FPP in a certain period of time after the beginning of the reactions increase dramatically as the concentrations of enzymes increase.
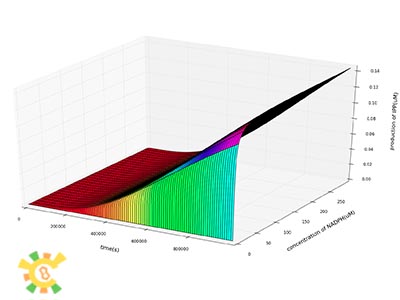
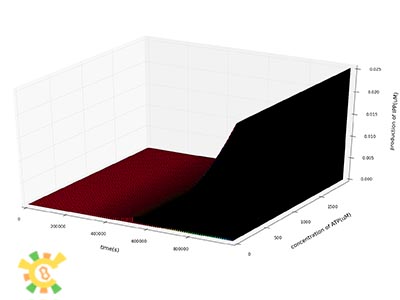
As the concentrations of products are increasing, need for ATP and NADPH also increase. The concentrations of NADPH and ATP will limit the produce of IPP, GPP and FPP. We then let the constant concentrations of NADPH and ATP range from 0 to maximum to see their affects on production.
Our results show that concentrations of both ATP and NADPH do not have significant affects on production at the beginning of the reactions.
References
[1] Ro, D.K., et al., Production of the antimalarial drug precursor artemisinic acid in engineered yeast. Nature, 2006. 440(7086): p. 940-3.
[2] Middleton, B., The kinetic mechanism and properties of the cytoplasmic acetoacetyl-coenzyme A thiolase from rat liver. Biochem J, 1974. 139(1): p. 109-21.
[3] Tanzawa, K. and A. Endo, Kinetic analysis of the reaction catalyzed by rat-liver 3-hydroxy-3-methylglutaryl-coenzyme-A reductase using two specific inhibitors. Eur J Biochem, 1979. 98(1): p. 195-201.
[4]Middleton, B., The kinetic mechanism of 3-hydroxy-3-methylglutaryl-coenzyme A synthase from baker's yeast. Biochem J, 1972. 126(1): p. 35-47.
[5] Voynova, N.E., S.E. Rios, and H.M. Miziorko, Staphylococcus aureus mevalonate kinase: isolation and characterization of an enzyme of the isoprenoid biosynthetic pathway. J Bacteriol, 2004. 186(1): p. 61-7.
[6] Scheer, Maurice. BRENDA. 2011. http://www.brenda-enzymes.org/
 "
"


