Team:British Columbia/ConsortiaTunability
From 2012.igem.org
| (3 intermediate revisions not shown) | |||
| Line 22: | Line 22: | ||
</div><div id=note></html> | </div><div id=note></html> | ||
| + | [[File:Joe1Team_british_columbia_2012.png|centre|400x500px]] | ||
| Line 33: | Line 34: | ||
- [[User:jacobtoth|Jacob Toth]] | - [[User:jacobtoth|Jacob Toth]] | ||
| + | |||
'''July 19''' | '''July 19''' | ||
| Line 61: | Line 63: | ||
Analyzed the data, and found out that the growth rate and the amino acid (Tyr) concentration has a correlation as follows: | Analyzed the data, and found out that the growth rate and the amino acid (Tyr) concentration has a correlation as follows: | ||
| - | [[File:growth-rate at different try concentration_british_columbia_2012.png| | + | [[File:growth-rate at different try concentration_british_columbia_2012.png|650px]] |
*Figure 4. cell growth-rate at different Tyr concentrations | *Figure 4. cell growth-rate at different Tyr concentrations | ||
| - | [[File:growth-rate at different tyr concentration log scale_british_columbia_2012.png| | + | [[File:growth-rate at different tyr concentration log scale_british_columbia_2012.png|650px]] |
*Figure 5. Log scale of cell growth-rate at different Tyr concentrations | *Figure 5. Log scale of cell growth-rate at different Tyr concentrations | ||
| Line 77: | Line 79: | ||
The growth rate and the amino acids (Met and Trp) concentration has a correlation as follows: | The growth rate and the amino acids (Met and Trp) concentration has a correlation as follows: | ||
| - | [[File:growth-rate at different met concentration_british_columbia_2012.png| | + | [[File:growth-rate at different met concentration_british_columbia_2012.png|650px]] |
*Figure 6. cell growth-rate at different Met concentrations | *Figure 6. cell growth-rate at different Met concentrations | ||
| - | [[File:growth-rate at different Met concentration log scale_british_columbia_2012.png| | + | [[File:growth-rate at different Met concentration log scale_british_columbia_2012.png|650px]] |
*Figure 7. Log scale of cell growth-rate at different Met concentrations | *Figure 7. Log scale of cell growth-rate at different Met concentrations | ||
| - | [[File:growth-rate at different trp concentration_british_columbia_2012.png| | + | [[File:growth-rate at different trp concentration_british_columbia_2012.png|650px]] |
*Figure 8. cell growth-rate at different Trp concentrations | *Figure 8. cell growth-rate at different Trp concentrations | ||
| - | [[File:growth-rate at different trp concentration log scale_british_columbia_2012.png| | + | [[File:growth-rate at different trp concentration log scale_british_columbia_2012.png|650px]] |
*Figure 9. Log scale of cell growth-rate at different Trp concentrations | *Figure 9. Log scale of cell growth-rate at different Trp concentrations | ||
| Line 102: | Line 104: | ||
Eventually arrived at the following graphs of growth rates observations, when n=3 | Eventually arrived at the following graphs of growth rates observations, when n=3 | ||
| - | [[file: GrowthRatesAA_university_of_british_columbia.png| | + | [[file: GrowthRatesAA_university_of_british_columbia.png|650px]] |
| - | [[file: GrowthRatesAA_LOG_university_of_british_columbia.png| | + | [[file: GrowthRatesAA_LOG_university_of_british_columbia.png|650px]] |
From these graphs, the maximum growth rate, and Ks values that are used in Monod Kinetics can be determined. | From these graphs, the maximum growth rate, and Ks values that are used in Monod Kinetics can be determined. | ||
| Line 167: | Line 169: | ||
- [[User:jacobtoth|Jacob Toth]] | - [[User:jacobtoth|Jacob Toth]] | ||
| - | + | <div style="text-align: center;"><h2>[https://2012.igem.org/Team:British_Columbia/ConsortiaTunability Back to top]</h2></div> | |
| - | + | ||
| - | + | ||
| - | + | ||
| - | [ | + | |
| - | + | ||
| - | + | ||
| - | + | ||
| - | + | ||
| - | + | ||
| - | + | ||
| - | + | ||
| - | + | ||
| - | + | ||
| - | + | ||
| - | + | ||
| - | + | ||
| - | + | ||
| - | + | ||
| - | + | ||
| - | + | ||
| - | + | ||
| - | + | ||
| - | + | ||
| - | + | ||
| - | + | ||
| - | + | ||
| - | + | ||
| - | + | ||
| - | + | ||
| - | + | ||
| - | + | ||
| - | + | ||
| - | + | ||
| - | + | ||
| - | + | ||
| - | + | ||
| - | + | ||
| - | + | ||
| - | + | ||
| - | + | ||
| - | + | ||
| - | + | ||
| - | + | ||
Latest revision as of 03:35, 4 October 2012

July 15
An attempt at doing an experiment to calibrate the fluorescent proteins for the plate reader (looking for quenching, linear relationship between OD and fluorescence, etc) was done on Sunday, but as it turns out, we had the wrong promoter for a fluorescent protein, and the wrong antibiotic resistance for one of the other proteins. Given this, we gave up, and decided to do it later with the proper strains.
Several new combinations of fluorescent genes, antibiotic resistances, and Keio strains were made. We used the wrong ones last weekend, but now, we are going to test TyrA- +GFP, TrpA- +RFP, MetA- +YFP, and also wildtype with the fluorescent genes. Recently, we switched backbones for the 13M RFP to Psb1C3, for we do not know the provenance of our current psb1C3 with rfp (we suspect it might be on the lac operon, as per the registry guidelines), and we also put the GFP on the psb1C3 instead of a kanamycin resistant plasmid, because we were transforming into kanamycin resistant auxotrophs.
Just for qualitative fun, we are trying to grow the ArgC- and the ArgE- together in M9 to see if anything results, with negative controls for both. We also tried growing a wildtype with a TrpB auxotroph with rfp to look for qualitative red fluorescence. The fluorescence calibration experiment must be done before we can do these sorts of things quantitatively.
July 19
We tested the growth rate of our 3 main auxotrophs in various (log scale from 100 pM to 10 mM) concentrations of the amino acids to do monod kinetics, which will allow us to predict growth rates at various concentrations of the amino acids.
July 20
Obtained the data from the 3 main auxotrophs growth rate dependences of amino acid concentration.
Obtained the reading of fluorescence-population correlation plate.
- Ruichen
July 22
Joe did 5 more fluorescence-population correlation plate, though found out that the yfp is not expressing correctly.
- Ruichen
July 23
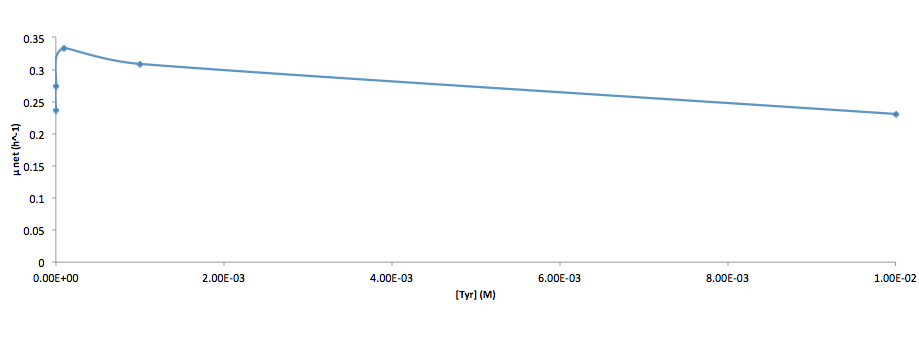
Analyzed the data, and found out that the growth rate and the amino acid (Tyr) concentration has a correlation as follows:
- Figure 4. cell growth-rate at different Tyr concentrations
- Figure 5. Log scale of cell growth-rate at different Tyr concentrations
It was found that the cells depleted the nutrient quickly at low Tyr concentration, and for future experiments it is suggested to use lower initial cell concentrations to extend the time of its exponential growth phase. Also, the wild type has almost the exact growth rate as the autotroph when the the Try concentration is exceptionally high (0.01 M).
- Ruichen
July 26
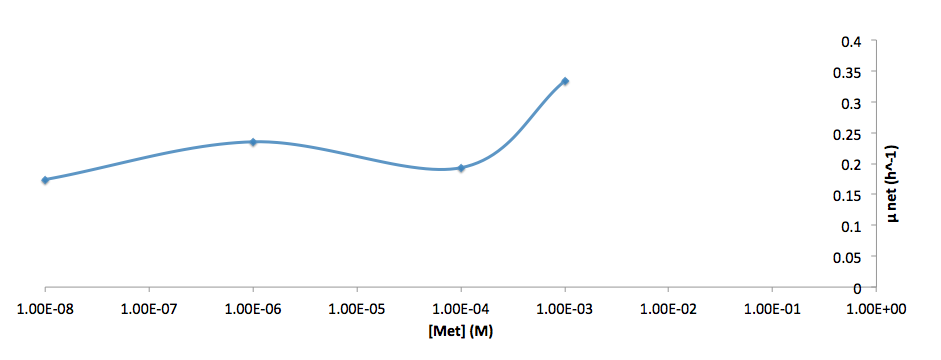
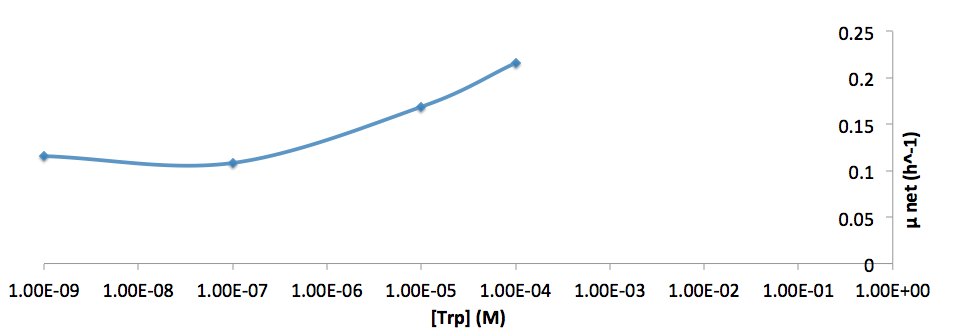
The growth rate and the amino acids (Met and Trp) concentration has a correlation as follows:
- Figure 6. cell growth-rate at different Met concentrations
- Figure 7. Log scale of cell growth-rate at different Met concentrations
- Figure 8. cell growth-rate at different Trp concentrations
- Figure 9. Log scale of cell growth-rate at different Trp concentrations
- Ruichen
August 3rd
Started to work on the data obtained on July 28th plate readings.
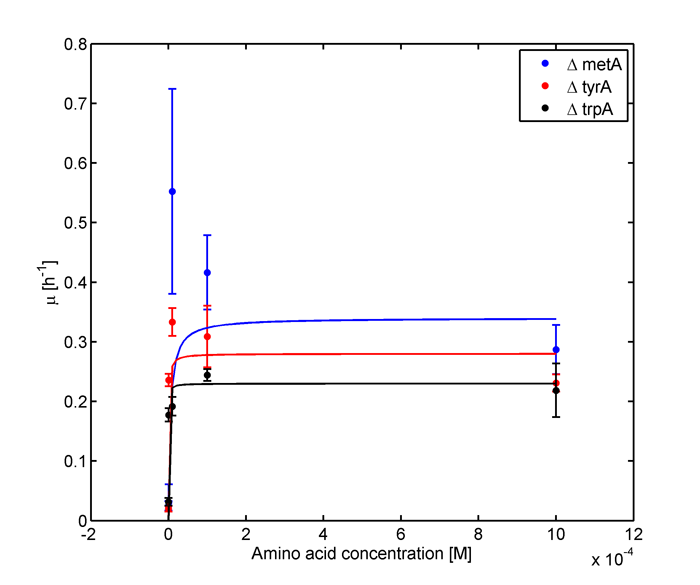
Eventually arrived at the following graphs of growth rates observations, when n=3
From these graphs, the maximum growth rate, and Ks values that are used in Monod Kinetics can be determined.
- Ruichen
August 12
With a set of the primers that arrived, we were able to PCR amplify certain parts that will be able to be Gibson assembled. On the plasmid that has RFP (a modified BBa_K093012, placed on the Psb1C3), we wanted to put arabinose inducible MetA or arabinose inducible TyrA. However, one of the primers necessary to amplify the plasmid itself, which would be necessary to incorporate the proper homologous sequence for Gibson assembly, did not arrive. Additionally, the PCR to amplify the MetA gene did not work the first time, but has been repeated. The arabinose promoter was successfully PCR'd out of the E. coli genome for both cases. For the plasmid with YFP, the BBa_I13973, we wanted to put rhamnose inducible TrpA or TyrA after the YFP gene. We received all the primers necessary for this, but the PCR for the plasmid backbone gave several bands and was repeated at a higher annealing temperature. The results are not yet known. The rhamnose promoter was successfully PCR'd out of the genome, as was the TrpA gene. However, we lacked one of the promoters for the TyrA gene. Since there were several bands for the YFP plasmid, we did not do a Gibson assembly. Additionally, it is possible that the primers were designed for the pSB1C3 rather than the pSB1A2, but that should have little effect due to the similarities on the ends of the two plasmids. A simple digest and ligation should be able to move the part from the one plasmid to the other. We also wanted to put a IPTG inducible (BBa_K091111, LacIQ) metA gene after a GFP. The PCR for the MetA gene and the GFP plasmid were successful (although the GFP plasmid appeared as a fairly weak band on the gel), but the PCR for the LacIQ promoter failed. The initial DNA for this PCR was added directly from the parts distribution kit, and as such the composition and concentration of exactly what was added was unknown. The PCR was repeated as a cPCR on the genome, so as to at least get a usable part with the right overhang.
In an effort to see how much amino acid each type of cell in the co-culture will produce, we have been harvesting supernatants of our normal cultures as per the protocol in Kerner et al. Once we have supernatants of the cultures at various ODs, we are going to grow the auxotrophs in this supernatant, and then look at the growth rate and final OD.
Joe has found inconsistent results with his fluorescent proteins on the various promoters, and we have plans to standardize the promoter and rbs for the fluorescent proteins that will be used. Additionally, there is some overlap between YFP and GFP that is proving difficult to account for, so we are going to try to switch one to either BFP or CFP.
We also wanted to grow three of the consortia together to see what sort of final OD they reach, and have been monitoring it sporadically for the past 24 hours.
August 13
Having harvested the supernatant of the various cultures at various ODs, we filter sterilized it with a 0.2 uM filter to remove any cells that may have still remained. Now that we have the sterilized supernatant, we are going to follow the protocol in Kerner et al 2012, and add 1/5 5X M9 media, and grow different auxotrophic cultures, noting the OD and growth rate. From this, we will try to calculate, or at least approximate, the amino acid export rate of the cells.
The data that we collected regarding the growth curves of the auxotrophs and the mixture are very different from what the plate reader previously showed. We think this may be because of a lack of correction for path length by the plate reader, but aren't entirely sure.
August 15
After two days of shaking at 37° in 1 mM IPTG, the supposed IPTG inducible metA constructs in the metA auxotrophs were unable to grow.
August 16
The supposed metA constructs still appears unable to complement a metA knockout. It has been suggested that the concentration of metA may have been too high, and this would have led to a severe detriment to the cell, and it has also been suggested that the IPTG, being a rather old stock, was no longer good. Another step that we are going to take is to see if the expression of the construct can be seen on an sds page under induction.
Concnerning the other constructs, the PCR for the YFP has yet to give us a single solid band, so we are trying to move it into the psb1c3 plasmid in case there are some plasmid specific sequences that were giving us poor results. The ligation and transformation has been done, and we are waiting for colonies. The PCR products necessary for the gibson assembly of the GFP-IPTG-TrpA gene were also all available, and that gibson assembly has been done. However, due to the failure of several gels, there was very little product left, and PCR purification would likely result in unusuable quantities, so we tried a Gibson assembly with the straight PCR product.
Another PCR was done to generate some of the other parts required for assembly of other parts. The PCR for the arabinose promoter (using a new primer) has not yet resulted in a band.
There are two distinct bands on the RFP PCR, one at the correct length, the other much lower. Several other products were also generated today, but there are still two essential parts, that of YFP and that of the new arabinose promoter, which have not yet been successfully PCR'd.
August 17
The Gibson assembled parts using unpurified PCR products did not yield any colonies when transformed.
The plans for the metA construct induction were further discussed. Overnight colonies will be made of the construct and a negative control, then they will be diluted in 1 in 100 LB, allowed to grow to 0.4 OD, induced with 0.1 mM new IPTG, and harvested at a certain OD following this, then run on an SDS PAGE. This will test to see if the IPTG really would stimulate the production of the metA gene. The negative controls were not in place yet. Four potential constructs have been grown up overnight, and are labeled 1-4 on tape in the right section of the left shaker.
The data from the supernatant growth experiment was partially analyzed. It appears that 14 hours was not sufficient to reach a final OD in some cases, but there was growth in many of the wells. It was also suggested that we could just test the relevant amino acid concentration using HPLC.
From our previous experiments concerning the consortia syntrophy, we saw that three cultures inoculated straight from LB into minimal M9 led to a mixed culture OD that reached about 1.3, similar to 0.1 mM (saturating) Met for metA-, and 0.1 mM Trp for TrpA-. We suspect that this is due to syntrophy, but have yet to do the relevant tests to see if 1 in 100 LB actually does supply significant amounts of amino acids.
 "
"

