Team:Cambridge/Week 3/Lab book
From 2012.igem.org
| Home | Team | Official Team Profile | Project | Parts Submitted to the Registry | Modeling | Notebook | Safety | Attributions | Sponsors |
|---|
| Diary | Lab book |
|---|
Contents |
Monday
Making bacillus competent
- Bacillus salts *10 made up and autoclaved.
- Medium A base *10 made up (glucose will be added tomorrow)
- bacillus strain 168 streaked out and grown on plate overnight.
Tuesday
Making bacillus competent
- Filtered glucose added to sterile Medium A base.
- Sterile aliquots of salts and medium apportioned and put in fridge (10*50ml each)
Wednesday
Making bacillus competent
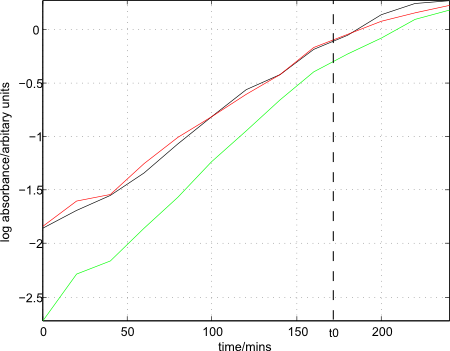
- Colonies of strain 168 removed from plate and added to three separate conical flasks, each with 48ml of Medium A inside. OD650 readings taken until enough cells were added such that absorbance was between 0.1 and 0.2.
- Flasks placed inside a shaking incubator (200rpm) and samples taken every 20mins until growth had leveled off.
- Growth curves, as well as t0 (at 170mins) plotted below:
- 90 mins after t0 (at 260 mins), cells removed from shaking incubator.
- 0.45ml of Medium B pre-warmed in Eppendorf tubes.
- 20 individual samples of 0.05ml taken from each growth flask and added to Eppendorfs.
- Eppendorfs placed back in shaking incubator for 60 mins with lids off.
- Eppendorfs centrifuged at ~13000 rpm for 10 mins, supernatant removed.
- 60% glycerol added (0.5ml/tube) and tubes vortexed.
- All 60 tubes now frozen at -80 °C.
Thursday
Test transformation of frozen bacillus stocks
- Two samples of bacillus defrosted from different batches.
Friday
Transformation of bacillus and e.coli with lux genes from 2010
Testing of the spectral properties of filters
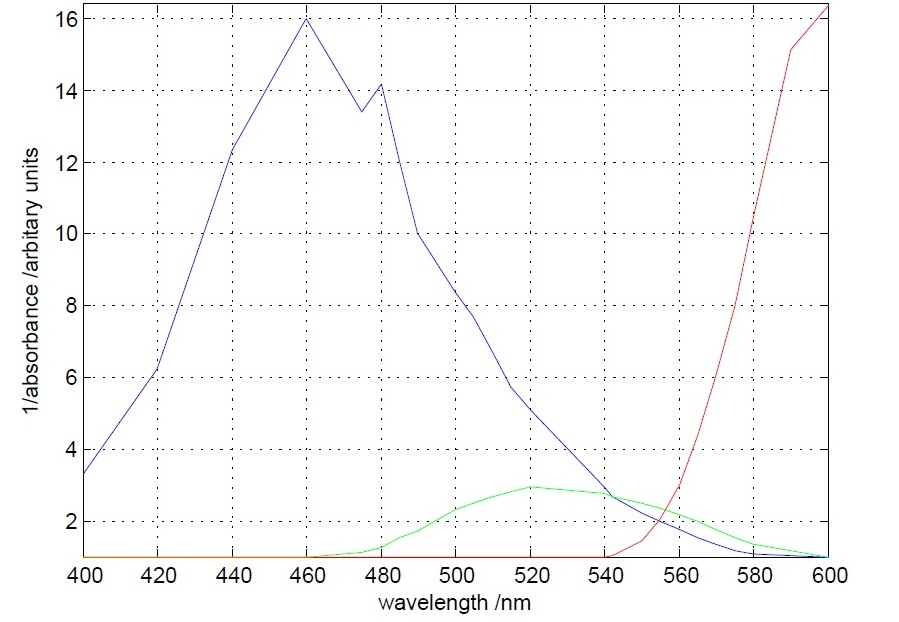
- Blue , Green and Red filters were tested in different wavelengths (400 nm - 600 nm) in a spectrophotometer.
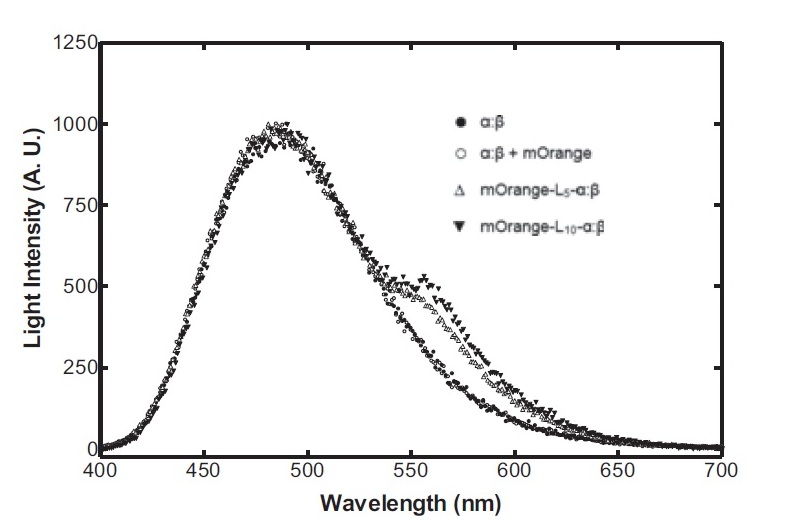
- Excellent absorbance/emmitance results given by the blue and red filters near 580nm and 490nm respectively. 580nm is the wavelength where intensity of light is to be measured to identify the presence of mOrange. 490nm is the wavelength where maximum light intensity is expected with or without the presence of mOrange.
 "
"


