Team:BYUProvo/Project
From 2012.igem.org
Johnwshumway (Talk | contribs) (→Thermosensor Library) |
Johnwshumway (Talk | contribs) (→Thermosensor Library) |
||
| Line 71: | Line 71: | ||
[[File:PR3.png|maxwidth=400|right]] | [[File:PR3.png|maxwidth=400|right]] | ||
| + | |||
| + | |||
[[File:PR.4.png|maxwidth=400|left]] | [[File:PR.4.png|maxwidth=400|left]] | ||
Revision as of 21:20, 3 October 2012

|

|

|
| Home | Team | Team Profile | Project | Parts | Modeling |
|
Safety | Outreach | Collaboration | Attributions |
Contents |
Abstract
E. Colonoscopy
INSERT ABSTRACT HERE
Project Details
PUT PICTURE OF THE PROJECT/CIRCUIT HERE
The Experiments
We generated a library of thermosensors via TAQ random mutagenesis. Colonies were plated at 30'C and then shifted to 37'C to monitor the reporter gene expression, LacZ. Colonies that appeared to express LacZ differently from the wildtype thermosensor were picked, patched and retested for their phenotype. From over 200,000 colonies screened, we identified 11 thermosensors that produced a more robust output when shifted from 35'C to 37'C.
PUT PLATE PICTURES FROM JORDAN HERE
PUT LACTATE SENSOR HERE
PUT CRE HERE
Results
We successfully completed 2 main projects in the time we spent from January to September.
- First we created a circuit within E. Coli that senses 3 different products that cancer cells produce in abundance: reactive oxygen species (ROS), increased temperatures, and lactate.
- Second, we created a library of thermosensors react to different temperatures along different time steps.
Circuit
Our circuit has been constructed and is currently under testing.
Thermosensor Library
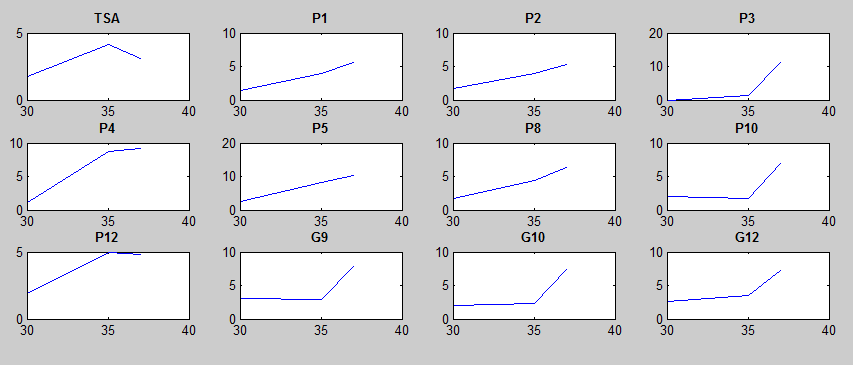
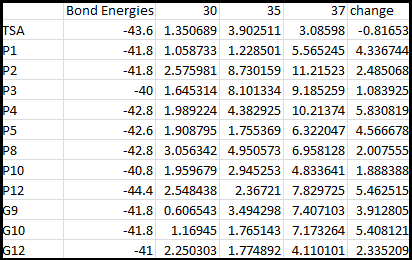
After doing multiple genetic screens using error-prone polymerase, we identified, out of thousands of different colonies, 11 mutant thermosensors that function in different, more useful ways than the wild type thermosensor (TSA). TSA is a thermosensor that slowly unfolds when the temperature changes from 30°C to 35°C. The 11 thermosensors we chose are unique because they unfold at a higher, narrower temperature range. Most of them only responded at a temperature somewhere in between 35°C and 37°C. Below we present data obtained by doing beta-galactosidase assays, which reports, in Miller units, the enzyme activity of each thermosensor at 3 different temperatures: 30°C, 35°C, and 37°C.
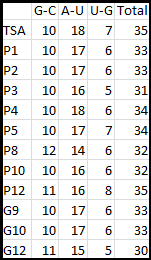
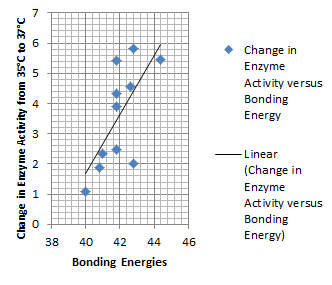
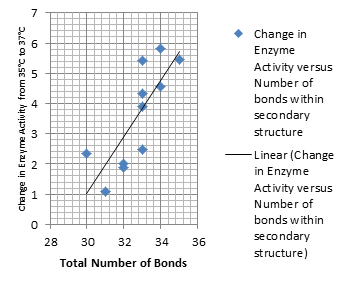
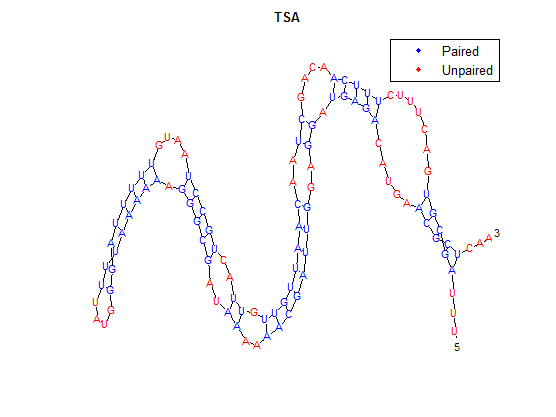
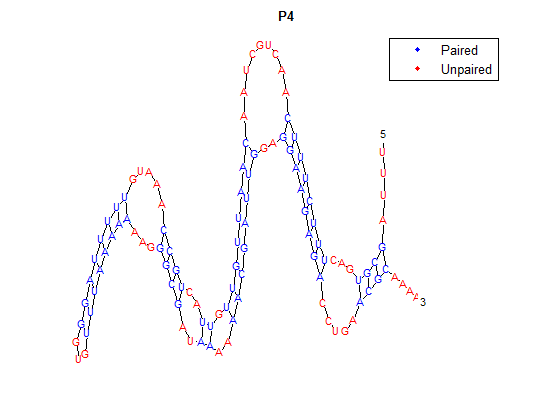
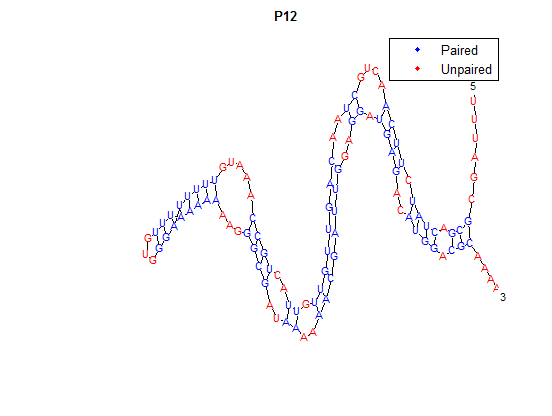
It is interesting to note the change in enzyme activity for many thermosensors from 35°C to 37°C. These thermosensors are particularly useful for our project, because this range is close to the physiological temperature range for mutating cells. Higher temperatures and smaller temperature ranges in which the thermosensor unfolds indicate a better quality thermosensor. We determined the secondary structure of each thermosensor using Matlab (we also compared this with the online program RNAfold, seeing almost identical results). A few of the secondary structures are shown below. We used these secondary structures to determine the total number of bonds within each RNA hairpin. Using text values, G-C = -2.0 kcal/mol, U-A = -1.0 kcal/mol, and U-G = -0.8 kcal/mol, we calculated the bonding energies. We then compared the bonding energies to the change in enzyme activity and to the total number of bonds. In both comparisons, we identified the data point representing the wild type thermosensor as an outlier (G-test) and removed it. Performing a linear regression on the data comparing bonding energies to enzyme activity, we found a line with slope m = 0.969 and intercept b = 0.343. The r^2 value for this dataset was 0.4703. We performed a similar regression on the data comparing Total number of bonds to enzyme activity, finding a line with slope m = 0.940 and intercept b = 0.236. The r^2 value for this dataset was 0.639. Thus, for our thermosensor library, to determine which species would have a large change in enzyme activity, another a measure of quality, it is more useful to look at the total number of bonds than to look at the individual G-C, A-U and G-U bond content which determine the bonding energy.
 "
"
