Team:BYUProvo/Project
From 2012.igem.org
Johnwshumway (Talk | contribs) (→Thermosensor Library) |
(→Circuit) |
||
| Line 65: | Line 65: | ||
== Circuit == | == Circuit == | ||
| + | |||
| + | Our circuit has been constructed and is currently under testing. | ||
== Thermosensor Library == | == Thermosensor Library == | ||
Revision as of 19:43, 3 October 2012

|

|

|
| Home | Team | Team Profile | Project | Parts | Modeling |
|
Safety | Outreach | Collaboration | Attributions |
Contents |
Abstract
E. Colonoscopy
Colon cancer is the third leading cause of cancer death in the US. Colon cancer exhibits aggressive metastasis; as a result, early detection and treatment are necessary for successful treatment. Compared to normal cells, colon cancer cells give off excess heat, reactive oxygen species (ROS), and lactate. Last year, BYU IGEM demonstrated that heat and ROS can be detected by genetically engineered E. coli. Thermosensitivity was achieved by manipulating a temperature dependent RNA hairpin loop derived from Listeria to melt within a difference of two degrees. This year we plan to develop thermosensors that can identify a narrower temperature range, especially temperatures around physiological average. We will do this by random mutation of our current thermosensors, as well as using mathematical modelling to predict how altering the DNA sequence will change the melting temperature. Also, we are currently developing DNA toe-holds which we hope will narrow the melting range even further. To our knowledge, this process has never been tested before. The lactate sensor will be achieved by mutating periplasmic Glucose Binding Protein (GBP) to bind lactate. Upon binding of lactate, a cascade will result, activating the OmpC promoter and producing GFP. Through the amount of GFP produced, we can use statistical analysis to calculate the concentration of lactate in colon cancer cells. We plan to incorporate the heat, ROS and lactate sensors into a molecular AND gate which would create a reporter only if all three elements are present. By addition of a Cre-Lox system, we will ensure that reporter continues to be produced once the AND gate is activated. In theory, this process will be able to accurately and specifically detect colon cancer cells.
Project Details
Part 2
The Experiments
Part 3
Results
We successfully completed 2 main projects in the time we spent from January to September.
- First we created a circuit within E. Coli that senses 3 different products that cancer cells produce in abundance: reactive oxygen species (ROS), increased temperatures, and lactate.
- Second, we created a library of thermosensors react to different temperatures along different time steps.
Circuit
Our circuit has been constructed and is currently under testing.
Thermosensor Library
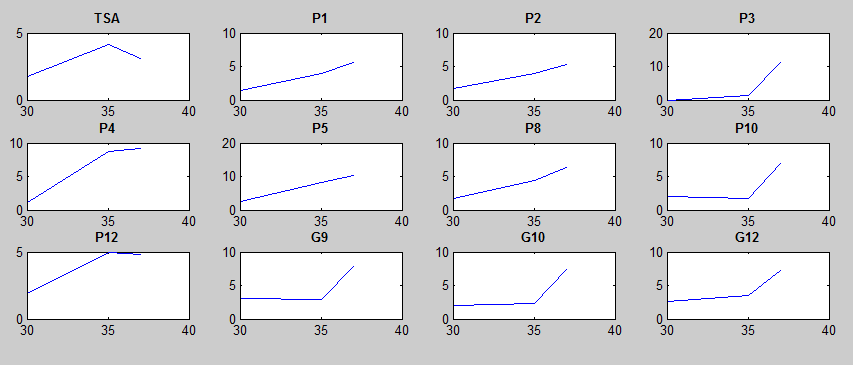
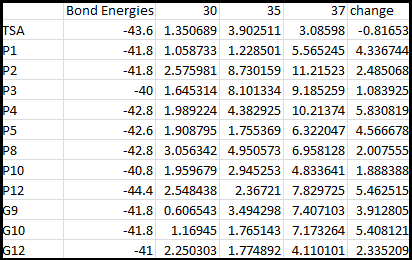
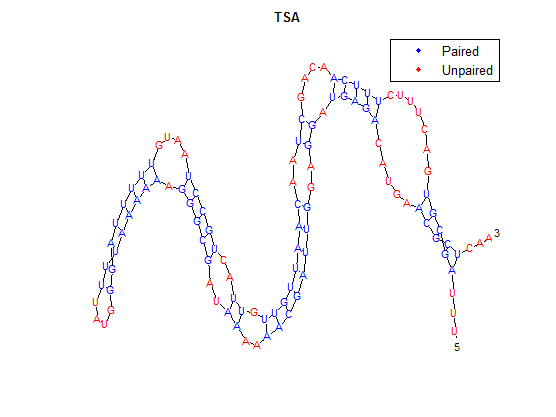
After doing multiple genetic screens using error-prone polymerase, we identified, out of thousands of different colonies, 11 mutant thermosensors that function in different, more useful ways than the wild type thermosensor (TSA). TSA is a thermosensor that slowly unfolds when the temperature changes from 30°C to 35°C. The 11 thermosensors we chose are unique because they unfold at a higher, narrower temperature range. Most of them only responded at a temperature somewhere in between 35°C and 37°C. Below we present data obtained by doing beta-galactosidase assays, which reports, in Miller units, the enzyme activity of each thermosensor at 3 different temperatures: 30°C, 35°C, and 37°C.
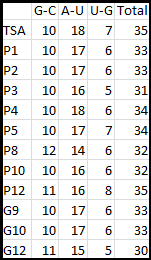
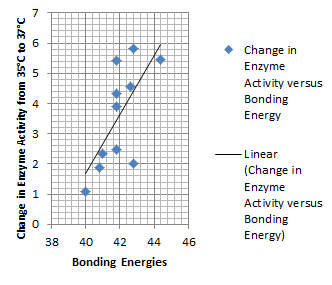
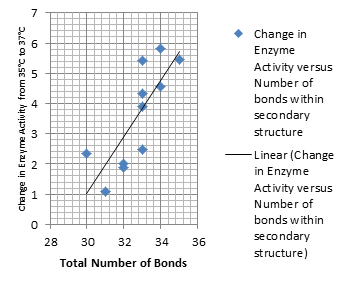
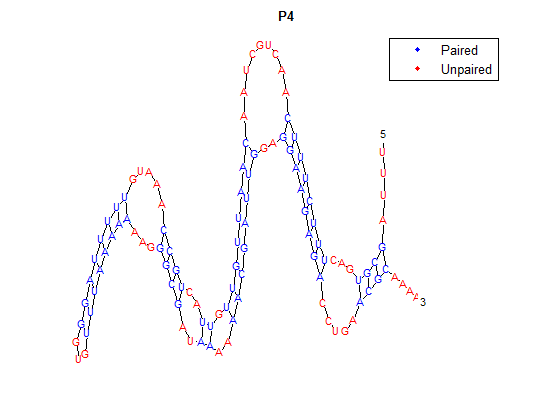
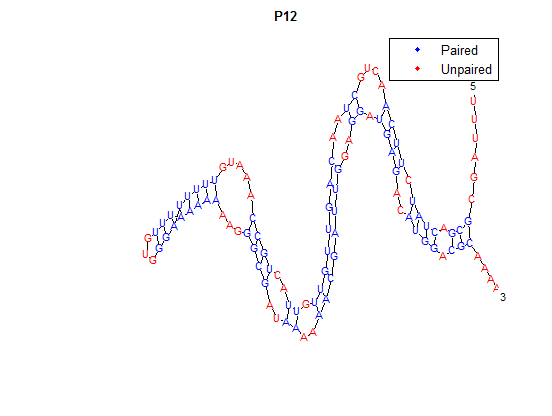
It is interesting to note the change in enzyme activity for many thermosensors from 35°C to 37°C. These thermosensors are particularly useful for our project, because this range is close to the physiological temperature range for mutating cells. Higher temperatures and smaller temperature ranges in which the thermosensor unfolds indicate a better quality thermosensor. We determined the secondary structure of each thermosensor using Matlab (we also compared this with the online program RNAfold, seeing almost identical results). A few of the secondary structures are shown below. We used these secondary structures to determine the total number of bonds within each RNA hairpin. Using text values, G-C = -2.0 kcal/mol, U-A = -1.0 kcal/mol, and U-G = -0.8 kcal/mol, we calculated the bonding energies. We then compared the bonding energies to the change in enzyme activity and to the total number of bonds. Performing a linear regression on the data comparing bonding energies to enzyme activity, we found a line with slope m = 0.969 and intercept b = 0.343. The r^2 value for this dataset was 0.4703. We performed a similar regression on the data comparing Total number of bonds to enzyme activity, finding a line with slope m = 0.940 and intercept b = 0.236. The r^2 value for this dataset was 0.639. Thus, for our thermosensor library, to determine which species would have a large change in enzyme activity, another a measure of quality, it is more useful to look at the total number of bonds than to look at the individual G-C, A-U and G-U bond content which determine the bonding energy.
 "
"
