 "
"
Team:MIT/Sensing
From 2012.igem.org


Overview
We designed, modeled and tested an mRNA sensor that interfaces with RNA-based strand displacement circuitry.
Design
We imposed the following criteria on our mRNA sensor design:- orthogonality
- easy integration with strand displacement circuits
- ability to amplify a signal
- ease of sensor generation
From our design principles, we can build a modular sensor for any mRNA. For proof of concept, we sensed eBFP2 (BBa_K779300). We investigated the mRNA sequence and chose a region that contains both a toehold and sensing domain, which have complementary regions in our sensor. This enables it to interface with its own “gate + output” complex utilizing the same method of toehold mediated strand displacement.
We also incorporated a “fuel” strand, which displaces the gate from the mRNA after it has been sense. This effectively resets the mRNA strand to be sensed again, allowing for signal from one strand of mRNA to be amplified and drive the reaction very definitely into the “mRNA present” concentration range.

However, our method needs to account for the secondary structure of mRNA. Because the strength of base pairing differs from region to region, some places are more accessible to strand displacement than others (Kertesz et al. 2007).

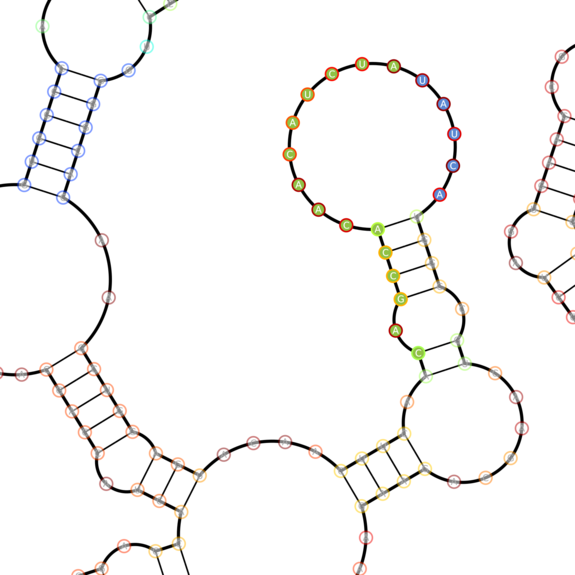
An example software rendered secondary structure of eBFP2 (BBa_K779300) showing various secondary structure elements (e.g. stems and loops)
Much work has been done to generate these secondary structures computationally (see nupack.org), and to find accessible regions predicted to be miRNA binding sites within mRNAs (e.g. PITA). We leveraged these algorithms to identify potential toehold and sensing domains within mRNAs by looking for regions with different levels of accessibility.
Once suitable domains have been chosen using modeling of the secondary structure, we can rank them by their orthogonality to other transcribed RNAs. These sequences are available in online databases (e.g. mRNA data for HEK 293 cells). For strand displacement, the rate limiting step is the binding of a strand to a gate:output complex using the toehold. After this step, the process of strand displacement is sensitive to nucleotide mismatches, with early mismatches being more disruptive than later mismatches due to the nature of branch migration (Qian et al. 2011). Thus, we can use a weighted Hamming distance between a candidate domain and every subsequence in the transcriptome. This method is similar to identifying orthogonal sequences for protein-DNA interactions as previously published (Silver et al. 2012).


Modeling
Reaction Kinetics
We modeled the mRNA's second structure using NUPACK and the strand displacement kinetics using Visual GEC.
We used LBS code, which can be run by Visual GEC, to extensively develop and test computational models of the strand displacement systems we designed, including the mRNA sensor, the NOT gate (see NOT Gate), and a hypothetical NOT sensor which combines the functionalities of both. This enabled us to optimize the properties of our systems and examine their kinetics before performing in vitro experiments with actual DNA or RNA.
The syntax of LBS code is straightforward: it indicates when and what to plot, kinetic rates, and allowable reactions. The software then calculates how reactions will proceed. While Visual DSD, a similar tool which is specialized for simulating DNA strands, would also have worked for our purposes, Visual GEC allows code to explicitly specify which reactions occur and at what rate. The kinetic constants were based on work published by Lulu Qian and Erik Winfree (Science 2011).
mRNA Sensor
The first task is to create a simulation of an mRNA sensor. The strands involved in the design are the mRNA input itself, the ROX:quencher fluorescent reporter complex, the annealed gate:output complex, and the fuel strand which accelerates the reaction rate.
The visual GEC code describing this system can be downloaded here. This code compiles to a visual depiction of the reaction network, and simulating a kinetic run outputs a prediction of the level of each product.

We can then specifically compare the levels of the output molecule -- which is fluorescence of the unquenched ROX-bound RNA -- and observe the difference in output level for different concentrations of input.

Green curve: 9 nanomolar (i.e. 90%) input strand. Red curve: 1 nM (10%) input strand.
Both run with 100nM fuel strand, 12 nM ROX:quencher reporter complex, 10 nM gate:output complex
Inverting mRNA Sensor (NOT sensor)
Next, we designed an inverting mRNA sensor, in the hope that creating an effective NOT sensor could simplify potential circuits by removing the need to cascade a NOT gate with an mRNA sensor.
The NOT sensor includes the familiar mRNA strand, fluorescent reporter complex, gate:output complex, and fuel strands. In addition, it contains a new strand called the "sensor" strand, which displaces the gate:output but is competitively bound by mRNA. Thus, the presence of an mRNA strand inhibits the sensor, preventing output signal. The absence of an mRNA strand allows the sensor strand to displace the gate:output signal, creating a fluorescent signal. This creates NOT logic.
These reactions are described in the Visual GEC code, which can be downloaded here.
We can compare the outputs produced by various concentrations of mRNA input, and graph this as a transfer function. The shape of this transfer function demonstrates the implementation of NOT logic in the inverted sensor system. The NOT sensor system was designed with a steep dropoff as opposed to a steady gradient, so that it would exhibit reliable boolean behavior when implemented into any larger circuit.

In vitro tests of the functionality of the designed NOT sensor strands are in progress. Similar modeling has had excellent predictive power for the functioning of a NOT gate -- refer to our results in NOT Gate.
In vitro results
We chose 4 domains in eBFP2 with various predicted secondary structure properties to test out in vitro (see design considerations above). eBFP2 (BBa_K779300) mRNA was produced by PCRing on a T7 promoter and terminator . The resulting template was then used for in vitro transcription . After purification and quantification on a NanoDrop 2000C, the transcribed mRNA, corresponding sensor complexes and fuel strands, along with a fluorescent reporter were added to wells in a 96-well plate and the fluorescence was measured on a plate reader.
For fast and cheap prototyping we chose to implement the sensor, fuel and reporter complexes in DNA. From our foundational studies we know that these results will carry over to RNA-based sensors (likely with even better results as the thermodynamics and kinetics of RNA-RNA reactions are more favorable to us than RNA-DNA reactions in terms of getting a high and fast readout).
Results indicate that the sensor was able to detect all 4 domains, albeit with differing results, suggesting that the sensing domain choice does matter. We can imagine that all these signals can be incorporated to produce a higher output.
