Team:Tokyo Tech/Project/modeling
From 2012.igem.org
(→2. LuxI / LasI expression) |
(→3. TetR expression promoted by 3OC6HSL) |
||
| Line 59: | Line 59: | ||
| - | Where, TetR denotes the concentration of TetR protein. α<sub> | + | Where, TetR denotes the concentration of TetR protein. α<sub>6</sub> denotes the maximum expression rate of TetR. β<sub>6</sub> is Hill coefficient. m<sub>6</sub> denotes the 3OC6HSL concentration at which the expression rate of TetR is half of α<sub>6</sub>. leak<sub>TetR</sub> denotes the leaky expression rate of TetR. d<sub>TetR</sub> denotes the constant coefficient. |
| - | + | ||
==4. lysis protein expression repressed by LacI== | ==4. lysis protein expression repressed by LacI== | ||
Revision as of 00:56, 27 September 2012
Model development
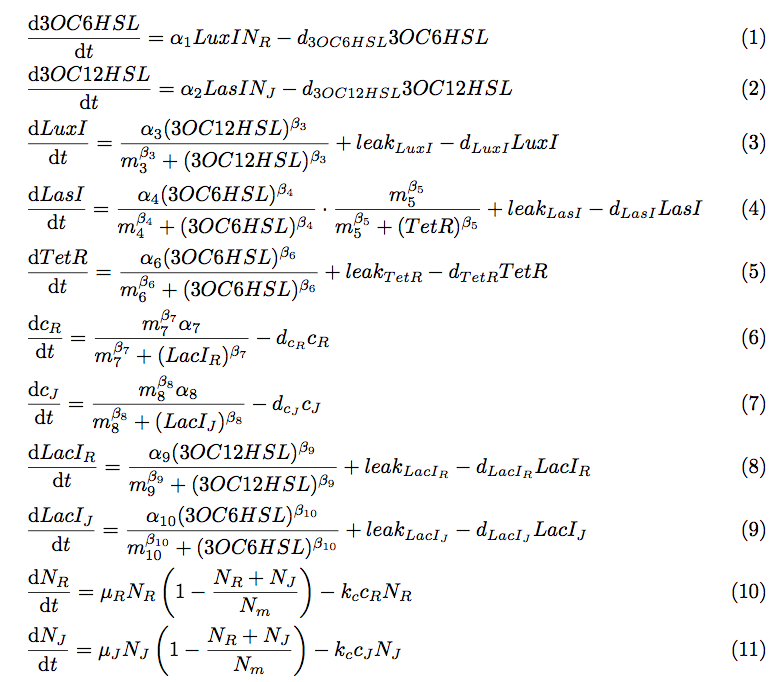
To simulate the cell-cell communication system, we developed an ordinary differential equation model. The equations used in the model are shown in fig4-1.
In the cell-cell communication system, the major kinetic events are: 3OC6HSL synthesis and degradation; 3OC12HSL synthesis and degradation; LuxI expression promoted by 3OC12HSL; LasI expression promoted by 3OC6HSL and repressed by TetR; TetR expression promoted by 3OC6HSL; lysis protein expression repressed by LacI; LacI expression promoted by 3OC12HSL; LacI expression promoted by 3OC6HSL; growth and suicide of cells. These kinetic events are contained in the equations. Following sentences describe how the equations are developed.
1. 3OC6HSL / 3OC12HSL synthesis and degradation
3OC6HSL/3OC12HSL is enzymatically synthesized by LuxI/LasI proteins from some substrates. For the simplicity, we assumed the amount of substrates is sufficient so that the 3OC6HSL/3OC12HSL synthesis rate per cell is estimated to be proportional to the LuxI/LasI protein concentration (equation (12) and (13)).
The degradation rate of 3OC6HSL/3OC12HSL is assumed to be first-order kinetic. The dynamical behaviors of 3OC6HSL/3OC12HSL concentration are described by the following equations (equation (1) and (2)).
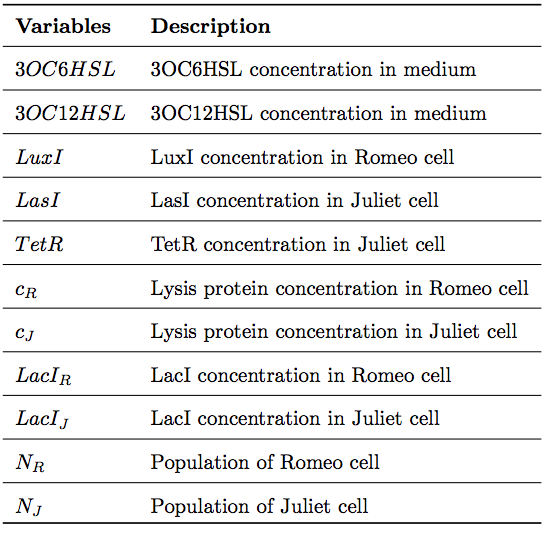
Where, 3OC6HSL and 3OC12HSL denote the concentration in the medium. α1, α2, d3OC6HSL, and d3OC12HSL denote constant coefficients.
2. LuxI / LasI expression
In the cell-cell communication system, the expression of LuxI/LasI is regulated by LasR-3OC12HSL/LuxR-3OC6HSL complex, respectively. We assumed LasR/LuxR to be expressed sufficiently so that the concentration of the complex depends only on the concentration of 3OC12HSL/3OC6HSL. Thus, the expression rates of LuxI/LasI are described by Hill function dependent on the 3OC12HSL/3OC6HSL concentration (equation (14) and (15)).
In addition, the expression of LasI is repressed by TetR protein (equation(16)).
Considering the leaky expression of LuxI/LasI and the degradation of LuxI/LasI, we employed equation (3) and (4) to simulate the expression of LuxI/LasI.
Where, LuxI and LasI denote the concentration of LuxI and LasI. α3 and α4 denote the maximum expression rate of LuxI and LasI, respectively. leakLuxI and leakLasI denote the leaky expression rate of LuxI and LasI. β3, β4 and β5 are Hill coefficients. m3 and m4 denote the 3OC12HSL/3OC6HSL concentration at which the expression rate of LuxI/LasI is half of α3/α4. dLuxI and dLasI denote the constant coefficients.
3. TetR expression promoted by 3OC6HSL
The expression of TetR is described by Hill function dependent on the 3OC6HSL concentration, similar to the expression of LuxI (equation(3)). Thus, the behavior of TetR is described by the following equation (equation(5)).
Where, TetR denotes the concentration of TetR protein. α6 denotes the maximum expression rate of TetR. β6 is Hill coefficient. m6 denotes the 3OC6HSL concentration at which the expression rate of TetR is half of α6. leakTetR denotes the leaky expression rate of TetR. dTetR denotes the constant coefficient.
4. lysis protein expression repressed by LacI
The expression of lysis proteins is described by Hill function dependent on the LacI concentration, similar to the expression of LuxI (equation(3)). Though the expression of LuxI is promoted by 3OC12HSL, the expression of lysis proteins is repressed by LacI. Thus, we employed the following Hill function (equation(17) and (18)).
Considering the degradation of lysis protein, we employed equation (6) and (7) to simulate the expression of lysis protein.
Where, cR and cJ denote the concentration of lysis proteins in Romeo cells and Juliet cells. α7 and α8 denote the maximum expression rate of lysis proteins in Romeo cells and Juliet cells, when LacI does not exist in cells. β7 and β8 are Hill coefficients. m7 and m8 denote the LacI concentration at which the expression rate of lysis protein is half of α7/α8. dcR and dcJ denote constant coefficients.
5. LacI expression promoted by 3OC12HSL/3OC6HSL
The expression of LacI is described by Hill function dependent on the concentration of 3OC12HSL/3OC6HSL, similar to the expression of LuxI (equation (3)). Thus, the behavior of LacI is described by the following equations (equation (8) and (9)).
Where, LacIR and LacIJ denote the concentration of LacI proteins in Romeo cells and Juliet cells. α9 and α10 denote the maximum expression rate of LacI in Romeo cells and Juliet cells. β9 and β10 are Hill coefficients. m9 and m10 denote 3OC12HSL/3OC6HSL concentration at which the expression rate of LacI is half of α9/α10, respectively. leakLacI denotes the leaky expression rate of LacI. dLacI denotes the constant coefficient.
6. growth and suicide of cells
The growth rate of each type of cell without the effect of the suicide can be described by the following logistic growth equation (equation(19)).
Where, N denotes the number of cells, Nm denotes the maximal number of cells (carrying capacity) due to nutrient limitation, and μ is a constant coefficient.
When two types of cell coexist, the growth rates of the both types of cells are described by the following equations(equation(20) and (21)).
The growth rate of each type of cell is proportional to the number of their type of cells and is reduced by the influence of the total number of cells in the system (NR+NJ).
The effect of the suicide is represented by the following equations (equation(22) and (23)).
Where, cR and cJ denote the concentration of lysis protein in Romeo cells and Juliet cells, respectively. The decreasing rate of the number of cells is proportional to the product of lysis protein concentration and the number of cells. Here, kc is the rate constant.
As a consequence, the dynamics of the number of cells are described by equation (10) and (11).
the initial values of variables and the parameters
[Back to "Result1: Whether our circuit can reproduce “Romeo and Juliet”"]
To simulate the cell-cell communication system, we set the initial values of variables and the parameters as follows:
 "
"


