Team:NTNU Trondheim/Model
From 2012.igem.org
| Line 36: | Line 36: | ||
The plots show the production of the LuxI protein as a response to the presence of lactate. The plot on the left shows a system with a quite low concentration of lactate, 10 in the model. Under these conditions, only a few, less than 5, promoters are activated and, as result, the LuxI concentration remains low.The plot on the right shows the response to a 100 times larger lactate concentration. Even though the number of active promoters remains relatively low, the constant production of mRNA leads to a large production of LuxI. | The plots show the production of the LuxI protein as a response to the presence of lactate. The plot on the left shows a system with a quite low concentration of lactate, 10 in the model. Under these conditions, only a few, less than 5, promoters are activated and, as result, the LuxI concentration remains low.The plot on the right shows the response to a 100 times larger lactate concentration. Even though the number of active promoters remains relatively low, the constant production of mRNA leads to a large production of LuxI. | ||
| - | {| style="text-align:center; margin: 1em auto 1em auto; padding: 0 10px;" | + | {| style="text-align:center; margin: 1em auto 1em auto; padding: 0 10px;" cellpadding="10px" |
|[[File:NTNU_Trondheim_Model_LldrLow.png|thumb|center|450px|Figure 1. Response of lld promoter to a lactate level of 10]] | |[[File:NTNU_Trondheim_Model_LldrLow.png|thumb|center|450px|Figure 1. Response of lld promoter to a lactate level of 10]] | ||
|[[File:NTNU_Trondheim_Model_LldrHigh.png|thumb|center|450px|Figure 2. Response of lld promoter to a lactate level of 1000]] | |[[File:NTNU_Trondheim_Model_LldrHigh.png|thumb|center|450px|Figure 2. Response of lld promoter to a lactate level of 1000]] | ||
| Line 50: | Line 50: | ||
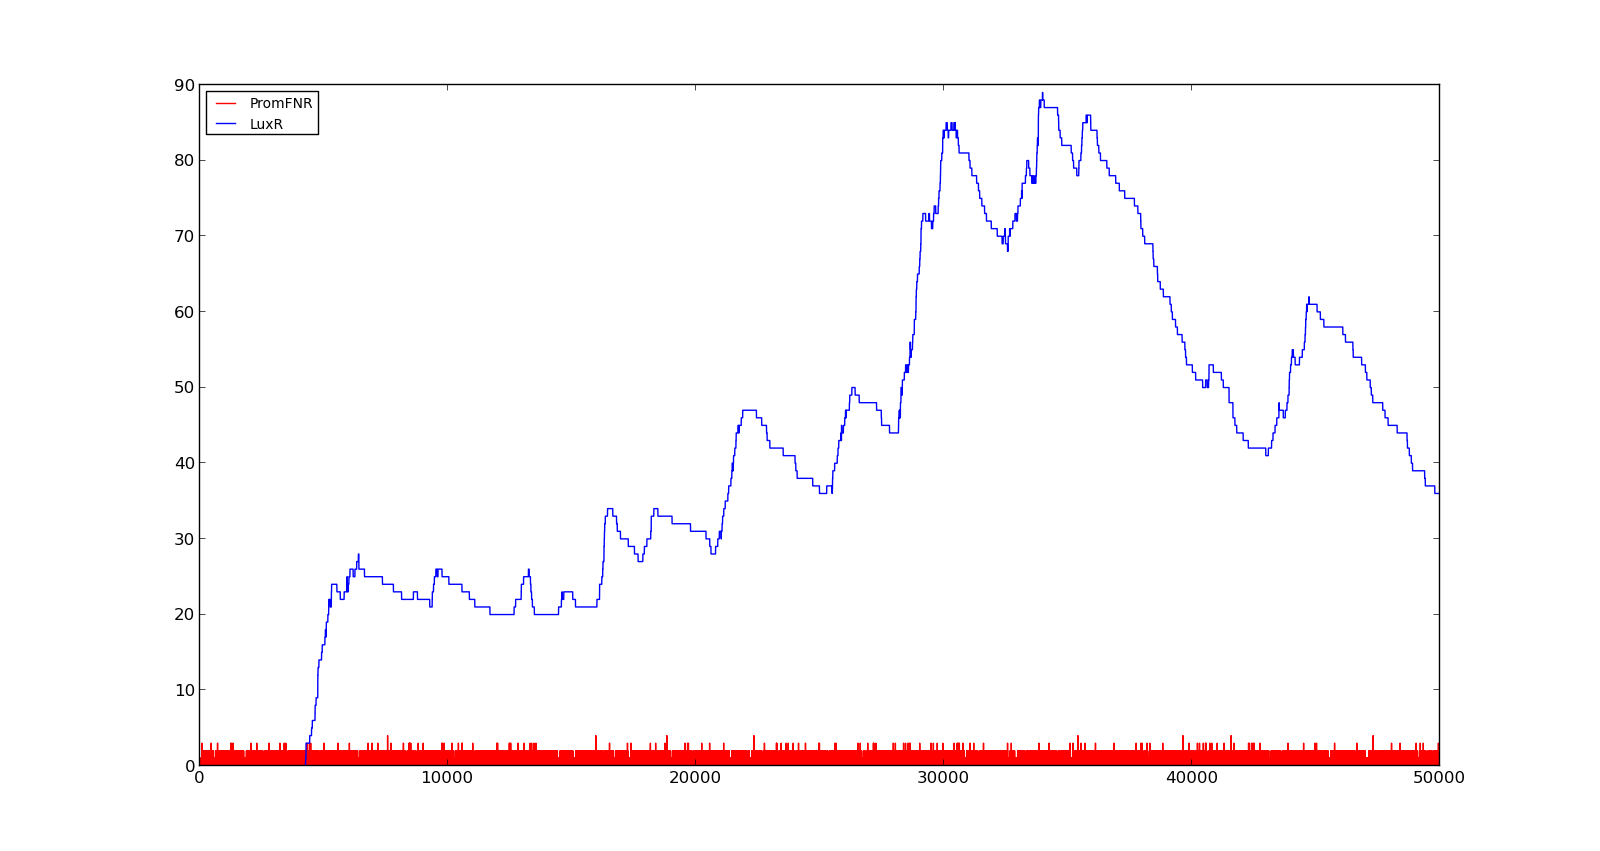
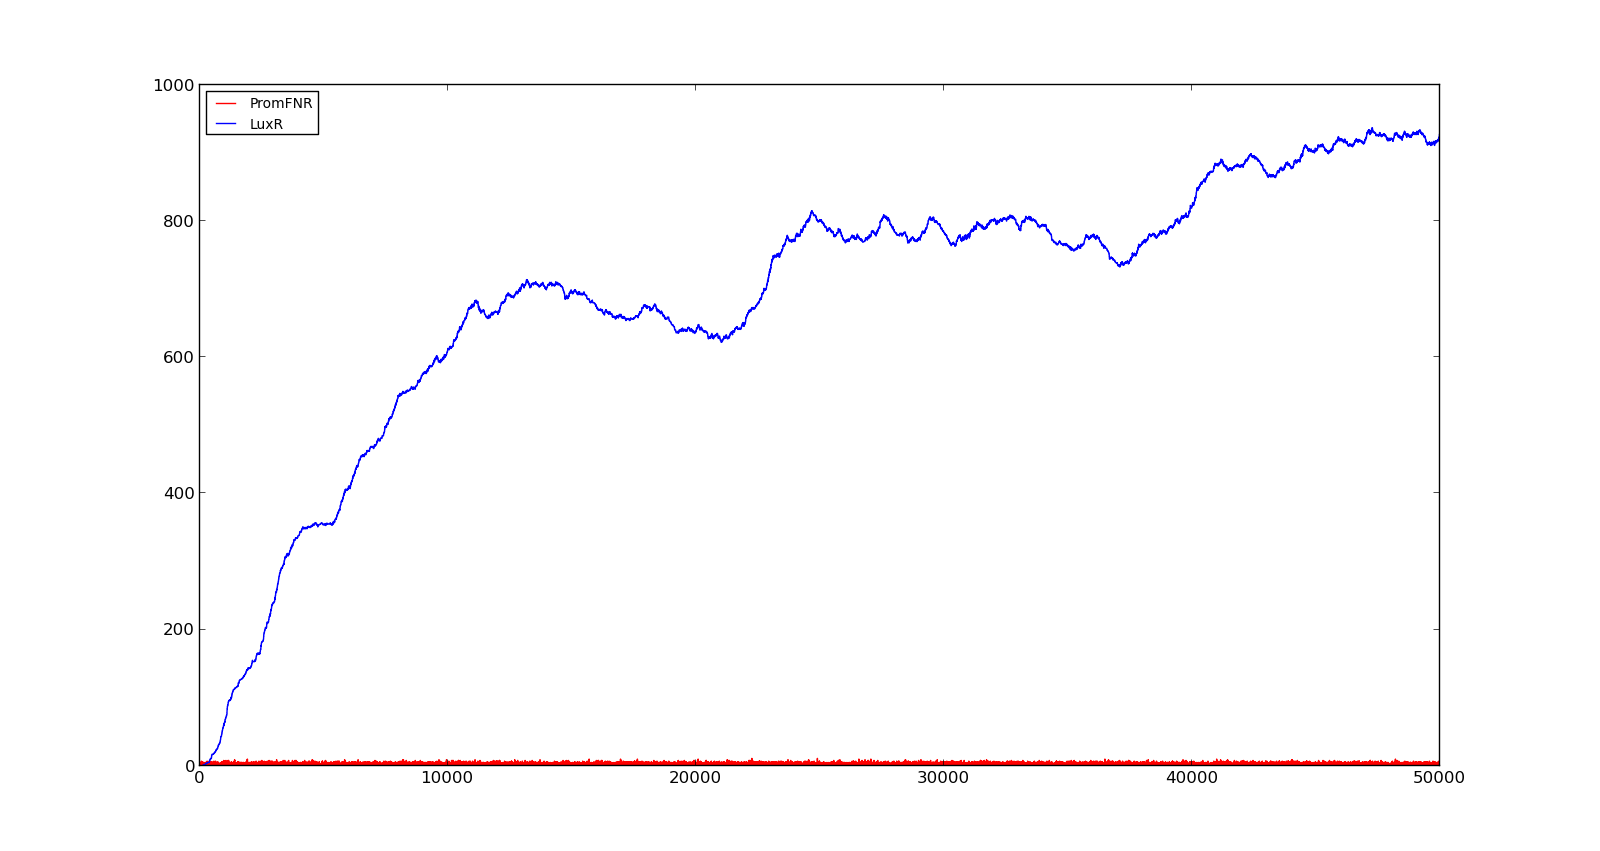
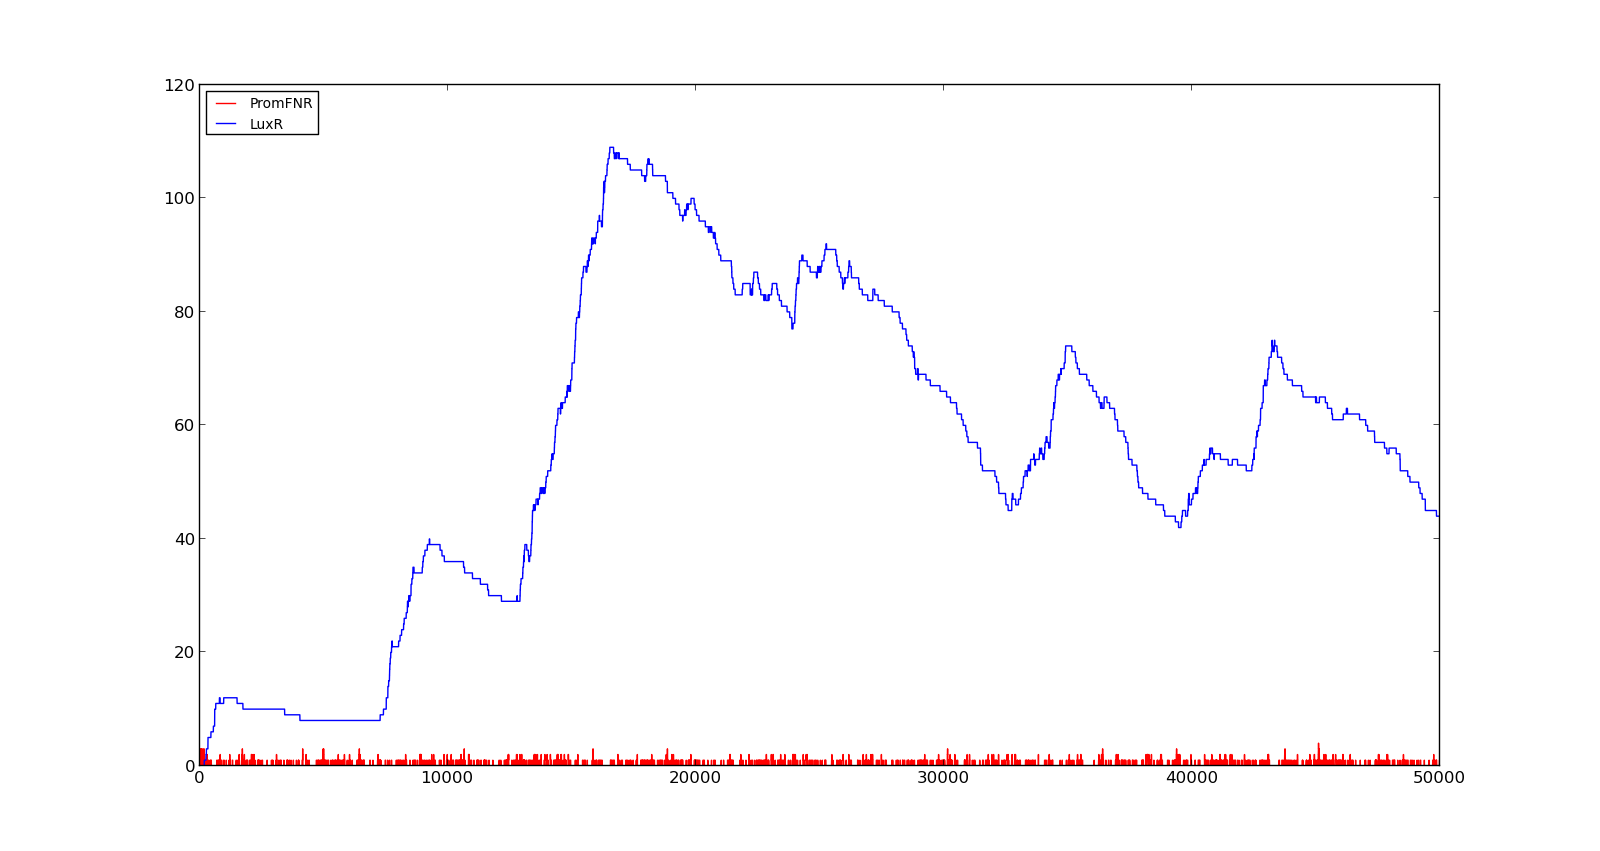
In the figures below, the LuxR production and amount of active promoter is plotted for three different oxygen levels; 10, 250 and 2000. For the levels with low induction, the amount of protein remains relatively low around 100. In the high induction case, however, the concentration rapidly increases to over 900. Even for the high induction case, the amount of activated promoter remains relatively low. | In the figures below, the LuxR production and amount of active promoter is plotted for three different oxygen levels; 10, 250 and 2000. For the levels with low induction, the amount of protein remains relatively low around 100. In the high induction case, however, the concentration rapidly increases to over 900. Even for the high induction case, the amount of activated promoter remains relatively low. | ||
| - | {| style="text-align:center; margin: 1em auto 1em auto; padding: 0 10px;" | + | {| style="text-align:center; margin: 1em auto 1em auto; padding: 0 10px;" cellpadding="10px" |
|[[File:NTNU_Trondheim_Model_VgbLow.png|thumb|center|450px|Figure 3. Response of vgb promoter to an oxygen level of 10]] | |[[File:NTNU_Trondheim_Model_VgbLow.png|thumb|center|450px|Figure 3. Response of vgb promoter to an oxygen level of 10]] | ||
|[[File:NTNU_Trondheim_Model_VgbHigh.png|thumb|center|450px|Figure 4. Response of vgb promoter to an oxygen level of 250]] | |[[File:NTNU_Trondheim_Model_VgbHigh.png|thumb|center|450px|Figure 4. Response of vgb promoter to an oxygen level of 250]] | ||
| Line 65: | Line 65: | ||
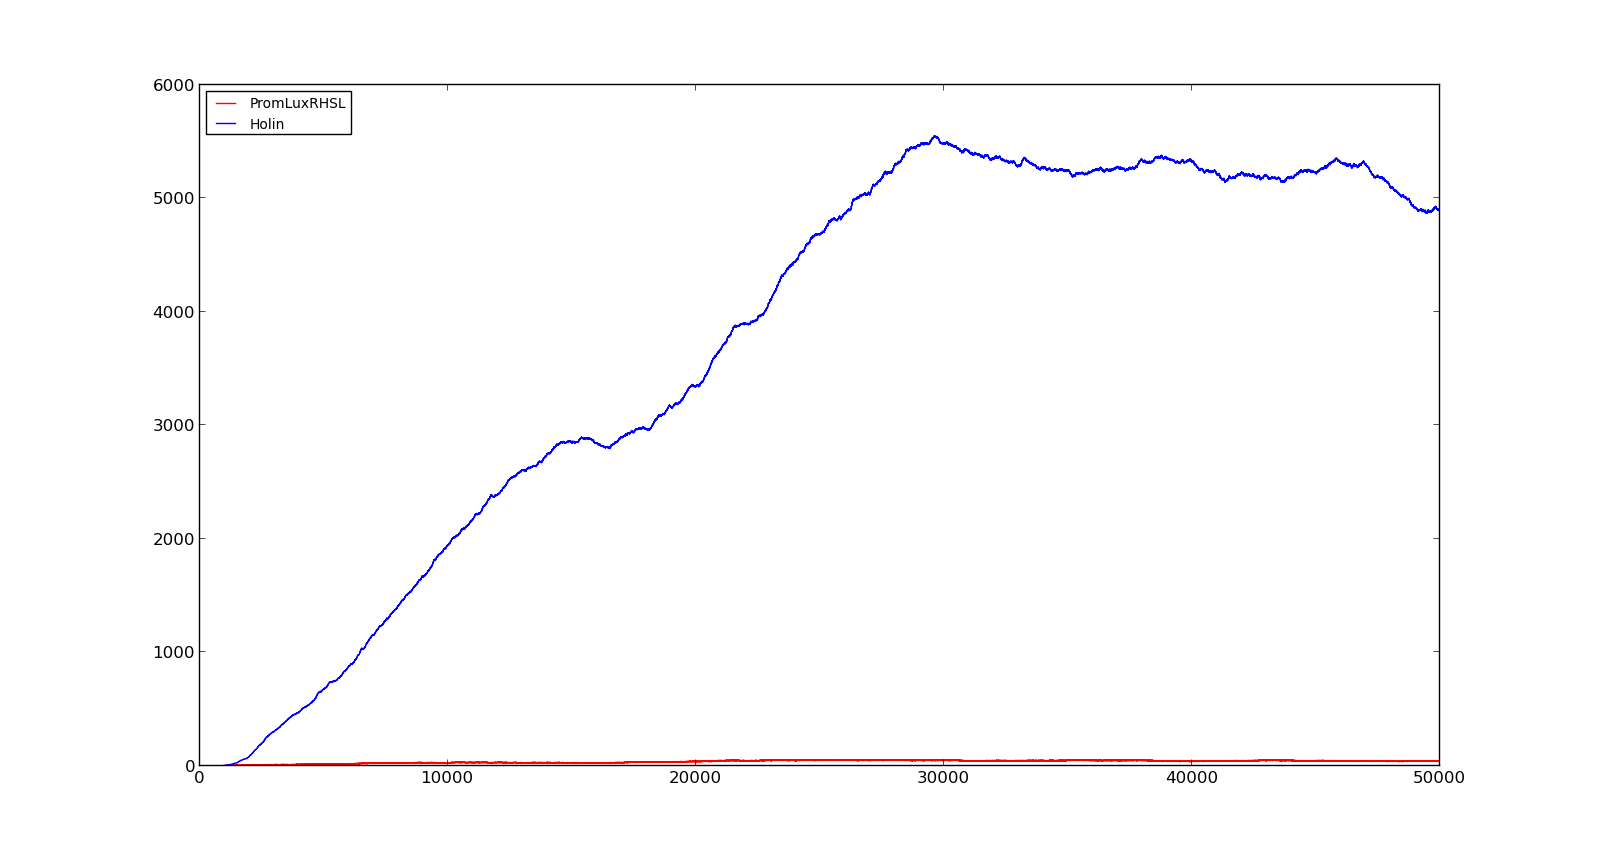
In the cell, two LuxR proteins will form a complex with two HSL molecules. This complex will then bind to a palindromic site and activate the promoter. In the model, the reaction was described as two HSL and two proteins reacting directly and forming a complex that activated the promoter. The results are shown in the figure below. In the figure to the left, a constant production of 0.001 s⁻¹ was assumed for both LuxR and LuxI. This gave an expression of Holin, the compound that cause lysis, see full model, with a maximum about 700. This was quite high, but less than the lethal amount of about a 1000[http://dx.doi.org/10.1146/annurev.micro.54.1.799]. After increasing the expression to 0.01 s⁻¹, the amount increased to about 5500. Again, the amount of activated promoter were quite low, indicating a too high transcription and translation rate. | In the cell, two LuxR proteins will form a complex with two HSL molecules. This complex will then bind to a palindromic site and activate the promoter. In the model, the reaction was described as two HSL and two proteins reacting directly and forming a complex that activated the promoter. The results are shown in the figure below. In the figure to the left, a constant production of 0.001 s⁻¹ was assumed for both LuxR and LuxI. This gave an expression of Holin, the compound that cause lysis, see full model, with a maximum about 700. This was quite high, but less than the lethal amount of about a 1000[http://dx.doi.org/10.1146/annurev.micro.54.1.799]. After increasing the expression to 0.01 s⁻¹, the amount increased to about 5500. Again, the amount of activated promoter were quite low, indicating a too high transcription and translation rate. | ||
| - | {| style="text-align:center; margin: 1em auto 1em auto; padding: 0 10px;" | + | {| style="text-align:center; margin: 1em auto 1em auto; padding: 0 10px;" cellpadding="10px" |
|[[File:NTNU_Trondheim_Model_LuxBoxLow.png|thumb|center|450px|Figure 6. Response of lux promoter to a LuxI and LuxR production rate of 0.001 s⁻¹]] | |[[File:NTNU_Trondheim_Model_LuxBoxLow.png|thumb|center|450px|Figure 6. Response of lux promoter to a LuxI and LuxR production rate of 0.001 s⁻¹]] | ||
|[[File:NTNU_Trondheim_Model_LuxBoxHigh.png|thumb|center|450px|Figure 7. Response of lux promoter to a LuxI and LuxR production rate of 0.01 s⁻¹]] | |[[File:NTNU_Trondheim_Model_LuxBoxHigh.png|thumb|center|450px|Figure 7. Response of lux promoter to a LuxI and LuxR production rate of 0.01 s⁻¹]] | ||
| Line 77: | Line 77: | ||
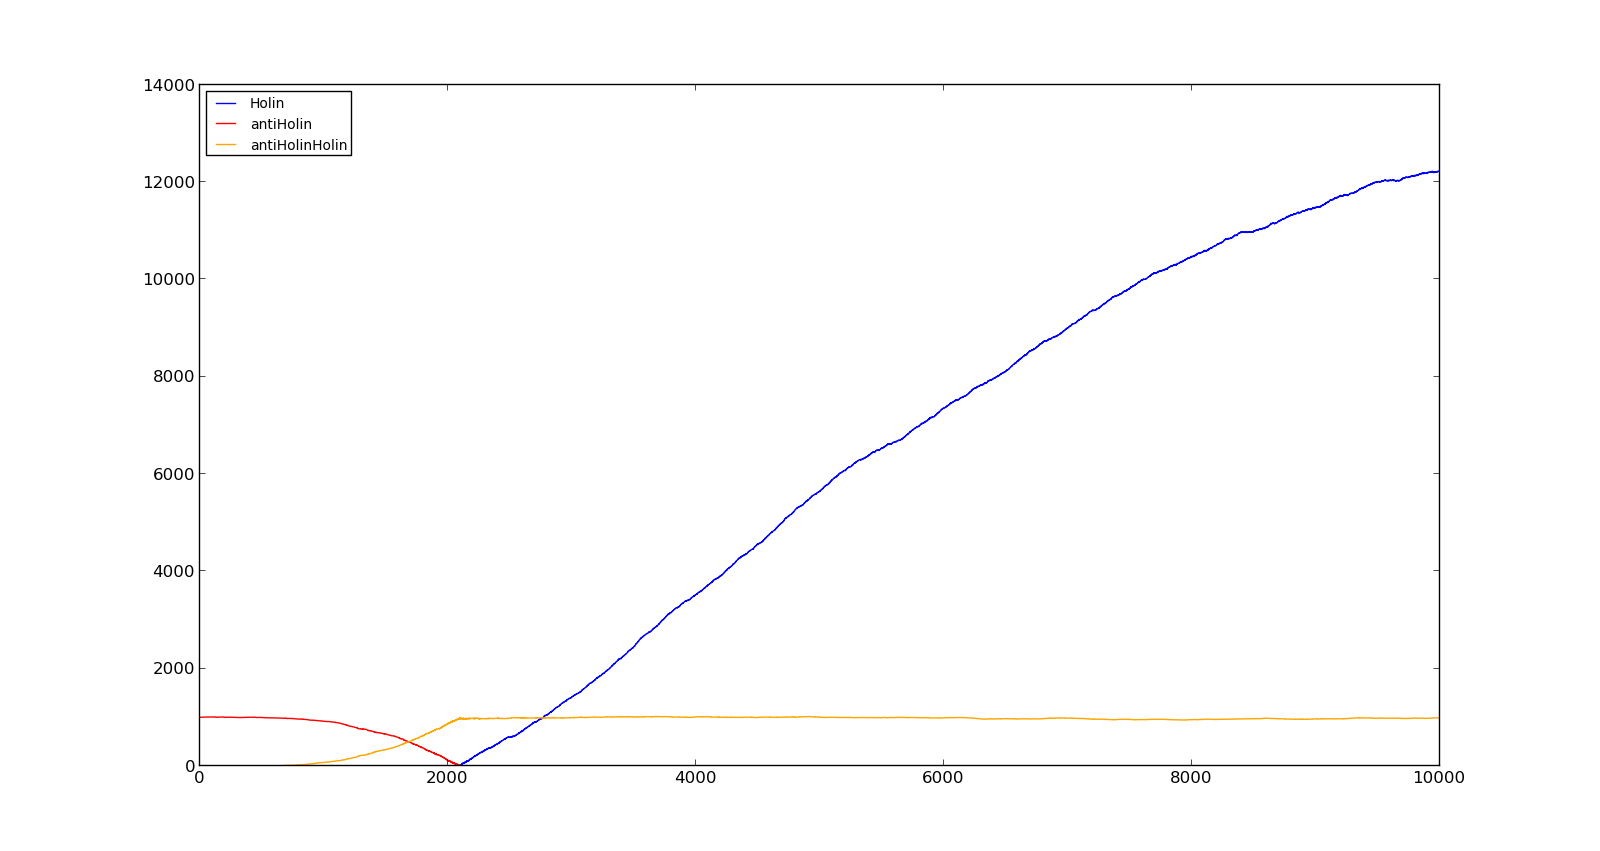
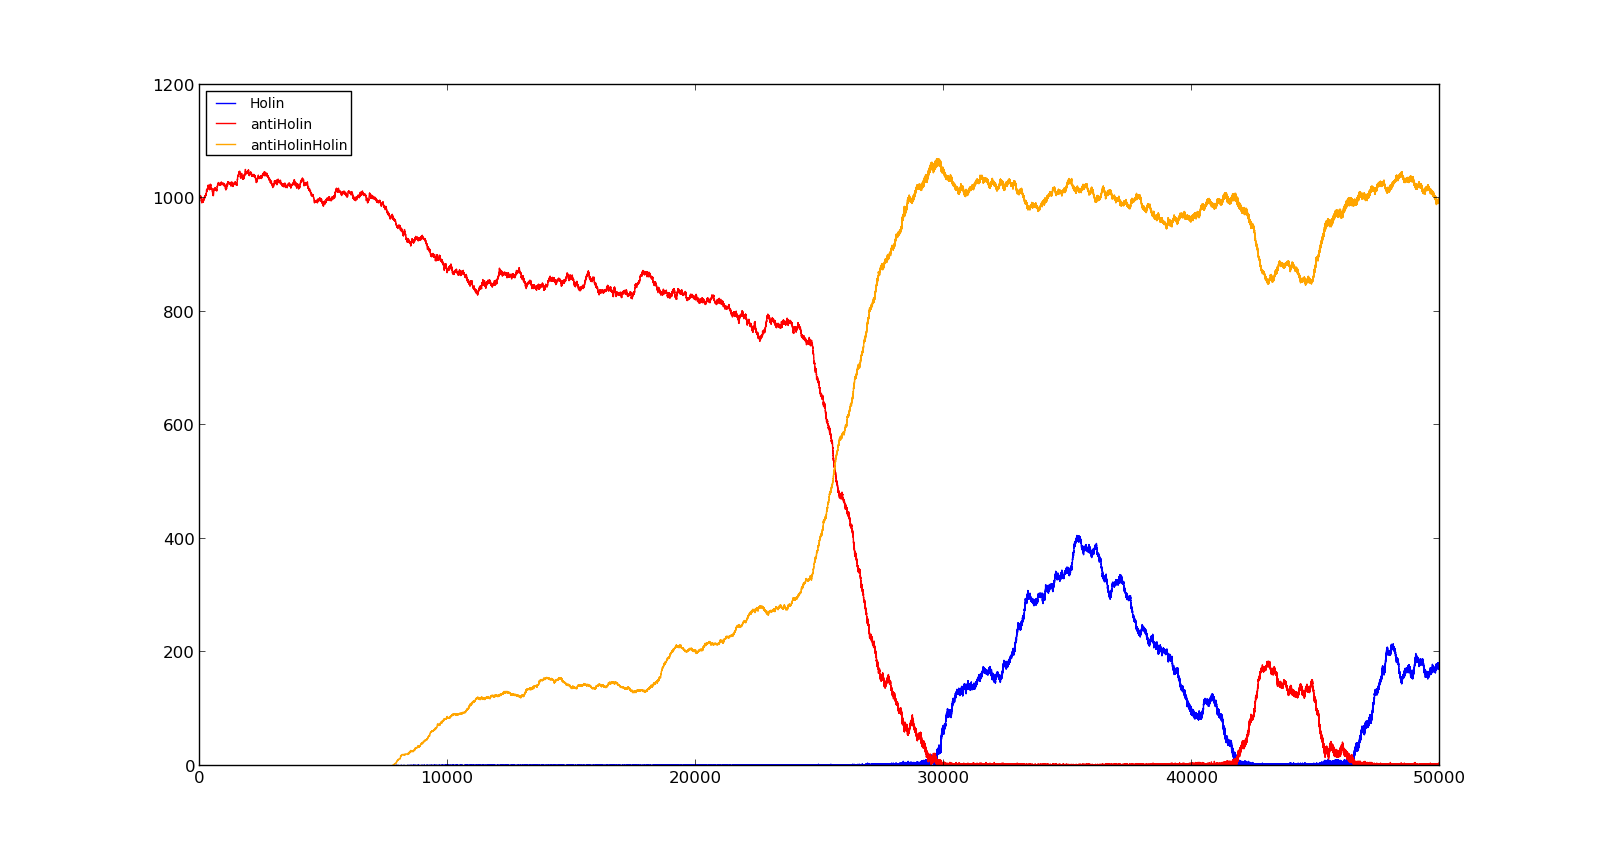
The figures below describe the behaviour of the system under various conditions. Figure 8 shows the system with a relatively low oxygen level of 100 and a high lactate level of 1000. The antiholin will cause a delay in lysis, but holin will reach lethal levels in about an hour. Figure 9 shows the response to oxygen levels of 2000 and lactate levels of 10. In this case, there is still holin production, but most of it is complexed with antiholin and it does not reach lethal levels. | The figures below describe the behaviour of the system under various conditions. Figure 8 shows the system with a relatively low oxygen level of 100 and a high lactate level of 1000. The antiholin will cause a delay in lysis, but holin will reach lethal levels in about an hour. Figure 9 shows the response to oxygen levels of 2000 and lactate levels of 10. In this case, there is still holin production, but most of it is complexed with antiholin and it does not reach lethal levels. | ||
| - | {| style="text-align:center; margin: 1em auto 1em auto; padding: 0 10px;" | + | {| style="text-align:center; margin: 1em auto 1em auto; padding: 0 10px;" cellpadding="10px" |
|[[File:NTNU_Trondheim_Model_HolinHolinHigh.png|thumb|center|450px|Figure 8. Production rate of holin at oxygen levels of 100 and lactate levels of 1000]] | |[[File:NTNU_Trondheim_Model_HolinHolinHigh.png|thumb|center|450px|Figure 8. Production rate of holin at oxygen levels of 100 and lactate levels of 1000]] | ||
|[[File:NTNU_Trondheim_Model_HolinHolinLow.png|thumb|center|450px|Figure 9. Production rate of holin at oxygen levels of 2000 and lactate levels of 10]] | |[[File:NTNU_Trondheim_Model_HolinHolinLow.png|thumb|center|450px|Figure 9. Production rate of holin at oxygen levels of 2000 and lactate levels of 10]] | ||
| Line 86: | Line 86: | ||
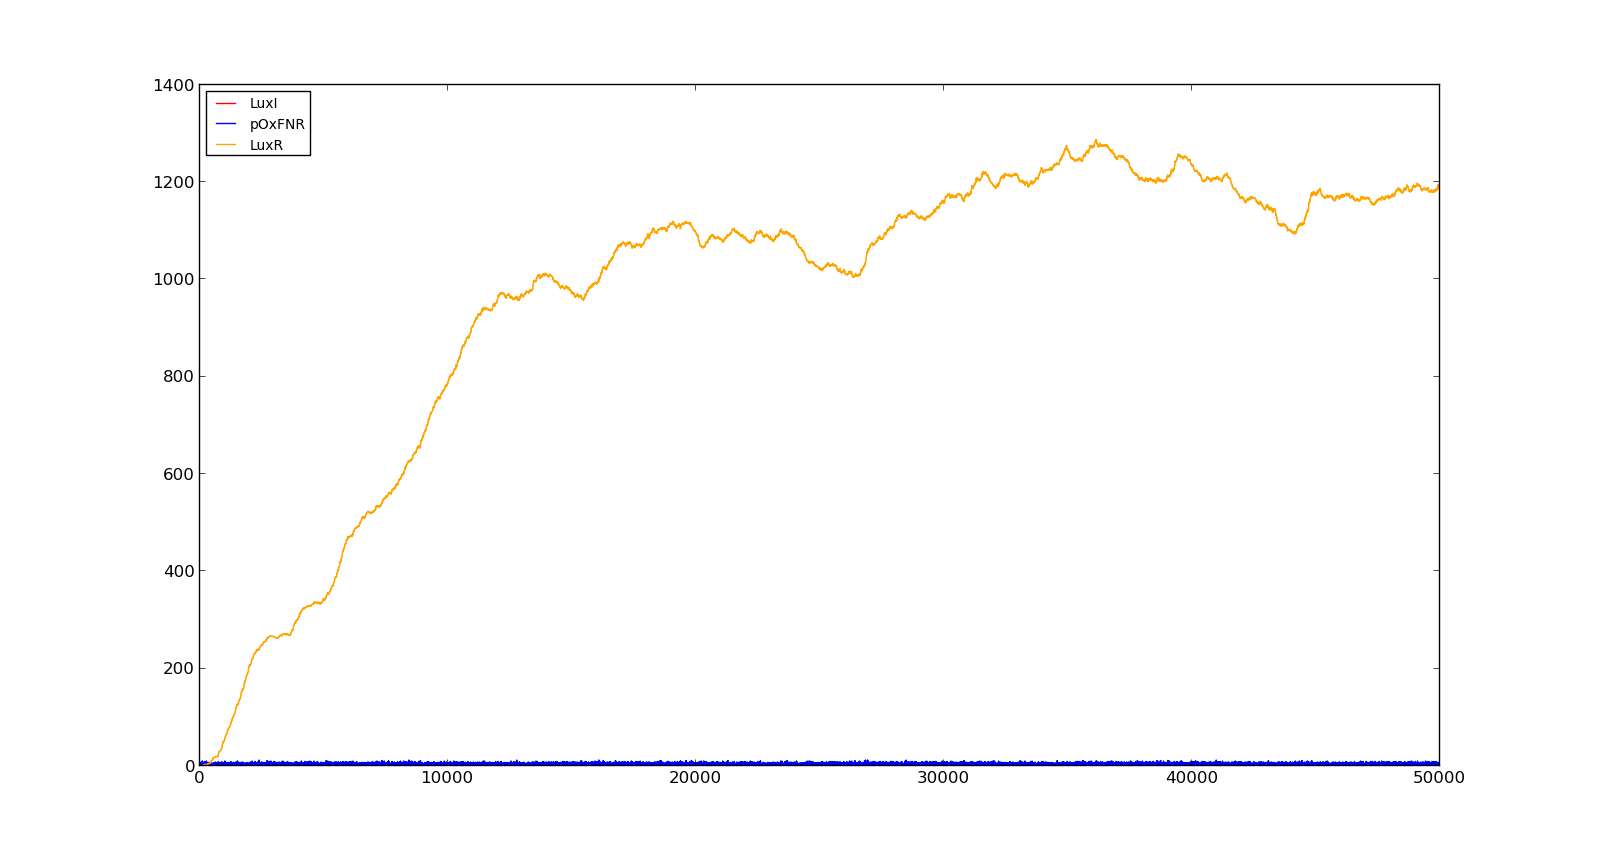
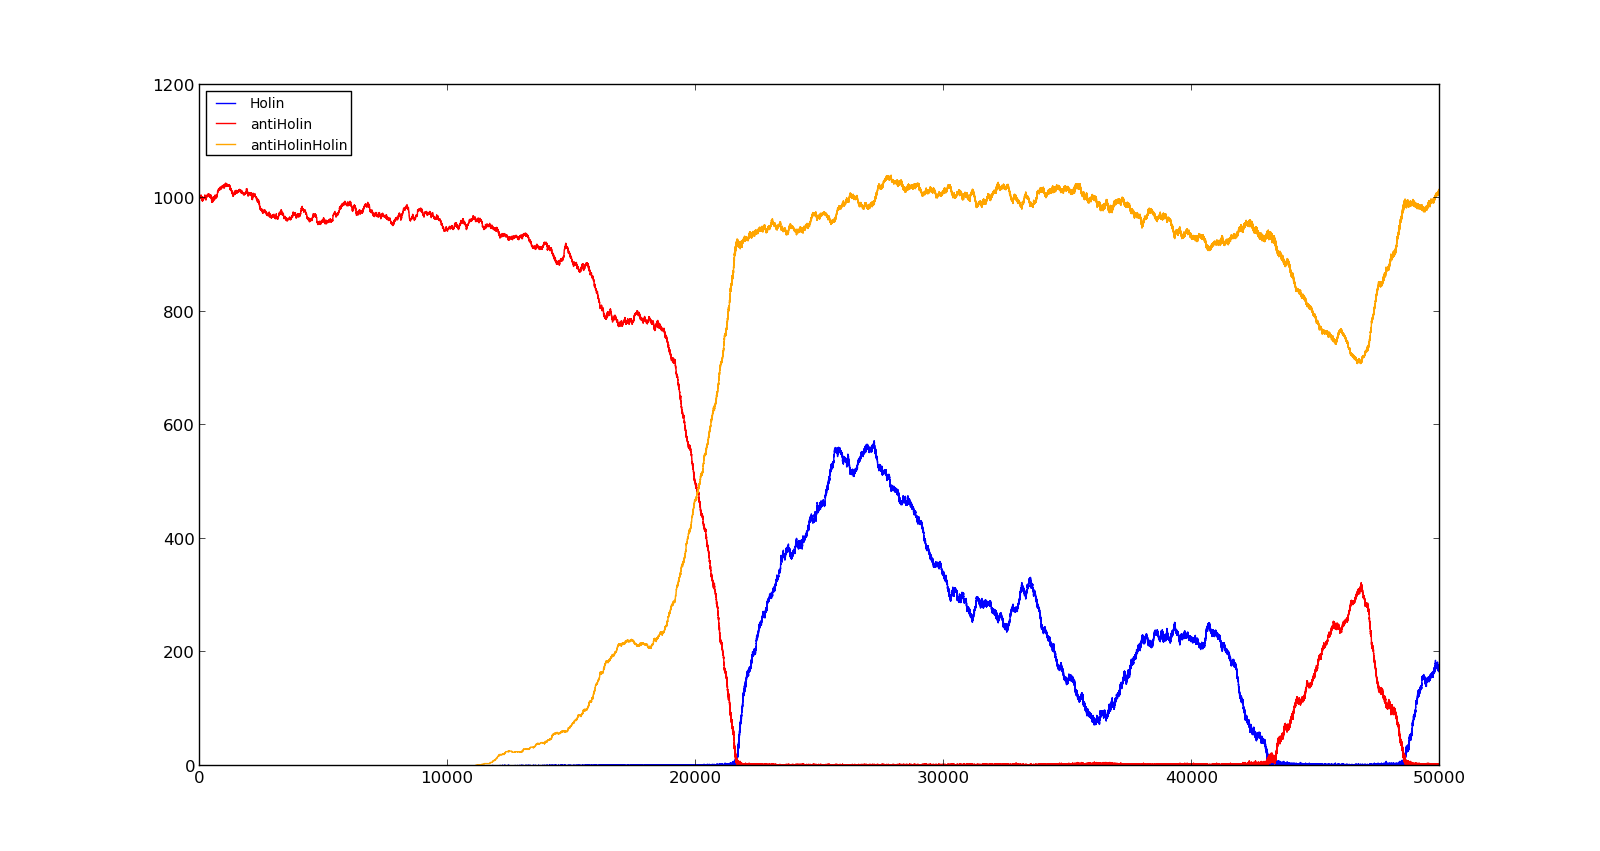
The last plot shows the response to high oxygen levels; 5000, and high lactate levels; 100. this gives a response similiar to the one in Figure 9 were holin is produced, but forms a complex with antiholin and does not reach large enough quantities to cause lysis. | The last plot shows the response to high oxygen levels; 5000, and high lactate levels; 100. this gives a response similiar to the one in Figure 9 were holin is produced, but forms a complex with antiholin and does not reach large enough quantities to cause lysis. | ||
| - | {| style="text-align:center; margin: 1em auto 1em auto; padding: 0 10px;" | + | {| style="text-align:center; margin: 1em auto 1em auto; padding: 0 10px;" cellpadding="10px" |
|[[File:NTNU_Trondheim_Model_HighOxNoLact.png|thumb|center|450px|Figure 10. Production rate of LuxR and LuxI at oxygen levels of 250 and no lactate]] | |[[File:NTNU_Trondheim_Model_HighOxNoLact.png|thumb|center|450px|Figure 10. Production rate of LuxR and LuxI at oxygen levels of 250 and no lactate]] | ||
|[[File:NTNU_Trondheim_Model_LactVHighOx.png|thumb|center|450px|Figure 11. Production rate of holin at oxygen levels of 5000 and lactate levels of 100]] | |[[File:NTNU_Trondheim_Model_LactVHighOx.png|thumb|center|450px|Figure 11. Production rate of holin at oxygen levels of 5000 and lactate levels of 100]] | ||
|} | |} | ||
Revision as of 17:31, 23 September 2012
 "
"


