 "
"
Team:UANL Mty-Mexico/Modeling/Biosensor
From 2012.igem.org
Biosensor
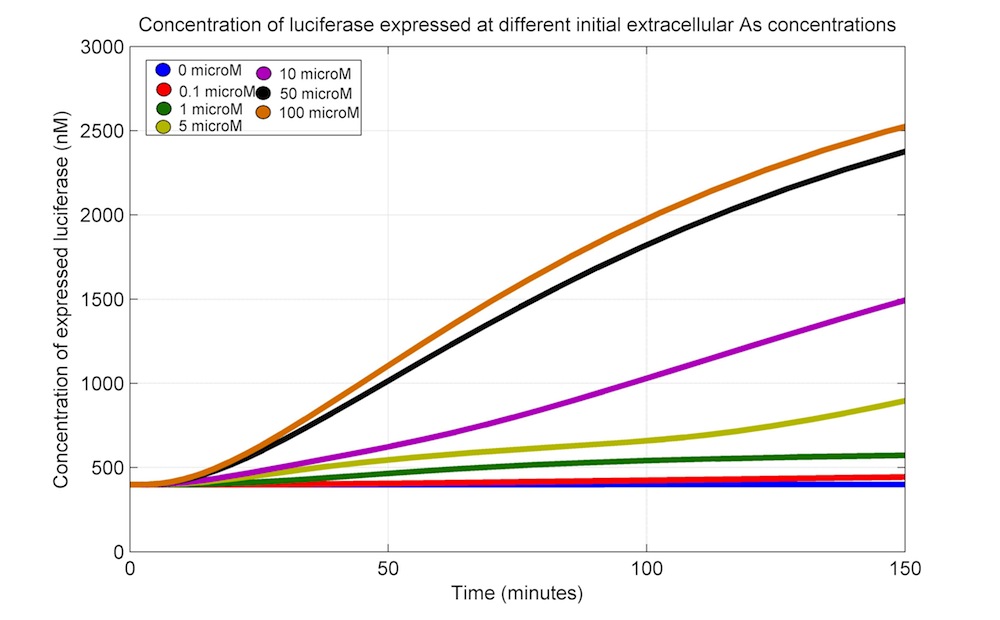
Our biosensor model is a continuation of the previously exposed transport and accumulation model with the addition of the production of luciferase as a function of ArsR|As concentration. In this way, we can relate the concentration of extracellular As to the production of luciferase.
ODEs
The ODEs that describe the kinetics of the biosensor modules include all the assumptions presented in the core model and the equations presented for the accumulation and transport module, along with their corresponding parameters.
Taking into account the equations from the accumulation and transport module, we introduce a generator for Luciferase:
Luciferase mRNA
\begin{equation} \large \frac{d[mRNA_{Luc}]}{dt} = \alpha _{mLuc}\cdot (pro_{ars})\cdot(\frac{k_{D1}^{h_{1}}}{k_{D1}^{h_{1}}+[ArsR]^{h_{1}}})- \delta _{mRNA_{Luc}}[mRNA_{Luc}] \end{equation}Luciferase protein
\begin{equation} \large \frac{d[Luc]}{dt} = \alpha _{pLuc}\cdot[mRNA_{Luc}]- \delta _{Luc}[Luc] \end{equation}Parameters
The parameters for the ODEs describing the production of luciferase mRNA and protein are shown in the next table.
Parameter table
|
Parameter |
Description |
Value |
References |
|
αmArsR |
Maximal transcription rate of ArsR |
3.74 nM/min |
Assumptions |
|
αmFluc |
Maximal transcription rate of Fluc |
1.40 nM/min |
Assumptions |
|
αpArsR |
Maximal translation rate of ArsR |
9.74 nM/min |
Assumptions |
|
αpFluc |
Maximal translation rate of Fluc |
2.06 nM/min |
Assumptions |
|
δmRNAArsR |
Degradation rate of ArsR mRNA |
2.16x10⁻¹ min-1 |
Assumptions, Selinger, et al. (2003) |
|
δmRNAFluc |
Degradation rate of Fluc mRNA |
3.37x10⁻² min-1 |
Assumptions, Suter, et al. (2011), Karetnivok and Lehto (2006). |
|
δArsR |
Degradation rate of ArsR |
2.31x10⁻² min-1 |
Assumptions |
|
δFluc |
Degradation rate of Fluc |
2.60x10⁻² min-1 |
Assumptions, Auld, et al. (2008) |
|
proars |
Concentration of ars promoter |
aprox. 1*plasmid copy (nM) |
Assumptions |
Simulations
 |
