 "
"
Team:Peking/Modeling/Phototaxis/Stochastic
From 2012.igem.org
m |
m |
||
| (25 intermediate revisions not shown) | |||
| Line 10: | Line 10: | ||
<h3 id="title1">Summary</h3> | <h3 id="title1">Summary</h3> | ||
<p> | <p> | ||
| - | + | We also traced the cells on the macroscopic level. We started from a colony where all cells are competent for phototaxis function (besides, we also considered cell division). We simulated this phototaxis system in high contrast lighting and gradient lighting environment, respectively. | |
</p> | </p> | ||
</div> | </div> | ||
| Line 16: | Line 16: | ||
<h3 id="title2">Stochastic Simulation</h3> | <h3 id="title2">Stochastic Simulation</h3> | ||
<p> | <p> | ||
| - | + | It is the component of CheY<sub>P</sub> that directly interacts with the motors and thus influences the mobility of the cell. In details, CheY<sub>P</sub> can interact with the flagellar motor to induce CW (clockwise) rotation. When flagellar motors rotate CCW (counter-clockwise), they form a bundle to generate a force similar to a worm wheel. However, if some of the flagellar motors rotate CW, the bundle breaks and the cell keeps tumbling. After in CW state for about 0.43s,<sup><a href="#ref2" title="Vladimirov, N., et al.(2008). Dependence of bacterial chemotaxis on gradient shape and adaptation rate. PLoS Comput. Biol., 4: e1000242">[2]</a></sup> the flagellar motors return to CCW state and reconstruct the bundle to make the cell run. Since the CW state is triggered by CheY<sub>P</sub> molecule stochastically and is independent from its state history, this event is a typical Possion Process whose average frequency is determined by the concentration of CheY<sub>P</sub> with:<sup><a href="#ref3" title="Cluzel, P., et al.(2000). An ultrasensitive bacterial motor revealed by monitoring signaling proteins in single cells. Science, 287: 1652: 1655">[3]</a></sup> | |
</p> | </p> | ||
<div class="floatC"> | <div class="floatC"> | ||
| - | <img src="/wiki/images/4/4e/Peking2012_Formula008.png" alt=""/> | + | <img src="/wiki/images/4/4e/Peking2012_Formula008.png" alt="" style="width:300px;"/> |
</div> | </div> | ||
<p>where</p><ul><li> | <p>where</p><ul><li> | ||
| - | FreqCW : the average frequency of CW (clockwise) rotation | + | FreqCW : the average frequency of CW (clockwise) rotation event</li><li> |
[CheY<sub>P</sub>]<sub>c</sub> : the critical concentration of phosphorylated CheY in this Hill Function</li><li> | [CheY<sub>P</sub>]<sub>c</sub> : the critical concentration of phosphorylated CheY in this Hill Function</li><li> | ||
H : the exponential rate, a constant</li><li> | H : the exponential rate, a constant</li><li> | ||
| - | τ<sub>0</sub> : the average relaxing time in a tumbling | + | τ<sub>0</sub> : the average relaxing time in a tumbling event</li></ul>. |
</div> | </div> | ||
<div class="PKU_context floatR"> | <div class="PKU_context floatR"> | ||
<h3 id="title3">Phototaxis Simulation</h3> | <h3 id="title3">Phototaxis Simulation</h3> | ||
<p> | <p> | ||
| - | With the principles above, we | + | With the principles above, we constructed our simulation system as following: |
</p> | </p> | ||
<ul><li> | <ul><li> | ||
| - | (1) There are | + | (1) There are multiple bacterial cells in the simulation space. |
</li><li> | </li><li> | ||
| - | (2) Cells can not run through the border of | + | (2) Cells can not run through the border of space. |
</li><li> | </li><li> | ||
| - | (3) The cells | + | (3) The cells division is a random process in uniform distribution. Its time scale is tens of minutes (15~30 min). |
</li><li> | </li><li> | ||
(4) There are only two states of the cells --- running and tumbling. | (4) There are only two states of the cells --- running and tumbling. | ||
</li><li> | </li><li> | ||
| - | (5) | + | (5) Tumbling event is a Poisson Process, whose average frequency is set by [CheY<sub>P</sub>] with the equation above. |
</li><li> | </li><li> | ||
| - | (6) Cells | + | (6) Cells fall back to running state from tumbling for a fixed time --- τ<sub>0</sub>. |
</li><li> | </li><li> | ||
(7) Cells run at a fixed speed --- v<sub>0</sub>. | (7) Cells run at a fixed speed --- v<sub>0</sub>. | ||
</li><li> | </li><li> | ||
| - | (8) In SPECS model, the running direction after tumbling is independent | + | (8) In SPECS model, the running direction after tumbling is independent of previous direction; |
| - | while in RapidCell model, the new running direction performs as:<sup><a href="#ref2" title="Dependence of | + | while in RapidCell model, the new running direction performs as:<sup><a href="#ref2" title="Vladimirov, N., et al.(2008). Dependence of bacterial chemotaxis on gradient shape and adaptation rate. PLoS Comput. Biol., 4: e1000242">[2]</a></sup> |
</li></ul> | </li></ul> | ||
<div class="floatC"> | <div class="floatC"> | ||
| - | <img src="/wiki/images/1/1c/Peking2012_Formula009.png" alt="" /> | + | <img src="/wiki/images/1/1c/Peking2012_Formula009.png" alt="" style="width:300px;"/> |
</div> | </div> | ||
<div class="floatC"> | <div class="floatC"> | ||
| - | <img src="/wiki/images/c/ce/Peking2012_Formula010.png" alt="" /> | + | <img src="/wiki/images/c/ce/Peking2012_Formula010.png" alt="" style="width:250px;"/> |
</div> | </div> | ||
<p>where</p><ul><li> | <p>where</p><ul><li> | ||
| Line 66: | Line 66: | ||
<td>Parameter</td><td>Value</td><td>Unit</td><td>Description</td><td>Source</td> | <td>Parameter</td><td>Value</td><td>Unit</td><td>Description</td><td>Source</td> | ||
</tr><tr> | </tr><tr> | ||
| - | <td>v<sub>0</sub></td><td>20</td><td>um/s</td><td>running speed</td><td><sup><a href="#ref4" title="Chemotaxis in Escherichia coli analysed by | + | <td>v<sub>0</sub></td><td>20</td><td>um/s</td><td>running speed</td><td><sup><a href="#ref4" title="Berg, H. C. & Brown, D. A.(1972) Chemotaxis in Escherichia coli analysed by three-dimensional tracking. Nature, 239: 500: 504">[4]</a></sup></td> |
</tr><tr> | </tr><tr> | ||
| - | <td>τ<sub>0</sub></td><td>0.43</td><td>s</td><td>time during a tumbling</td><td><sup><a href="#ref5" title="Real- | + | <td>τ<sub>0</sub></td><td>0.43</td><td>s</td><td>time during a tumbling</td><td><sup><a href="#ref5" title="Turner, L., Ryu, W. S. & Berg, H. C.(2000) Real-time imaging of fluorescent flagellar filaments. J. Bacteriol., 182: 2793: 2801">[5]</a></sup></td> |
</tr><tr> | </tr><tr> | ||
<td>CELL_PERIOD</td><td>15~30</td><td>min</td><td>period of a cell cycle</td><td></td> | <td>CELL_PERIOD</td><td>15~30</td><td>min</td><td>period of a cell cycle</td><td></td> | ||
</tr><tr> | </tr><tr> | ||
| - | <td>[CheA]<sub> | + | <td>[CheA]<sub>t</sub></td><td>5.3</td><td>u mol/L</td><td>total concentration of CheA</td><td><sup><a href="#ref6" title="Emonet, T., Cluzel, P.(2008) Relationship between cellular response and behavioral variability in bacterial chemotaxis. Proc. Natl Acad. Sci. USA, 105(9): 3304: 3309">[6]</a></sup></td> |
</tr><tr> | </tr><tr> | ||
| - | <td>[CheZ]<sub>c</sub></td><td>1.1</td><td>u mol/L</td><td>typical concentration of CheZ</td><td><sup><a href="#ref1" title="Binding of the Escherichia coli response regulator CheY to its target measured in vivo by fluorescence resonance energy transfer | + | <td>[CheZ]<sub>c</sub></td><td>1.1</td><td>u mol/L</td><td>typical concentration of CheZ</td><td><sup><a href="#ref1" title="Sourjik, V., et al.(2002) Binding of the Escherichia coli response regulator CheY to its target measured in vivo by fluorescence resonance energy transfer. Proc. Natl Acad. Sci. USA, 99(20): 12669: 12674">[1]</a></sup></td> |
</tr><tr> | </tr><tr> | ||
| - | <td>[CheY]<sub> | + | <td>[CheY]<sub>t</sub></td><td>9.7</td><td>u mol/L</td><td>total concentration of CheY</td><td><sup><a href="#ref6" title="Emonet, T., Cluzel, P.(2008) Relationship between cellular response and behavioral variability in bacterial chemotaxis. Proc. Natl Acad. Sci. USA, 105(9): 3304: 3309">[6]</a></sup></td> |
</tr><tr> | </tr><tr> | ||
| - | <td>k<sub>Y</sub></td><td>100</td><td>(u mol/L)<sup>-1</sup> s<sup>-1</sup></td><td>phosphorylation rate constant of CheY</td><td><sup><a href="#ref6" title="Relationship between cellular response and behavioral variability in bacterial chemotaxis | + | <td>k<sub>Y</sub></td><td>100</td><td>(u mol/L)<sup>-1</sup> s<sup>-1</sup></td><td>phosphorylation rate constant of CheY</td><td><sup><a href="#ref6" title="Emonet, T., Cluzel, P.(2008) Relationship between cellular response and behavioral variability in bacterial chemotaxis. Proc. Natl Acad. Sci. USA, 105(9): 3304: 3309">[6]</a></sup></td> |
</tr><tr> | </tr><tr> | ||
| - | <td>k<sub>Z</sub></td><td>30/[CheZ]<sub>c</sub></td><td>(u mol/L)<sup>-1</sup> s<sup>-1</sup></td><td>dephosphorylation rate constant of CheY</td><td><sup><a href="#ref6" title="Relationship between cellular response and behavioral variability in bacterial chemotaxis | + | <td>k<sub>Z</sub></td><td>30/[CheZ]<sub>c</sub></td><td>(u mol/L)<sup>-1</sup> s<sup>-1</sup></td><td>dephosphorylation rate constant of CheY</td><td><sup><a href="#ref6" title="Emonet, T., Cluzel, P.(2008) Relationship between cellular response and behavioral variability in bacterial chemotaxis. Proc. Natl Acad. Sci. USA, 105(9): 3304: 3309">[6]</a></sup></td> |
</tr><tr> | </tr><tr> | ||
| - | <td>gamma<sub>Y</sub></td><td>0.1</td><td>s<sup>-1</sup></td><td>decay rate constant of CheY<sub>P</sub></td><td><sup><a href="#ref2" title="Dependence of | + | <td>gamma<sub>Y</sub></td><td>0.1</td><td>s<sup>-1</sup></td><td>decay rate constant of CheY<sub>P</sub></td><td><sup><a href="#ref2" title="Vladimirov, N., et al.(2008). Dependence of bacterial chemotaxis on gradient shape and adaptation rate. PLoS Comput. Biol., 4: e1000242">[2]</a></sup></td> |
</tr><tr> | </tr><tr> | ||
| - | <td>N</td><td>10.3</td><td>1</td><td>the exponential rate of Hill Function of CW (clockwise) bias</td><td><sup><a href="# | + | <td>N</td><td>10.3</td><td>1</td><td>the exponential rate of Hill Function of CW (clockwise) bias</td><td><sup><a href="#ref3" title="Cluzel, P., et al.(2000). An ultrasensitive bacterial motor revealed by monitoring signaling proteins in single cells. Science, 287: 1652: 1655">[3]</a></sup></td> |
</tr><tr> | </tr><tr> | ||
| - | <td>[CheY]<sub>Pc</sub></td><td>3.1</td><td>u mol/L</td><td>the critical concentration of phosphorylated CheY of Hill Function of CW (clockwise) bias</td><td><sup><a href="# | + | <td>[CheY]<sub>Pc</sub></td><td>3.1</td><td>u mol/L</td><td>the critical concentration of phosphorylated CheY of Hill Function of CW (clockwise) bias</td><td><sup><a href="#ref3" title="Cluzel, P., et al.(2000). An ultrasensitive bacterial motor revealed by monitoring signaling proteins in single cells. Science, 287: 1652: 1655">[3]</a></sup></td> |
</tr><tr> | </tr><tr> | ||
<td>r<sub>A</sub></td><td>1/3</td><td>1</td><td>phosphorylation rate of CheA</td><td></td> | <td>r<sub>A</sub></td><td>1/3</td><td>1</td><td>phosphorylation rate of CheA</td><td></td> | ||
</tr></table> | </tr></table> | ||
| - | |||
</div> | </div> | ||
</div> | </div> | ||
<div class="PKU_context floatR"> | <div class="PKU_context floatR"> | ||
| - | <h3 id="title4">Result 1: | + | <h3 id="title4">Result 1: High Contrast Space</h3> |
<p> | <p> | ||
| - | Our first | + | Our first demonstration is phototaxis in a high contrast plate, and we would like to see how cells behave differently in lighting or dark environment. The light intensity of light space was set to 0.8 unit while the light intensity of dark space was set to 0.1 unit with I<sub>0</sub> = 0.5. Here goes the result: |
| - | The | + | |
</p> | </p> | ||
<div> | <div> | ||
| - | + | <img src="/wiki/images/8/8e/Peking2012_PhototaxisRapidCelldot.png" alt="" style="width:500px;"/> | |
| - | + | <p class="description">Figure 1. Phototaxis Simulation Result. Initialized with cells in the center of this space.</p> | |
| - | <p class="description"> | + | |
</div> | </div> | ||
| - | |||
| - | |||
| - | |||
</div> | </div> | ||
<div class="PKU_context floatR"> | <div class="PKU_context floatR"> | ||
| - | <h3 id="title5">Result 2: Light Gradient | + | <h3 id="title5">Result 2: Light-Gradient Space</h3> |
<p> | <p> | ||
| - | + | Just like diffusion (SPECS model in a large population can derive the diffusion equation<sup><a href="#ref7" title="Si, G., Wu, T., Ouyang, Q., Tu, Y.(2012) Pathway-based Mean-field Model for Escherichia coli Chemotaxis. Phys. Rev. Lett., 109: 048101">[7]</a></sup>), a gradient light intensity should cause a population flow. We set the light intensity from 0 to 1 unit in 1 mm, then observed directed movement bias towards light area in this simulation. | |
</p> | </p> | ||
<div> | <div> | ||
| - | + | <img src="/wiki/images/d/d1/Peking2012_PhototaxisRapidCellUniGradInv.png" alt="" style="width:300px;"/> | |
| - | <p class="description"> | + | <img src="/wiki/images/e/e2/Peking2012_PhototaxisRapidCellUniGradLin.png" alt="" style="width:300px;"/> |
| + | <p class="description">Figure 2. Phototaxis Simulation Result. Initialized with cells in a uniform distribution under light gradient.</p> | ||
</div> | </div> | ||
| - | <p> | + | </div> |
| - | + | <div class="PKU_context floatR"> | |
| - | </ | + | <h3 id="title5">Reference</h3> |
| + | <p></p> | ||
| + | <ul class="refer"><li id="ref1"> | ||
| + | 1. Sourjik, V., <i>et al.</i>(2002) Binding of the <i>Escherichia coli</i> response regulator CheY to its target measured in vivo by fluorescence resonance energy transfer. <i>Proc. Natl Acad. Sci. USA</i>, 99(20): 12669: 12674 | ||
| + | </li><li id = "ref2"> | ||
| + | 2. Vladimirov, N., Lovdok, L., Lebiedz, D., and Sourjik, V.(2008). Dependence of bacterial chemotaxis on gradient shape and adaptation rate. <i>PLoS Comput. Biol.</i>, 4: e1000242 | ||
| + | </li><li id = "ref3"> | ||
| + | 3. Cluzel, P., Surette, M., and Leibler, S.(2000). An ultrasensitive bacterial motor revealed by monitoring signaling proteins in single cells. <i>Science</i>, 287: 1652: 1655 | ||
| + | </li><li id = "ref4"> | ||
| + | 4. Berg, H. C. & Brown, D. A.(1972) Chemotaxis in <i>Escherichia coli</i> analysed by three-dimensional tracking. <i>Nature</i>, 239: 500: 504 | ||
| + | </li><li id = "ref5"> | ||
| + | 5. Turner, L., Ryu, W. S. & Berg, H. C.(2000) Real-time imaging of fluorescent flagellar filaments. <i>J. Bacteriol.</i>, 182: 2793: 2801 | ||
| + | </li><li id = "ref6"> | ||
| + | 6. Emonet, T., Cluzel, P.(2008) Relationship between cellular response and behavioral variability in bacterial chemotaxis. <i>Proc. Natl Acad. Sci. USA</i>, 105(9): 3304: 3309 | ||
| + | </li><li id = "ref7"> | ||
| + | 7. Si, G., Wu, T., Ouyang, Q., Tu, Y.(2012) Pathway-based Mean-field Model for Escherichia coli Chemotaxis. <i>Phys. Rev. Lett.</i>, 109: 048101 | ||
| + | |||
| + | |||
| + | Philippe Cluzel. PNAS | ||
| + | </li></ul> | ||
</div> | </div> | ||
</html>{{Template:Peking2012_Color_Epilogue}} | </html>{{Template:Peking2012_Color_Epilogue}} | ||
Latest revision as of 05:05, 26 October 2012


![]()
Summary
We also traced the cells on the macroscopic level. We started from a colony where all cells are competent for phototaxis function (besides, we also considered cell division). We simulated this phototaxis system in high contrast lighting and gradient lighting environment, respectively.
Stochastic Simulation
It is the component of CheYP that directly interacts with the motors and thus influences the mobility of the cell. In details, CheYP can interact with the flagellar motor to induce CW (clockwise) rotation. When flagellar motors rotate CCW (counter-clockwise), they form a bundle to generate a force similar to a worm wheel. However, if some of the flagellar motors rotate CW, the bundle breaks and the cell keeps tumbling. After in CW state for about 0.43s,[2] the flagellar motors return to CCW state and reconstruct the bundle to make the cell run. Since the CW state is triggered by CheYP molecule stochastically and is independent from its state history, this event is a typical Possion Process whose average frequency is determined by the concentration of CheYP with:[3]

where
- FreqCW : the average frequency of CW (clockwise) rotation event
- [CheYP]c : the critical concentration of phosphorylated CheY in this Hill Function
- H : the exponential rate, a constant
- τ0 : the average relaxing time in a tumbling event
Phototaxis Simulation
With the principles above, we constructed our simulation system as following:
- (1) There are multiple bacterial cells in the simulation space.
- (2) Cells can not run through the border of space.
- (3) The cells division is a random process in uniform distribution. Its time scale is tens of minutes (15~30 min).
- (4) There are only two states of the cells --- running and tumbling.
- (5) Tumbling event is a Poisson Process, whose average frequency is set by [CheYP] with the equation above.
- (6) Cells fall back to running state from tumbling for a fixed time --- τ0.
- (7) Cells run at a fixed speed --- v0.
- (8) In SPECS model, the running direction after tumbling is independent of previous direction; while in RapidCell model, the new running direction performs as:[2]


where
- θ : the tumbling angle (angle from origin direction to new direction)
- ρ(θ) : the probability density of tumbling angle in value
- ρ(θ,φ) : probability density of tumbling angle in the 3D space
Parameters are shown as following:
| Parameter | Value | Unit | Description | Source |
| v0 | 20 | um/s | running speed | [4] |
| τ0 | 0.43 | s | time during a tumbling | [5] |
| CELL_PERIOD | 15~30 | min | period of a cell cycle | |
| [CheA]t | 5.3 | u mol/L | total concentration of CheA | [6] |
| [CheZ]c | 1.1 | u mol/L | typical concentration of CheZ | [1] |
| [CheY]t | 9.7 | u mol/L | total concentration of CheY | [6] |
| kY | 100 | (u mol/L)-1 s-1 | phosphorylation rate constant of CheY | [6] |
| kZ | 30/[CheZ]c | (u mol/L)-1 s-1 | dephosphorylation rate constant of CheY | [6] |
| gammaY | 0.1 | s-1 | decay rate constant of CheYP | [2] |
| N | 10.3 | 1 | the exponential rate of Hill Function of CW (clockwise) bias | [3] |
| [CheY]Pc | 3.1 | u mol/L | the critical concentration of phosphorylated CheY of Hill Function of CW (clockwise) bias | [3] |
| rA | 1/3 | 1 | phosphorylation rate of CheA |
Result 1: High Contrast Space
Our first demonstration is phototaxis in a high contrast plate, and we would like to see how cells behave differently in lighting or dark environment. The light intensity of light space was set to 0.8 unit while the light intensity of dark space was set to 0.1 unit with I0 = 0.5. Here goes the result:
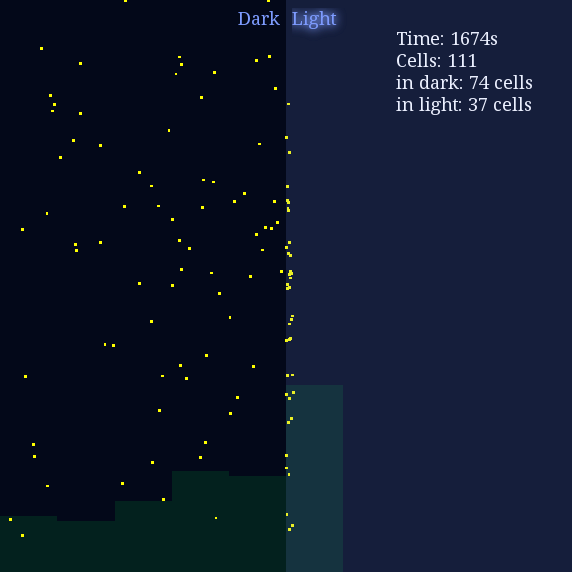
Figure 1. Phototaxis Simulation Result. Initialized with cells in the center of this space.
Result 2: Light-Gradient Space
Just like diffusion (SPECS model in a large population can derive the diffusion equation[7]), a gradient light intensity should cause a population flow. We set the light intensity from 0 to 1 unit in 1 mm, then observed directed movement bias towards light area in this simulation.
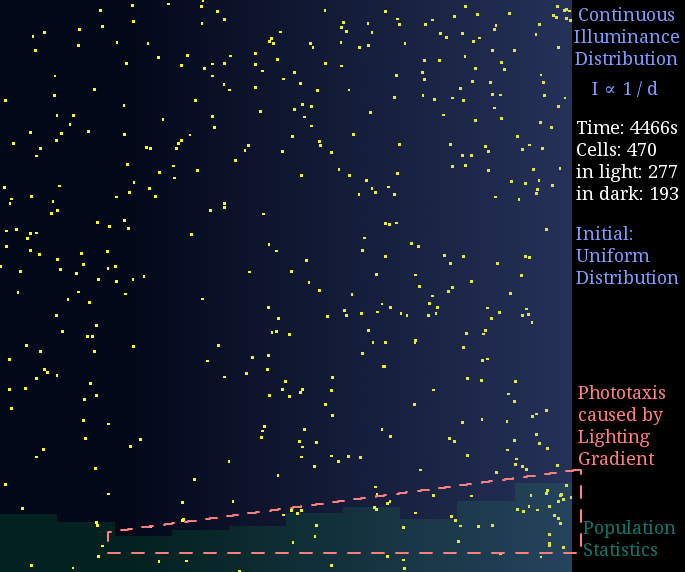
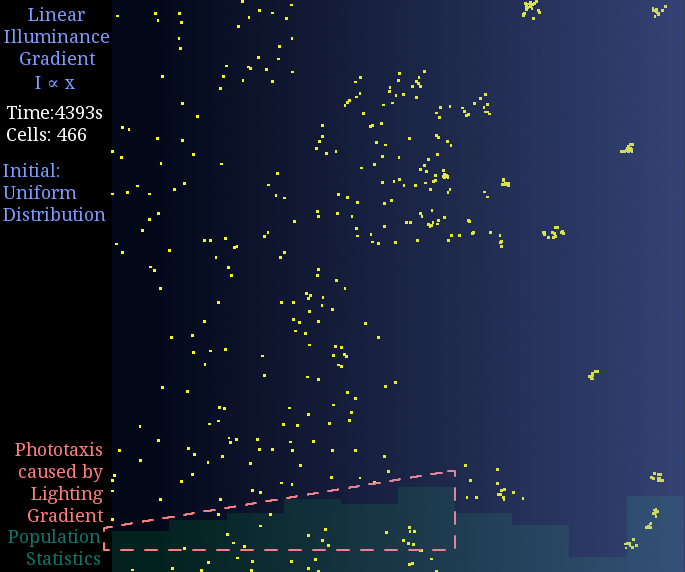
Figure 2. Phototaxis Simulation Result. Initialized with cells in a uniform distribution under light gradient.
Reference
- 1. Sourjik, V., et al.(2002) Binding of the Escherichia coli response regulator CheY to its target measured in vivo by fluorescence resonance energy transfer. Proc. Natl Acad. Sci. USA, 99(20): 12669: 12674
- 2. Vladimirov, N., Lovdok, L., Lebiedz, D., and Sourjik, V.(2008). Dependence of bacterial chemotaxis on gradient shape and adaptation rate. PLoS Comput. Biol., 4: e1000242
- 3. Cluzel, P., Surette, M., and Leibler, S.(2000). An ultrasensitive bacterial motor revealed by monitoring signaling proteins in single cells. Science, 287: 1652: 1655
- 4. Berg, H. C. & Brown, D. A.(1972) Chemotaxis in Escherichia coli analysed by three-dimensional tracking. Nature, 239: 500: 504
- 5. Turner, L., Ryu, W. S. & Berg, H. C.(2000) Real-time imaging of fluorescent flagellar filaments. J. Bacteriol., 182: 2793: 2801
- 6. Emonet, T., Cluzel, P.(2008) Relationship between cellular response and behavioral variability in bacterial chemotaxis. Proc. Natl Acad. Sci. USA, 105(9): 3304: 3309
- 7. Si, G., Wu, T., Ouyang, Q., Tu, Y.(2012) Pathway-based Mean-field Model for Escherichia coli Chemotaxis. Phys. Rev. Lett., 109: 048101 Philippe Cluzel. PNAS


