 "
"
Team:NYU Gallatin/Project/Socializing
From 2012.igem.org
m |
|||
| Line 8: | Line 8: | ||
<li class="menu-308"><a href="/Team:NYU_Gallatin/Parts" title="Our work with the parts registry.">Parts</a></li> | <li class="menu-308"><a href="/Team:NYU_Gallatin/Parts" title="Our work with the parts registry.">Parts</a></li> | ||
<li class="menu-310"><a href="/Team:NYU_Gallatin/Modeling" title="How we put it all together.">Modeling</a></li> | <li class="menu-310"><a href="/Team:NYU_Gallatin/Modeling" title="How we put it all together.">Modeling</a></li> | ||
| - | <li class="menu- | + | <li class="menu-584"><a href="/Team:NYU_Gallatin/Notebook" title="Lab notebooks, news, and photos.">Notebook</a></li> |
<li class="menu-312"><a href="/Team:NYU_Gallatin/Safety" title="Our commitment to safety.">Safety</a></li> | <li class="menu-312"><a href="/Team:NYU_Gallatin/Safety" title="Our commitment to safety.">Safety</a></li> | ||
<li class="menu-313"><a href="/Team:NYU_Gallatin/Attributions" title="Give credit where credit is due.">Attributions</a></li> | <li class="menu-313"><a href="/Team:NYU_Gallatin/Attributions" title="Give credit where credit is due.">Attributions</a></li> | ||
| Line 50: | Line 50: | ||
<div class="content clearfix"> | <div class="content clearfix"> | ||
| - | <center><img style="border: solid black 1px; margin-bottom: 20px;" src="http://farm9.staticflickr.com/ | + | <center><img style="border: solid black 1px; margin-bottom: 20px;" src="http://farm9.staticflickr.com/8178/8048894791_5ebc0b2651_c.jpg" width=683 /></center><div class="field field-name-body field-type-text-with-summary field-label-hidden"><div class="field-items"><div class="field-item even"><!--Load the AJAX API--><script type="text/javascript" src="https://www.google.com/jsapi"></script><script type="text/javascript"> |
<!--//--><![CDATA[// ><!-- | <!--//--><![CDATA[// ><!-- | ||
| Line 65: | Line 65: | ||
function drawChart() { | function drawChart() { | ||
| - | + | // Create the GENDER data table. | |
| - | + | var data = new google.visualization.DataTable(); | |
| - | + | data.addColumn('string', 'Gender'); | |
| - | + | data.addColumn('number', 'Surveyed'); | |
| - | + | data.addRows([ ['Female', 49.4], ['Male', 50.6], ]); | |
| - | + | var options = {'width':200, 'height':200, 'legend':'bottom', chartArea:{left:5,top:5,width:"90%",height:"90%"} }; | |
| - | + | var chart = new google.visualization.PieChart(document.getElementById('chart_gender')); | |
| - | + | chart.draw(data, options); | |
| - | + | ||
| - | + | // Create the AGE data table. | |
| - | + | var data = new google.visualization.DataTable(); | |
| - | + | data.addColumn('string', 'Age'); | |
| - | + | data.addColumn('number', 'Age'); | |
| - | chartArea:{left:5,top:5,width:"90%",height:"90%"} | + | data.addRows([ ['17 or younger', 3], ['18 to 34', 23.8], ['35 to 49', 28.6], ['50 to 64', 34.5], ['65 or older', 10.1], ]); |
| - | }; | + | var options = { 'width':200, 'height':200, 'legend':'bottom', chartArea:{left:5,top:5,width:"90%",height:"90%"} }; |
| - | + | var chart = new google.visualization.PieChart(document.getElementById('chart_age')); | |
| - | + | chart.draw(data, options); | |
| - | + | ||
| - | + | // Create the EDUCATION data table. | |
| - | + | var data = new google.visualization.DataTable(); | |
| - | + | data.addColumn('string', 'Education'); | |
| - | + | data.addColumn('number', 'Percent'); | |
| - | + | data.addRows([ ['Some High School', 1.8], ['High School Diploma', 10.7], ['Some College', 19.0], ['College Degree', 33.9], ['Graduate Degree', 34.5], ]); | |
| - | + | var options = {'width':200, 'height':200, 'legend':'bottom', chartArea:{left:5,top:5,width:"90%",height:"90%"} }; | |
| - | + | var chart = new google.visualization.PieChart(document.getElementById('chart_edu')); | |
| - | + | chart.draw(data, options); | |
| - | + | ||
| - | + | ||
| - | + | // Create and populate the APPROVAL BY TYPE data table. | |
| - | + | var data = google.visualization.arrayToDataTable([ | |
| - | + | ['Type', 'Approve', 'Disapprove', 'No Opinion'], | |
| - | + | ['Food', 35.1, 53.6, 11.3], ['Clothes', 56.5, 29.2, 14.3], ['Fuels', 70.2, 14.9, 14.9], ['Medicine', 70.2, 19, 10.7], | |
| - | + | ]); | |
| - | + | new google.visualization.ColumnChart(document.getElementById('chart_type')). | |
| - | + | draw(data, {width:660, height:400, legend:{position: 'bottom'}, chartArea:{left:25,top:25,width:"95%",height:"80%"}} ); | |
| - | chartArea:{left:5,top:5,width:"90%",height:"90%"} | + | |
| - | }; | + | // Create and populate the APPROVAL BY GENDER data table. |
| - | + | var data = google.visualization.arrayToDataTable([ | |
| - | + | ['Type', 'Men', 'Women'], | |
| - | + | ['Food', 48.2, 21.7], ['Clothes', 74.1, 38.6], ['Fuels', 84.7, 55.4], ['Medicine', 83.5, 56.6], ['GM is Safe', 67.1, 37.3], | |
| - | + | ]); | |
| + | new google.visualization.ColumnChart(document.getElementById('chart_type_gender')). | ||
| + | draw(data, {width:660, height:400, legend:{position: 'bottom'}, chartArea:{left:25,top:25,width:"95%",height:"80%"}} ); | ||
| + | |||
| + | // Create and populate the APPROVAL BY AWARENESS data table. | ||
| + | var data = google.visualization.arrayToDataTable([ | ||
| + | ['Type', 'Food', 'Clothes', 'Fuels', 'Medicine', 'GM is Safe'], | ||
| + | ['Unaware', 22.9, 45.8, 50, 62.5, 43.8], ['Some Awareness', 41, 63.9, 78.7, 77, 62.3], ['Aware', 39, 57.6, 78, 69.5, 49.2], | ||
| + | ]); | ||
| + | new google.visualization.ColumnChart(document.getElementById('chart_type_aware')). | ||
| + | draw(data, {width:660, height:400, legend:{position: 'bottom'}, chartArea:{left:25,top:25,width:"95%",height:"80%"}} ); | ||
| + | } | ||
| - | |||
| - | |||
| - | |||
| - | |||
| - | |||
| - | |||
| - | |||
| - | |||
| - | |||
| - | |||
| - | |||
| - | |||
| - | |||
| - | |||
| - | |||
| - | |||
| - | |||
| - | |||
| - | |||
| - | |||
| - | |||
//--><!]]> | //--><!]]> | ||
| - | </script><h1> | + | </script><h1>Exploring Consumer Reactions</h1> |
<p>The biological portion of our project altered the cellulose produced by <i>acetobacter xylinum</i> for use as a fabrication material in consumer products. Accordingly, the human practices portion of our project focused on the consumer market for genetically modified (GM) products and sought to identify the primary demographic and psychographic predictors of approval for those products. We used both quantitative and qualitative measures to research this question.</p> | <p>The biological portion of our project altered the cellulose produced by <i>acetobacter xylinum</i> for use as a fabrication material in consumer products. Accordingly, the human practices portion of our project focused on the consumer market for genetically modified (GM) products and sought to identify the primary demographic and psychographic predictors of approval for those products. We used both quantitative and qualitative measures to research this question.</p> | ||
<p>The quantitative measure was in the form of a ten item survey administered to a national sample via the world wide web. The survey asked respondents whether they were aware that GM food and cotton were already sold in stores, whether they approved of GM food, clothes, fuels, and medicine, how safe they perceived GM products to be, and basic demographic information including their age, gender, and highest level of education completed. A 37 percent response rate yielded 168 usable responses, and results are reported with 95 percent confidence and a confidence interval of 7.5 percent. We found that product type, gender, and awareness of existing GM products were all predictors of approval for GM products. We also found that women were significantly less likely to approve of GM products (p | <p>The quantitative measure was in the form of a ten item survey administered to a national sample via the world wide web. The survey asked respondents whether they were aware that GM food and cotton were already sold in stores, whether they approved of GM food, clothes, fuels, and medicine, how safe they perceived GM products to be, and basic demographic information including their age, gender, and highest level of education completed. A 37 percent response rate yielded 168 usable responses, and results are reported with 95 percent confidence and a confidence interval of 7.5 percent. We found that product type, gender, and awareness of existing GM products were all predictors of approval for GM products. We also found that women were significantly less likely to approve of GM products (p | ||
</p><p>As a qualitative measure of opinion concerning GM products, we created an artificial store selling GM products at a widely attended street festival in Brooklyn, NY and interviewed visitors concerning their perceptions of actual and hypothetical GM products on display at the store. We interviewed women in particular and found that the perception of GM products as unsafe or untrustworthy is a likely cause of disapproval for GM products.</p> | </p><p>As a qualitative measure of opinion concerning GM products, we created an artificial store selling GM products at a widely attended street festival in Brooklyn, NY and interviewed visitors concerning their perceptions of actual and hypothetical GM products on display at the store. We interviewed women in particular and found that the perception of GM products as unsafe or untrustworthy is a likely cause of disapproval for GM products.</p> | ||
<h1>The Survey</h1> | <h1>The Survey</h1> | ||
| - | <p>Our human practices portion consists of a study concerning relationships among awareness, education, and approval of different genetically modified products. e.g. Do people care whether cotton is genetically engineered as much as food? The survey results were collected online as well as our shoppe at Atlantic Antic from volunteers off the street. </p> | + | <p><a href="/Team:NYU_Gallatin/Project/Socializing/Survey"><img src="http://farm9.staticflickr.com/8452/8048903468_10fa09f84d_m.jpg" style="float: left; margin-right: 10px; margin-bottom: 10px" /></a>Our human practices portion consists of a study concerning relationships among awareness, education, and approval of different genetically modified products. e.g. Do people care whether cotton is genetically engineered as much as food? The survey results were collected online as well as our shoppe at Atlantic Antic from volunteers off the street. </p> |
<p><a href="/Team:NYU_Gallatin/Project/Socializing/Survey">Take the survey yourself!</a></p> | <p><a href="/Team:NYU_Gallatin/Project/Socializing/Survey">Take the survey yourself!</a></p> | ||
| - | <h2>Methodology</h2> | + | <h2 style="clear: both">Methodology</h2> |
<ul><li>10 item web survey regarding genetically modified (GM) products: | <ul><li>10 item web survey regarding genetically modified (GM) products: | ||
<ul><li>Awareness that GM food and cotton are sold (2 items).</li> | <ul><li>Awareness that GM food and cotton are sold (2 items).</li> | ||
| Line 157: | Line 147: | ||
<div id="chart_gender_title" style="display: inline-block; width: 200px; background: white; color: black; text-align: center;">Age</div> | <div id="chart_gender_title" style="display: inline-block; width: 200px; background: white; color: black; text-align: center;">Age</div> | ||
<div id="chart_gender_title" style="display: inline-block; width: 200px; background: white; color: black; text-align: center;">Education</div> | <div id="chart_gender_title" style="display: inline-block; width: 200px; background: white; color: black; text-align: center;">Education</div> | ||
| + | </div> | ||
| + | <h2>Results</h2> | ||
| + | <p>The results of our survey showed some interesting insights into the way different types of people view GM products.</p> | ||
| + | <h3>Approval Varies by Type</h3> | ||
| + | <div style="background: white; padding: 15px; text-align: center; -moz-border-radius: 15px; border-radius: 15px;"> | ||
| + | <div id="chart_type" style="display: inline-block"></div> | ||
| + | </div> | ||
| + | <h3>Approval Varies by Gender</h3> | ||
| + | <p>Women seem to approve of GM products much less than men.</p> | ||
| + | <div style="background: white; padding: 15px; text-align: center; -moz-border-radius: 15px; border-radius: 15px;"> | ||
| + | <div id="chart_type_gender" style="display: inline-block"></div> | ||
| + | </div> | ||
| + | <h3>Effect of Awareness on Approval</h3> | ||
| + | <p>GM Awareness has a limited effect on approval.</p> | ||
| + | <div style="background: white; padding: 15px; text-align: center; -moz-border-radius: 15px; border-radius: 15px;"> | ||
| + | <div id="chart_type_aware" style="display: inline-block"></div> | ||
</div> | </div> | ||
<h2>Summary</h2> | <h2>Summary</h2> | ||
Revision as of 00:44, 3 October 2012
Our Human Practices

Exploring Consumer Reactions
The biological portion of our project altered the cellulose produced by acetobacter xylinum for use as a fabrication material in consumer products. Accordingly, the human practices portion of our project focused on the consumer market for genetically modified (GM) products and sought to identify the primary demographic and psychographic predictors of approval for those products. We used both quantitative and qualitative measures to research this question.
The quantitative measure was in the form of a ten item survey administered to a national sample via the world wide web. The survey asked respondents whether they were aware that GM food and cotton were already sold in stores, whether they approved of GM food, clothes, fuels, and medicine, how safe they perceived GM products to be, and basic demographic information including their age, gender, and highest level of education completed. A 37 percent response rate yielded 168 usable responses, and results are reported with 95 percent confidence and a confidence interval of 7.5 percent. We found that product type, gender, and awareness of existing GM products were all predictors of approval for GM products. We also found that women were significantly less likely to approve of GM products (p
As a qualitative measure of opinion concerning GM products, we created an artificial store selling GM products at a widely attended street festival in Brooklyn, NY and interviewed visitors concerning their perceptions of actual and hypothetical GM products on display at the store. We interviewed women in particular and found that the perception of GM products as unsafe or untrustworthy is a likely cause of disapproval for GM products.
The Survey
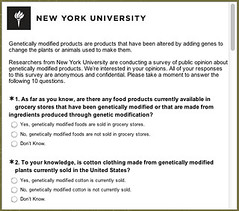 Our human practices portion consists of a study concerning relationships among awareness, education, and approval of different genetically modified products. e.g. Do people care whether cotton is genetically engineered as much as food? The survey results were collected online as well as our shoppe at Atlantic Antic from volunteers off the street.
Methodology
- 10 item web survey regarding genetically modified (GM) products:
- Awareness that GM food and cotton are sold (2 items).
- Approval for GM food, clothes, fuel and medicine (4 items).
- Perceived safety of GM products (1 item).
- Age, gender and education (3 items).
- Respondents were recruited by a survey research firm using email and online advertising, and through social networks.
- Most respondents received $0.50 to a charity or the chance to win $100 in an online sweepstakes.
- Survey administered the week of 9/21/12.
Sample Overview
- National sample, including more than 50 U.S. metro areas.
- 37 percent response rate, 168 usable responses.
Results
The results of our survey showed some interesting insights into the way different types of people view GM products.
Approval Varies by Type
Approval Varies by Gender
Women seem to approve of GM products much less than men.
Effect of Awareness on Approval
GM Awareness has a limited effect on approval.
Summary
- Product type, gender, awareness all affect approval for GM products.
- Increasing GM awareness primarily influences undecideds.
- Age and education showed no significant effect.
- Results are 95 percent confidence +/- 7.5 percent.
- Further research needed to examine the mechanism affecting approval. We believe perceived risk versus reward and emotions of disgust and fear are likely drivers.
iGEM
The International Genetically Engineered Machine (iGEM) Foundation is dedicated to education and competition, advancement of synthetic biology, and the development of open community and collaboration.
![]()