Team:Cambridge/Project/DesignProcess
From 2012.igem.org
Contents |
Design Process
Every good design process must have a clear aim. Ours was to take a step towards realising the full potential of already heavily investigated parts, in this case biosensors, by developing a prototype kit which could be used in real-world applications effectively and practically. In other words, engineering user-friendly products with biobricks at the foundation, aimed at the end user. Our team realised the potential of the plethora of characterised biobricks found in the registry, not only for the distant future but for today by providing humanity with new, useful, biological products.
Market Research
Having decided that the primary aim of our project was the design of a practical useful product, the first thing we needed was to find its potential use as well as a possible market. The market should fulfill at least three requirements:
- Face a real problem which could be attacked by our product.
- Have the financial capacity to obtain/create our product.
- Be currently in the state where access to similar equipment is limited, and therefore the impact of our solution would be maximised
We aimed to tackle issues concerning the standard of living of people, in particular.
More details about our market research can be found in our Human Practices page
Goals
As stated in our project aims and justified by the market reasearch above we wanted to develop a standard for biosensors that is reliable, affordable, portable, open-source, accessible and relevant. These different attributions require a little more discussion before a formal Design process can begin. The formal design goals for our project are the development of:
- an output that is reliable, reproducible and most importantly quantitative.
- robust, standard platform for biosensing inputs.
- a system for storage and distribution of biosensors for straightforward use in multiple applications.
- a system that is rooted in real world applications that can bring about a positive change in the world
Systems
Inputs
It's common sense that without a reliable input system, output systems, however robust, cannot be relied upon to give meaningful results. It is therefore important that any input used for a biosensor is well characterised (with response curves) under different conditions. However, for an effective revolution in biosensing we would also like a standard platform for sensing a multitude of analytes. This would allow for better characterisation and all additional information about function under different conditions to be acquired with one less parameter that needs to be changed. We would also like the response curves to be relatively linear across a wide range such that different toxicity thresholds are detectable using the same system. We would also like a system that could be designed "from scratch" in future such that there is no need for an existing sensing mechanism in an organism to be found before implementation in a biosensor can take place. The input must therefore have the following attributes:
- A decoupling between the sensing mechanism and its interface with the output system.
- Highly specific analyte discrimination.
- An output regulation system that is highly proportional to the concentration of analyte present.
- The ability to be designed for specific analytes in a methodical way that could be assisted with software tools.
Processing
As all biosensors currently in the registry only use a single output to relay information about the concentration of an analyte, there is great potential for cell growth phase, density, culture inhomogeneity and productivity to vary between assays and this often leads to poorly reproducible and unreliable results. We therefore desire some processing to be performed (without specifying where in the whole system yet) that factors these variables in and allows for a much more accurate readout. With accuracy also comes the ability to provide numerical readouts provided that the output system is geared up for this purpose. We also desire an ability to tune the circuit based on what range of input concentrations we are looking at such that high accuracy can be achieved. The processing system must therefore have the following attributes:
- The ability to compensate for culture variability between assays
- The ability to make calculations over a wide range of concentrations with similar, high levels of precision across this range.
Outputs
In order for commercial success of a project that fits our goals it is absolutely vital that an accurate, quantitative, robust and flexible output exists to relay information to a user that is an accurate representation of the processed input. Outputs fitting this description are commonplace in nearly all other scientific fields where the ability to collect and process data has not only eased interpretation of experiments but also allowed a much faster development of understanding and ultimately technology in those fields. in biology, however, due to the complexity of the systems under scrutiny, it has been difficult to design such outputs and where methods have been found they are normally very expensive. We therefore desire an output with the following characteristics:
- Provides reproducible, quantitative data under many environmental conditions with small error margins.
- Displays data to a user in an intuitive manner that is easy to interpret.
- Be flexible to support use in multiple environments
- Does not require specific environmental domains to leave an undistorted post-processing signal.
- Easy to interface with data processing tools
- The ability to provide support multiple readouts from different assays.
- Cheap
Storage & Distribution
If our project is to have any meaning or impact on sensing applications, suitable plans and design considerations must be in place such that our biosensing platform can be packaged and distributed easily and cheaply, whether it be for high tech testing purposes or field applications in places lacking appropriate infrastructure for e.g. cooling, large or electrical currents.
Detailed investigations
Inputs - Detailed
Processing - Detailed
Outputs - Detailed
Storage & Distribution - Detailed
Solution
We will now try to demonstrate how the developments we have made during our project have tackled the aims we set out to fulfil - within the constraints of a single summer long project run by undergraduates of course!
RiboSense
Ratiometrica
Luciferase and instrumentation
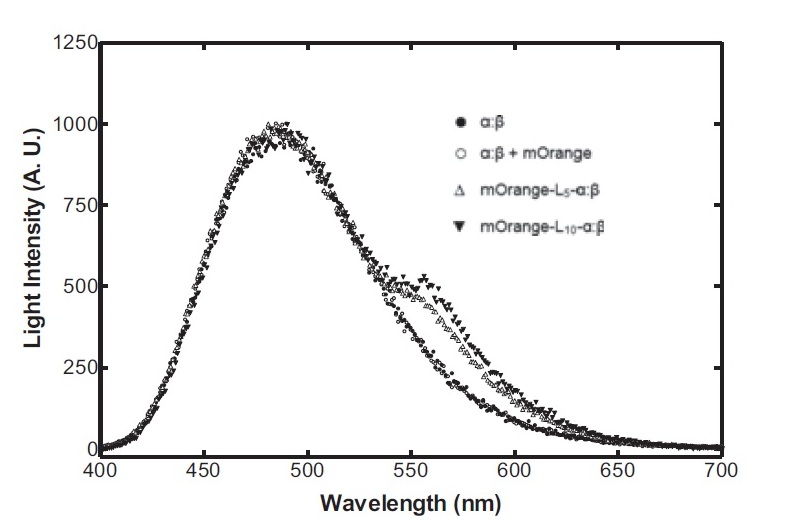
Having come across the OFP-luciferase fusion, the emission spectra of which appeared sufficiently distinct from that of the normal bacterial luciferase (a fairly distinctive blue), it became clear to the team that this would be a great opportunity for making our own instrumentation, both hardware and software. The difference could be identified by simple photo-resistors (70kΩ/200kΩ) and coloured filter gels. The emission spectra of the OFP/luciferase fusion is shown below:
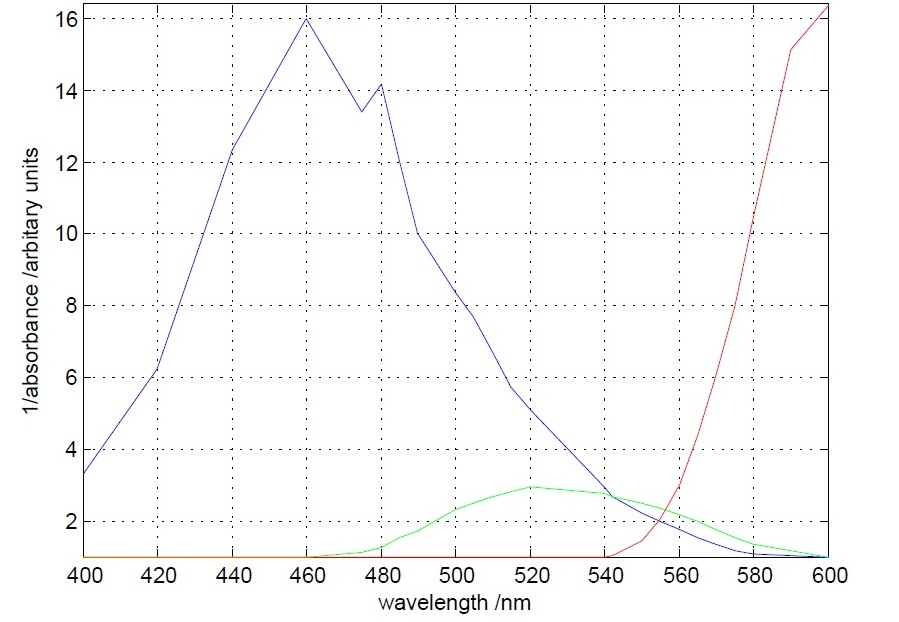
The first experiment to be done was the measurement of the absorbance (actually the inverse of it) of different theatrical filter gels. The target was to differentiate the 560 nm peak to the 490 nm peak. This was accomplished, as it can be seen below, by one blue and one orange filter gel.
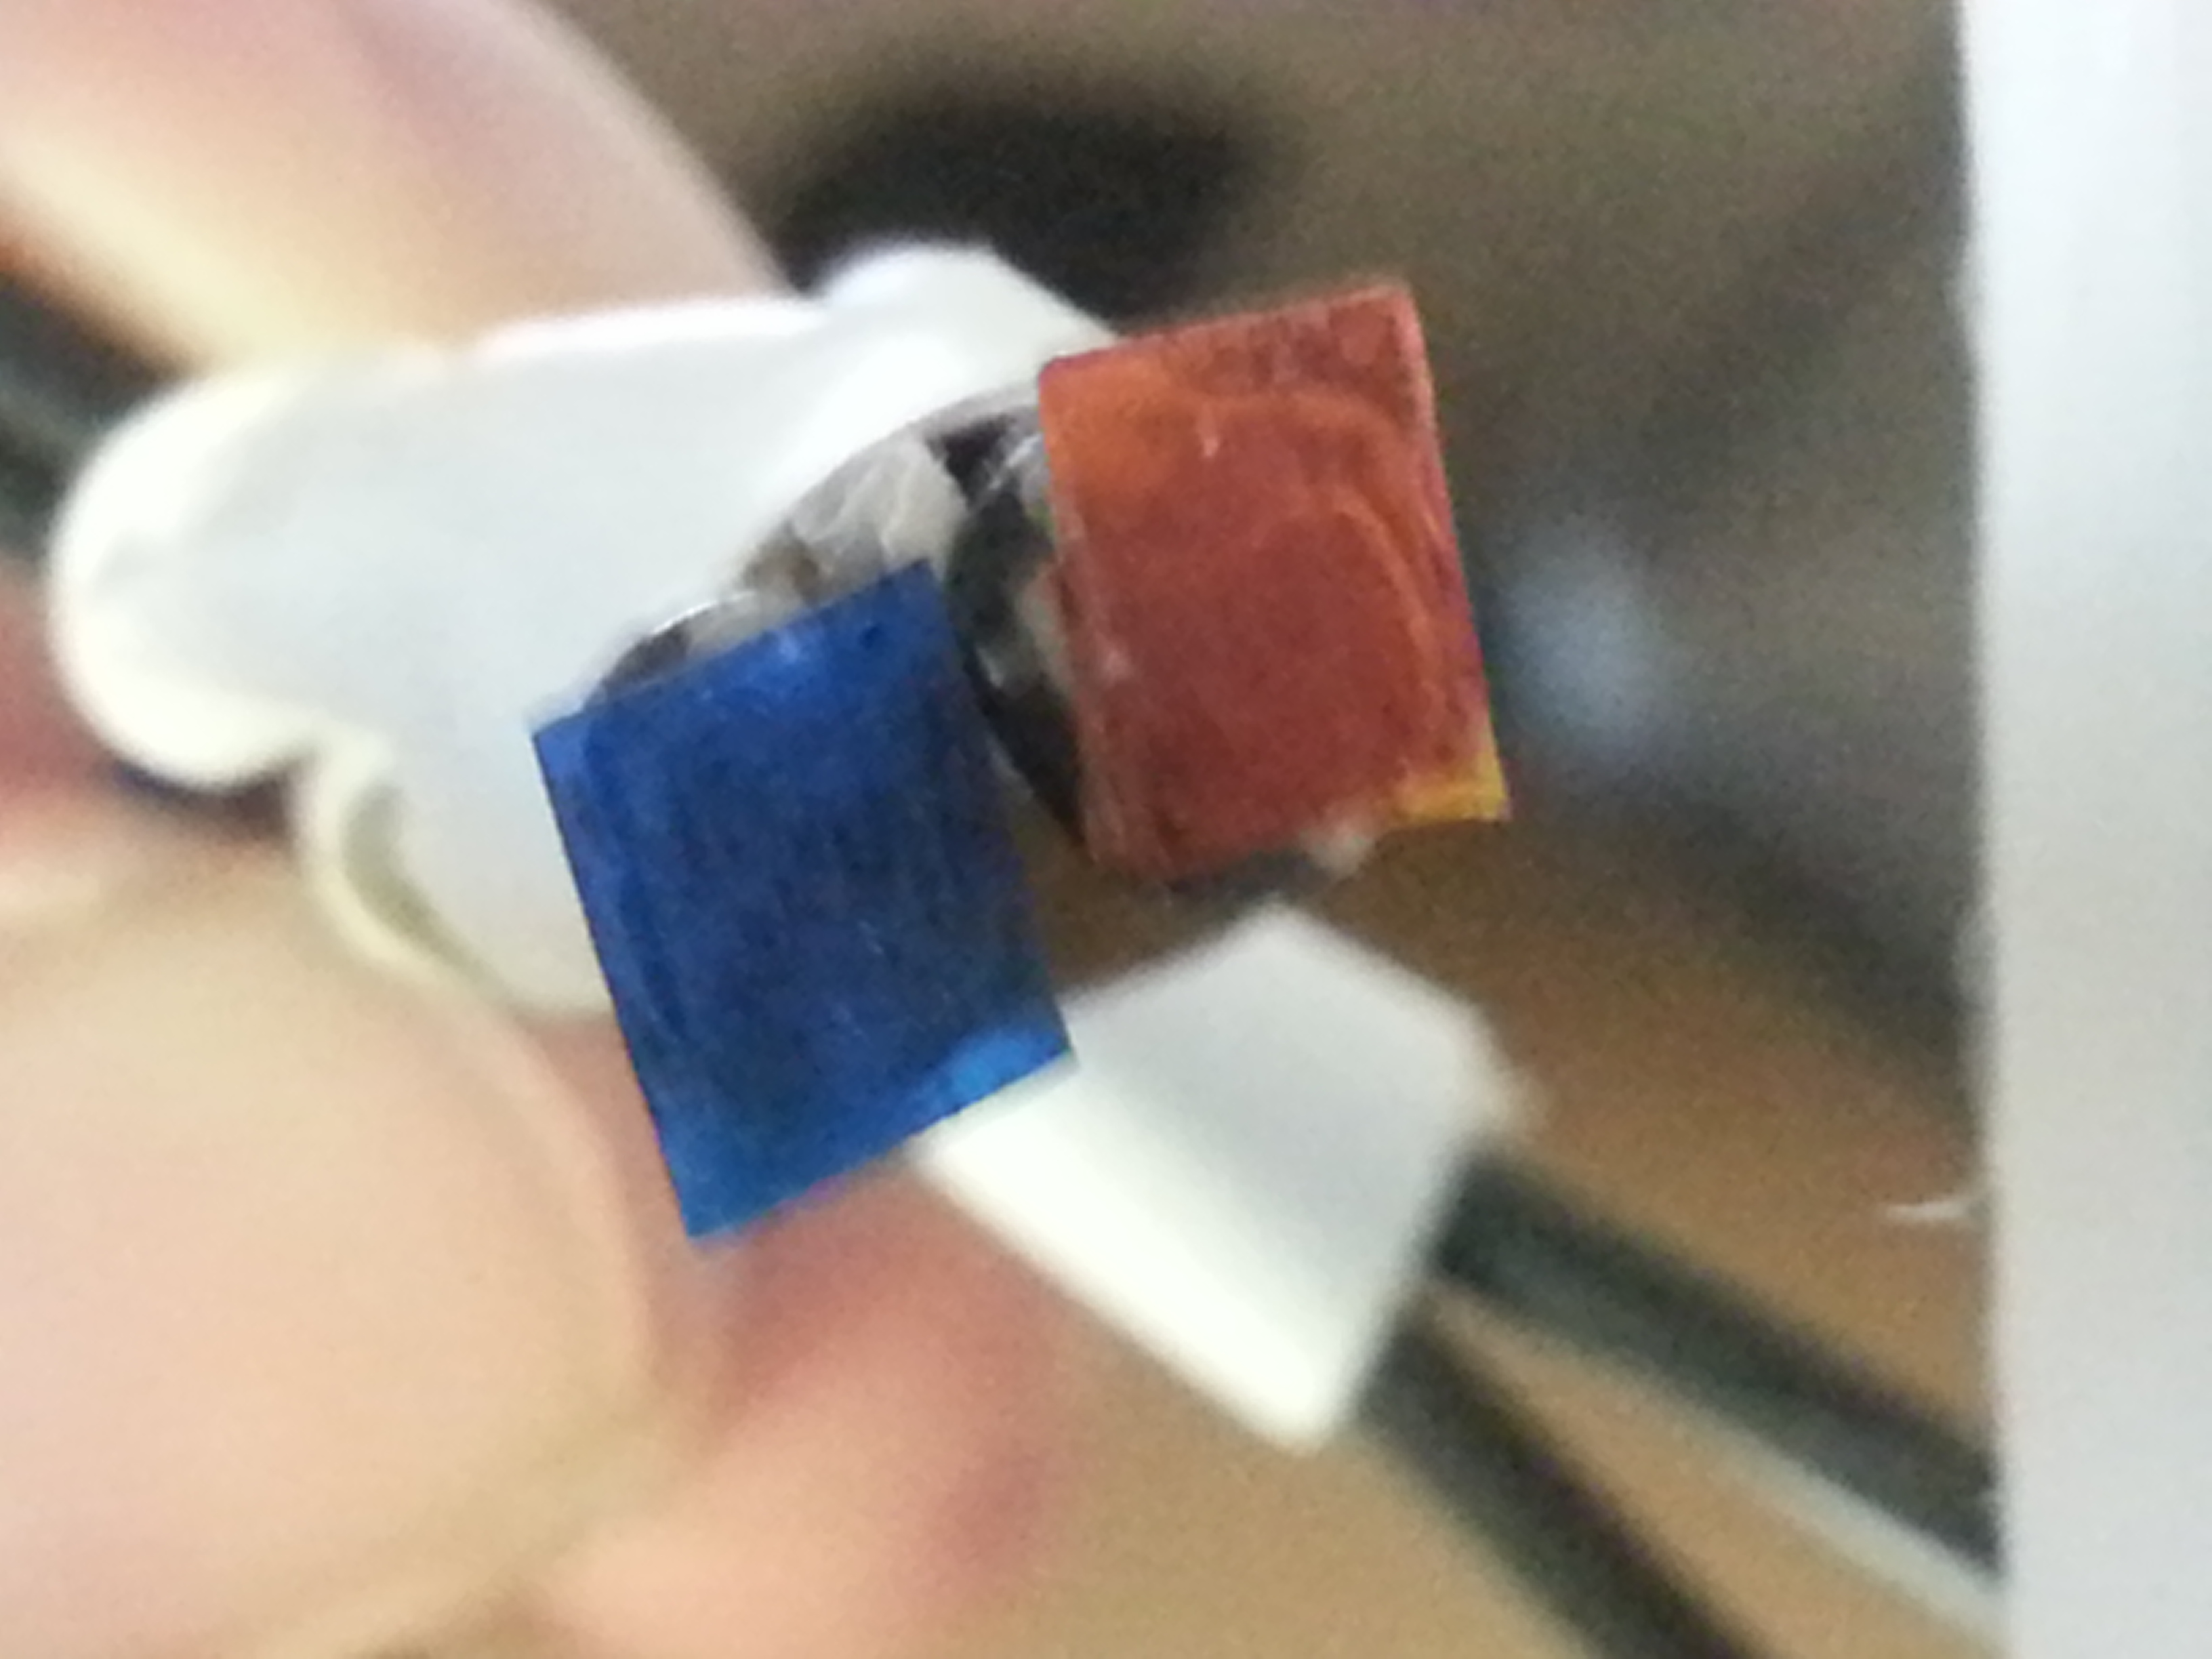
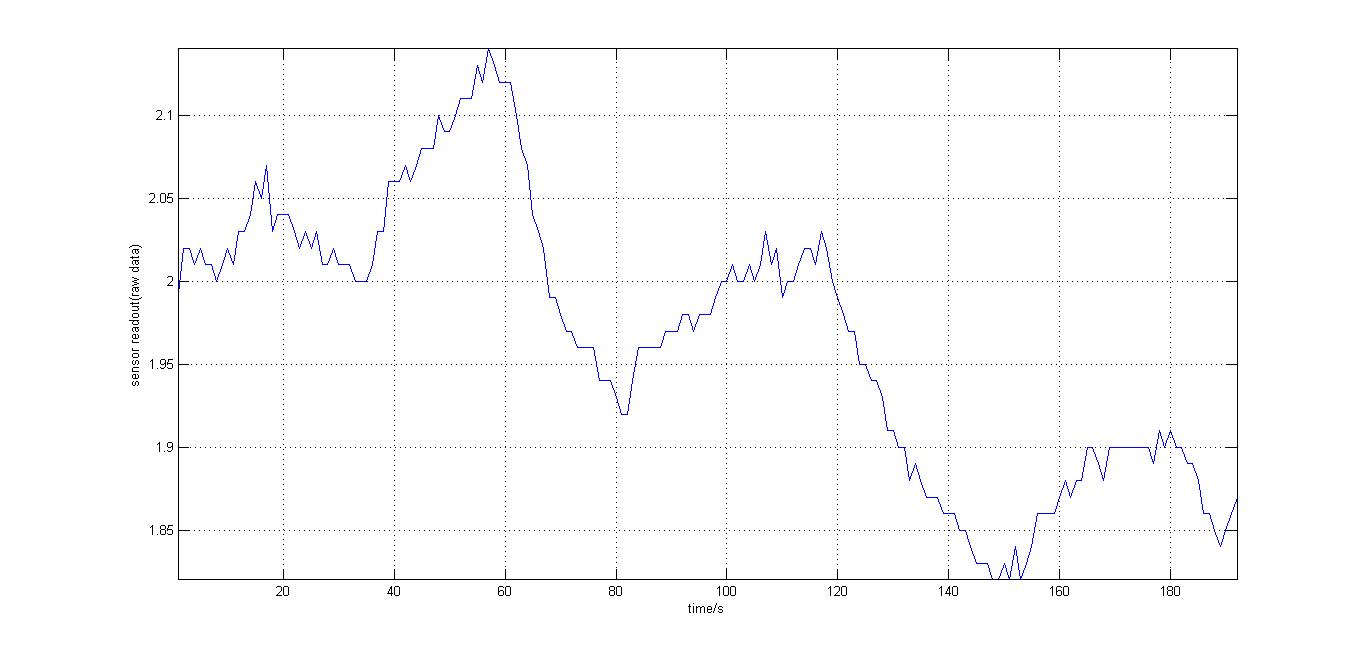
The second experiment to be done was the testing of the sensor with luciferase-producing E.Coli with lux genes, taken from the 2010 Cambridge team. The experiment was conducted by moving the tube containing these bacteria towards and away from our sensor (shown on the right). The results were again very encouraging, showing that the sensor is certainly reacting to even that minute amount of light.
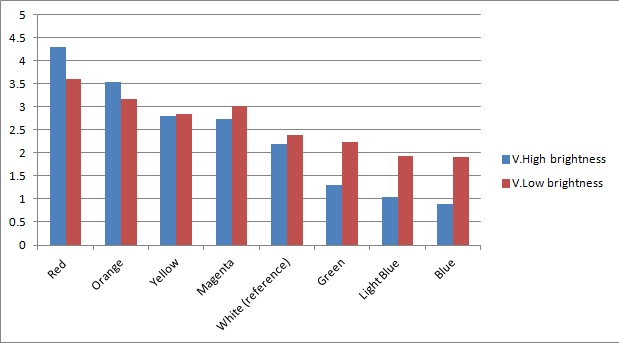
Now that the sensor was made and tested for sensitivity, what we needed to test was that our circuitry identifies different frequencies (colours) of light. As can be seen below, orange and blue are above and below respectively from the white light which is taken as our reference point. The data was taken using a constant intensity of light for each case (V.High and V.Low brightness). This was done with the aid of an Android phone and a specialised software application, called Color Flashlight, downloaded from the official Market. As expected due to the potential-divider setup of our circuitry, orange and red frequencies provided us with a higher voltage accross the LDR with the blue filter, as the resistance of the LDR with the orange filter decreases, whereas the opposite effect happened with blue light. Furthermore, the reason that the white reference point is a bit lower than 2.5V which could be expected for a non-biased circuitry (as we use 5V in the circuitry), is because we use resistors of total net resistance 1.67 kΩ before the blue LDR, in order to bias the circuitry towards blue (i.e. decreasing the starting value) and thus making orange light having more impact when present. This is done in order to allow for the fact that the peak at 560nm (Orange) in MOrange/luciferase fusion spectrum is lower than the one at 490 nm (Blue).
As the major part of the instrumentation, the bio-electronic interface, was made and tested, now the peripheral parts had also to be implemented. This includes the mechanical chassis of the prototype, the electronics/mechatronics (sensory and motory) components and of course the software. A full analysis of the finished hardware/software can be seen in our Intstrumentation page. Below, the videos showing our instrumentation in action can be seen.
Sporage and Distribution
Costing
One of the most important motives for our project was a low-cost solution.
Instrumentation Cost:
Arduino Experimentation Kit $25.00
Light - dependent resistors 70kΩ/200kΩ $2.00
Colored Gel Filters $1.00
Materials for mechanical chassis $5.00
Total $33.00
Optional: Bluesmirf Gold Bluetooth Modem $50.00
Conclusions
 "
"
