Team:Chalmers-Gothenburg/Modelling
From 2012.igem.org
Modelling
Mathematical models are increasingly used to study certain aspects of signal transduction pathways, i.e. robustness against concentration variations [1], threshold properties and bistability [2] etc.
In an attempt to illustrate and understand the dynamics of our modified Saccharomyces cerevisiae (yeast) we created a complete mathematical model for the sequence of events when the hCG hormone binds to our modified receptor in the yeast (LH/CG receptor) and in the end starts an indigo production (click here for more information). Our model is based on the yeast pheromone pathway (click here for more information) [3].
The aim or goal of the model was to use it to analyze and understand where possible problems would occur in the lab and also to make some predictions, eg. estimates of how large concentrations of hCG is needed to, at least in theory, give an output signal, that is for indigo to be produced.
For molecules to enter yeast they must pass through a cell wall with limited permeability. Since hCG is a relatively large molecule and recent studies claim that it is too big to pass through the cell wall we also modeled the diffusion of hCG through the yeast cell wall. This to get some estimates if it is at all possible for the hCG to pass through to the receptor on the cell membrane with the cell wall intact or if it is necessary to delete the cell wall or at least increase its permeability.
Modeling the pathway of hCG in the modified yeast
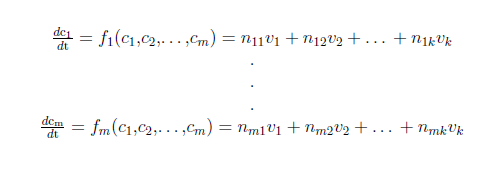
For a biochemical reaction system it is common practice to use a set of ordinary differential equations (ODE’s) to describe the changes in the concentration of a biochemical species. In a system of m biochemical species with concentration ci (i=1,…,m) and k biochemical reactions with rates vj (j=1,…,k) you can write:
where nij denote the stoichiometric coefficients.
Our model was based on a complete mathematical model of the yeast pheromone pathway (see article [4]). By modifying this model to fit our project description we were able to discern some interesting results. The changes made are that instead of having the α-pheromone bind to the Ste2-receptor we have hCG binding to the LH/CG-receptor. Also, as mentioned in the project description, the Sst2 negative feedback regulator is taken out of the system along with the cell cycle arrest reaction.
With these modifications made from the original model we made a few assumptions for our model:
- The MAPK cascade will function as usual once the hCG has bound to the LH/CG- receptor.
- The cell cycle arrest can be deleted from the model without changing any other parts in the model since it has no feedback on the rest of the system.
- The rates used for the reactions (ki in the ODE system) are the same in our model as in the model for the yeast pheromone pathway with the exception of the degradation of hCG, the hCG binding to the LH/CG receptor and the rate in which the LH/CG receptor starts the G-protein cycle.
The modifications made to the model can be seen in figure 1 below.
Figure 1: Overview of the mathematical model for the modified yeast.
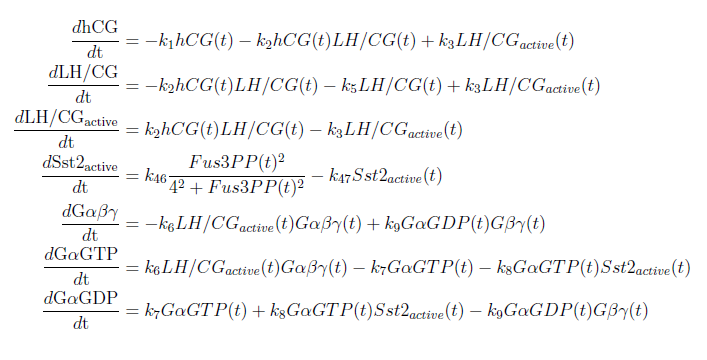
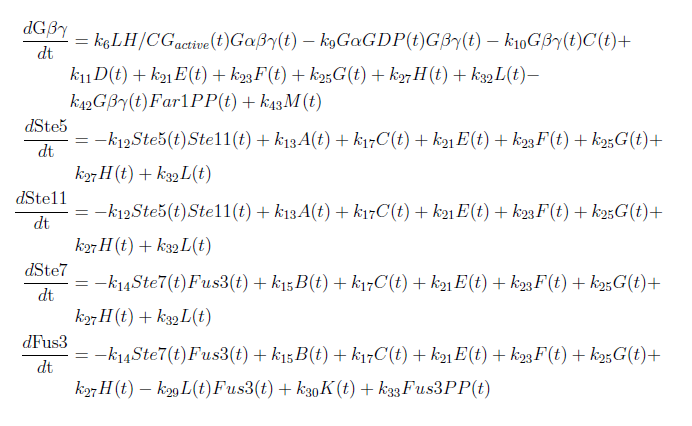
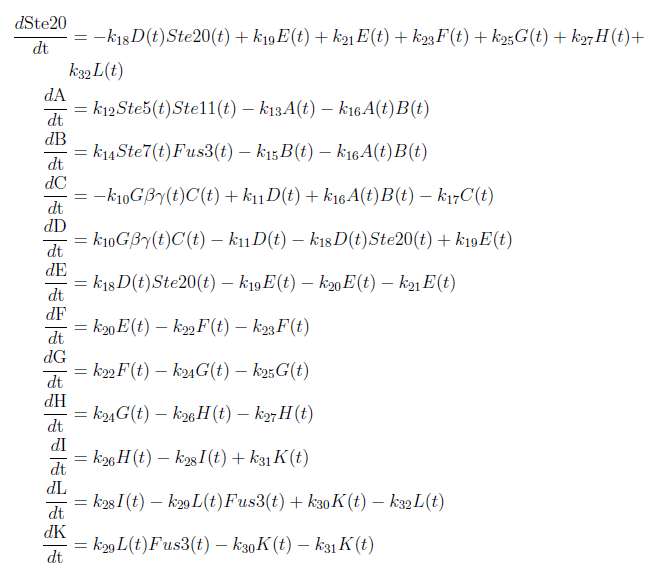
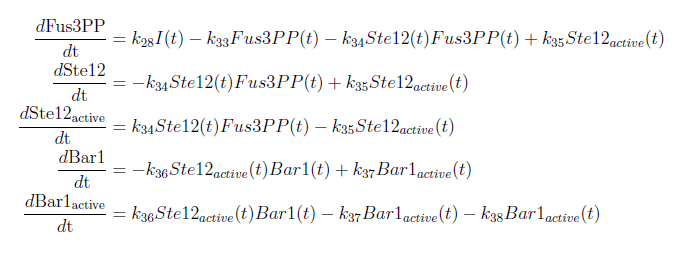
With these modifications made the system of ODE’s for our model are as follows:
With this complete mathematical model it is possible to analyze the ODE system and to make certain predictions. To do this we used MATLAB to solve the system and to plot our results.
The first thing we analyzed was the robustness of the system, that is we changed the rates ki of the reactions in the system to see how sensitive it is for such changes. As mentioned before one assumption for our model was that all the rates are the same as in the original model (see [4]) except for the degradation of hCG (k1), the rate in which the hCG binds to the LH/CG receptor (k2), the rate that the hCG and LH/CG receptor disassociate (k3) and the rate that starts the G-protein cycle (k6) so those were the only ones changed. Since it is unknown how these rates changes with our modified yeast we tried different ones to get some results. It is known that the degradation of hCG is much slower than that of the α-pheromone so that particular rate (k1) was changed to be better than the original one. For the other rates we assumed that the original rates (those used in the original model [4]) was the best ones and we gradually made them worse.
One of the main predictions we wanted to make was to see how much Ste12 would be produced given an initial concentration of hCG. This since Ste12 is what starts off the indigo production. We therefore solved the system with different rates used for k1, k2, k3 and k6 and an initial concentration of hCG starting on 0.0067 nM (which is the concentration with a pregnant woman 3 weeks since the last menstrual bleeding) and then changes according to how the hCG concentration changes with a pregnant woman [5]. The other initial values was the same as in the article [4]. The result of this can be seen in figure 2.
Figure 2: Concentration of Ste12 for different parameters and different initial concentrations of hCG.
As can be seen from figure 2 the parameters make a big difference for small initial values of hCG but as the concentration increases the parameters make less difference for the output.
The other main prediction we wanted to make from the model was to see how the deletion of the Sst2 negative feedback would affect the system. We therefore solved the ODE system with and without the Sst2 feedback. These two systems was solved with the same initial concentrations of hCG as before and with the rates we thought most plausible (the rates named bad yeast parameters in figure 2). The result is visible in figure 3 below.
Figure 3: Concentration of Ste12 with and without the Sst2 negative feedback and with different initial concentrations of hCG.
References
[1] Batchelor E, Goulian M. 2003. Robustness and the cycle of phosphorylation and dephosphorylation in a two-component regulatory system. Proc Natl Acad Sci USA 100: 691-696. [2] Levchenko A, Bruck L, Sternberg PW. 2000. Scaffold proteins may biphasically affect the levels of mitogen-activated proteinkinase signaling and reduce its threshold properties. Proc Natl Acad Sci USA 97: 5818-5823. [3] Bardwell L. A walk-through of the yeast mating pheromone response pathway. Peptides vol. 26, Issue 2, February 2005, p. 339-350. [4] Klipp E, Kofahl B. 2004. Modelling the dynamics of the yeast pheromone pathway. Yeast 21: 831-850. [5] Cole L A. 2010. Biological finction of hCG and hCG-related molecules. Reproductive Biology and Endocrinology 8:102
</div>
 "
"


