Team:ZJU-China/models.htm
From 2012.igem.org
01 Molecular Modeling
In this year’s project, we try to make reasonable design of riboscaffolds by ourselves. Due to the current experimental conditions, we could not know what exactly happens to our riboscaffolds in the cell. Its folding process, binding with proteins and ligand, and the allosteric transition are of interests, since these are considerations for a reasonable design. Luckily, we have simulation tools for molecular modeling which can provide hints about what may happen theoretically in the intracellular environment. Although molecular modeling is often considered as professional work in which knowledge of different disciplines such as biology, physics, chemistry, mathematics and computer science as well as previous experience all contribute to good results, our team is willing to take a step in this field and get preliminary results.
02 Scaffold or Non-scaffold
As explained before, the RNA scaffold brings the two enzymes (MS2 and PP7) closer, which improve the reaction rate of pathways. It seems magical that the reaction rate would be improved when two enzymes are close to each other. Then some questions are emerging. How faster it would be when two enzymes are in a RNA scaffold? What are the factors that will affect the efficiency of pathways? Those are what we want to discuss below. In this section, we establish a model by simplifying the molecular motion and simulating the reaction using Matlab programming.
03 Binding analysis
Introduction
The binding of a RNA aptamer to MS2 or PP7 is dynamic, which means some MS2 and PP7 are binding with RNA aptamers and others are separated from RNA aptamers. Having known the initial concentration of RNA aptamer, MS2 and PP7, we need to find out how many RNA scaffolds have both MS2 and PP7 when the binding reach a final equilibrium. In this section, we use the concept -- association rate and dissociation rate [1] to model the process of binding.
Assumption
There are two aptamers on the RNA scaffold named aptamer1 (A1) and aptamer2 (A2). Aptamer1 is binding with MS2 and aptamer2 is binding with PP7. Before establishing the model, we declare some assumptions.
1. After mixing the RNA scaffold, MS2 and PP7, no RNA, MS2 and PP7 are added to the solution or removed from the solution. 2. MS2 would not bind with aptamer2 and PP7 would not bind with aptamer1. 3. The binding of MS2 to aptamer1 and the binding of PP7 to aptamer2 are independent with each other. The binding of one would not affect the binding of the other.
Symbols and Parameters Declaration
[`MS2`] : Concentration of MS2
[`PP7`] : Concentration of PP7
[`RNA`] : Concentration of RNA
[`A1`] : Concentration of aptamer1
[`A2`] : Concentration of aptamer2
[`MS2_0`] : The initial concentration of MS2
[`PP7_0`] : The initial concentration of PP7
[`RNA_0`] : The initial concentration of RNA
[`MS2A1`] : Concentration of MS2-Apatemer1(RNA) complex
[`MS2A1_0`] : The initial concentration of MS2-Apatemer1(RNA) complex
[`PP7A2`] : Concentration of PP7-Apatemer2(RNA) complex
[`PP7A2_0`] : The initial concentration of PP7-Apatemer2(RNA) complex
[`K_{+1}`] : Association rate of aptamer1 to MS2
[`K_{-1}`] : Dissociation rate of aptamer1 to MS2
[`K_{+2}`] : Association rate of aptamer2 to PP7
[`K_{-2}`] : Dissociation rate of aptamer2 to PP7
Differential equation modeling
The binding of aptamer1 to MS2 and aptamer2 to PP7 can be presented as reaction formula:
`MS2+A1 \leftrightarrow MS2A1`
`PP7+A2 \leftrightarrow PP7A2`
where MS2A1 is the MS2-A1 complex and PP7A2 is the PP7-A2.
According to the definition of association rate and dissociation rate, we can obtain the differential equations:
`\frac{d[MS2A1]}{dt}=k_{+1}[MS2][A1]-k_{-1}[MS2A1]`
`\frac{d[PP7A2]}{dt}=k_{+2}[PP7][A2]-k_{-2}[PP7A2]`
And it is obvious that
`[MS2]=[MS2_0]-[MS2A1][A1]=[RNA_0]-[MS2A1]`
`[PP7]=[PP7_0]-[PP7A2][A2]=[RNA_0]-[PP7A2]`
Therefore, we have the final differential equation
`\frac{d[MS2A1]}{dt}=k_{+1}([MS2_0]-[MS2A1])([RNA_0]-[MS2A1])-k_{-1}[MS2A1]`
`\frac{d[PP7A2]}{dt}=k_{+2}([PP7_0]-[PP7A2])([RNA_0]-[PP7A2])-k_{-2}[PP7A2]`
The initial value for `[MS2A1]` and `[PP7A2]` is
`[MS2A1_0]=0`
`[PP7A2_0]=0`
Equilibrium analysis
We solve the differential equations numerically using the "ode" solver in Matlab. Titolo et at once come up with an approach to determine the equilibrium dissociation constant. This constant is dependent on anisotropies of the sample, aptamer, and intensities of the polarizers[1]. Therefore, the association rate constant and dissociation rate constant are usually experimentally determined values. It is difficult for us to determine the constants precisely since they vary in terms of experimental environment.
According to literature, we assumed that
`k_{+1}=2 \times 10^4 M^{-1}S^{-1}`
`k_{-1}=2.18 \times 10^{-4} S^{-1}`
`k_{+2}=1.5 \times 10^4 M^{-1}S^{-1}`
`k_{-2}=1.63 \times 10^{-4} S^{-1}`
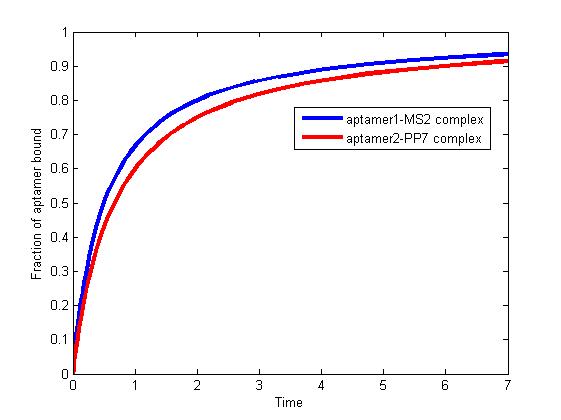
The results are shown as follows:

Fig 1. The fraction of aptamer1-MS2 complex and the fraction of aptamer2-PP7 complex are increasing and finally reach equilibrium.
As we mentioned above, the binding of MS2 to aptamer1 and the binding of PP7 to aptamer2 are independent with each other. The binding of one would not affect the binding of the other. From probability theoretical perspective, the fraction of RNA scaffold binding with both MS2 and PP7 is equal to the fraction of RNA scaffold binding with MS2 multiply the fraction of RNA scaffold binding with PP7. The RNA scaffold binding with both MS2 and PP7 is what we need to improve the reaction rate of pathways.
References
[1] Ajish S. R. Potty, Katerina Kourentzi, Han Fang, George W. Jackson, Xing Zhang, Glen B. Legge, Richard C. Willson. Biophysical Characterization of DNA Aptamer Interactions with Vascular Endothelial Growth Factor. 2008.

 "
"


