Team:Tianjin/Modeling
From 2012.igem.org

Model One - Protein Expression Prediction
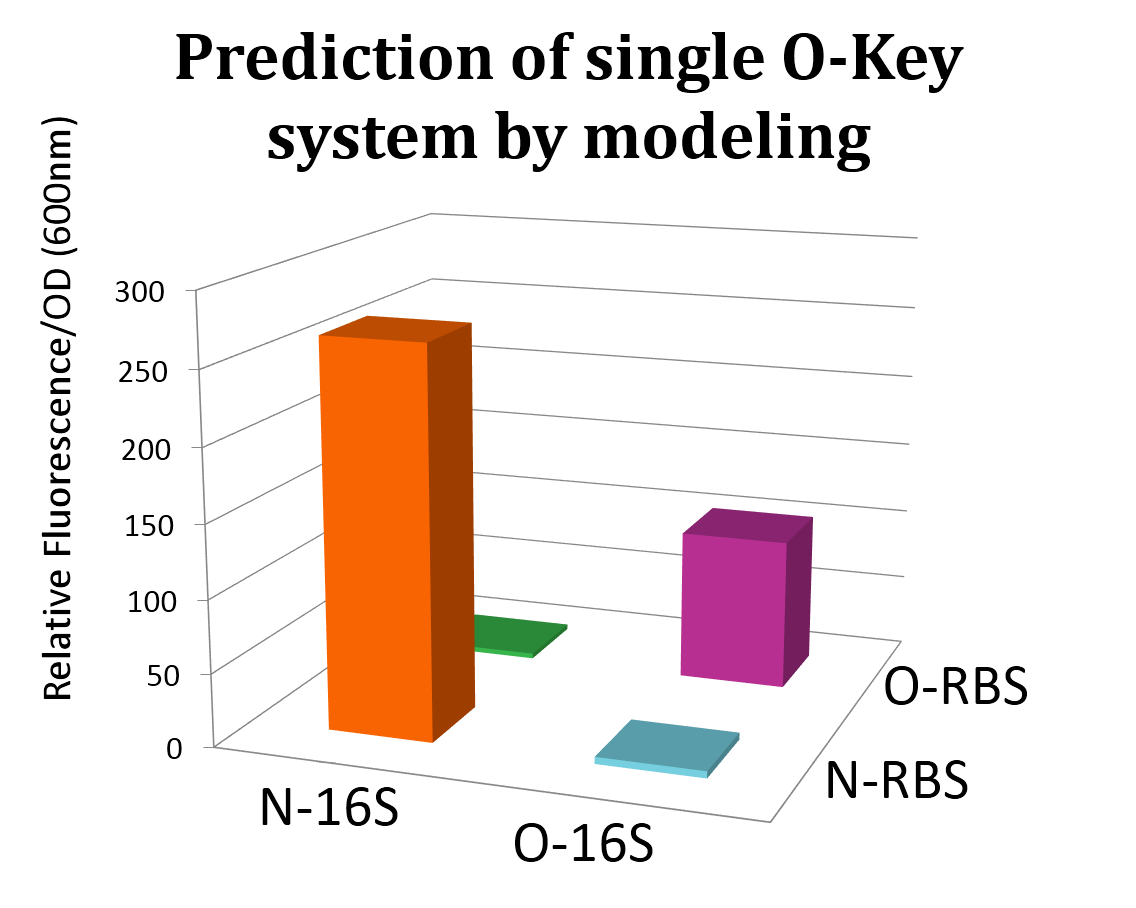
In order to design the orthogonality and to predict the protein expression level, we have established the protein expression model which has strong relationship with the wet lab. The model is based on detailed study of the effects of changing Gibbs free energy on the translation process.
In the process of translation, the initiation rate is the rate determine step. The protein expression amount is consequently direct proportional to the initial translation speed. Furthermore, the initial translation speed is strongly related to the delta Gibbs free energy, which can be calculated out through results of many newly published papers and various commercialized software such as the Vienna RNA Package, RBS-Calculator, and Nucleic Acid Package. In our model, we calculated the delta Gibbs energy. Ideal results can be obtained from the model. The orthogonality predicted by our model before the wet lab is similar to our prediction. When combined with some wet lab result, we can finally predict the spectroscope curve of RFP and GFP under three designed experimental state.
Model Two - HGT Bass
This model is used to describe the process through which the Wild type bacteria is contaminated by exogenous gene. In this model, HGT is short for horizontal gene transfer which is the main cause of genetic pollution. Bass means our model is inspired by the thought of popular Bass model in the field of marketing engineering. After assigning all the variables and parameters with the biological meaning, we also consider the change number of total bacteria under ideal and real condition and the loss of plasmid. In addition, we also study the how the change of parameter value can impact the shape of the bacteria curve. To make the model more realistic and comprehensive, we also consider the number of bacteria that transgressed with the plasmid but do not expressed protein and the spatial diffusion of gene transfer. This model can predict the time when the critical concentration of bacteria is reached at a specific condition. In the future, we can also consider the condition that the exogenous gene will make the generation time different from previous one, how the environmental factors that can influence the parameters p and q, and how to model the conditions where there is more than one exogenous gene and more than one plasmid.
Model Three - Optimum Beginning Time
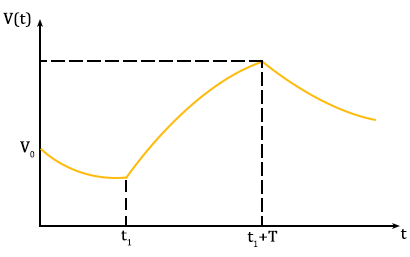
This article focuses on how the genetic pollution been aware by the public and the function of public service advertising on accelerating the awareness process. Our model is mainly based on the ordinary differential equations to describe how basic knowledge and the potential effects of genetic pollution been propagated through the public. During the analysis the model, the relationship between the propagation speed and the amount of social welfare brought about after aware of the pollution is very helpful. We conclude from the model the different optimum beginning time of public advertising for different initial propagating speed which is directly related to the problem itself. In addition, we also evaluate the strength and weakness of the model and look into the future work putting forward some accessing methods.
Model Four - Questionnaire Modeling
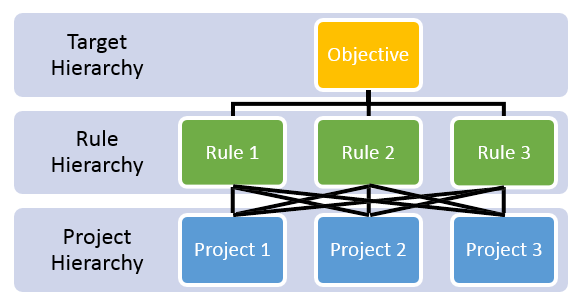
There are five models established in the part, all of whom are based on questionnaire. We have create an evaluation system of iGEM teams and compared our team with last year’s others; we have also create a risk evaluation system of genetic pollution which can measure the seriousness of genetic pollution and predict its tendency, we also studied the influence of various factors on public attitude towards genetic pollution, we also established a systematic model to determination of the optimum propaganda method; finally we create an universal risk evaluation model of environmental problem which can be used to evaluate any environmental problem. We also use this system to compare desertification, green house effects and the eutrophication with the genetic pollution to know the seriousness of these environmental problems in various perspectives.
 "
"


