Team:Paris Bettencourt/Semantic containment
From 2012.igem.org
Contents |
Overview
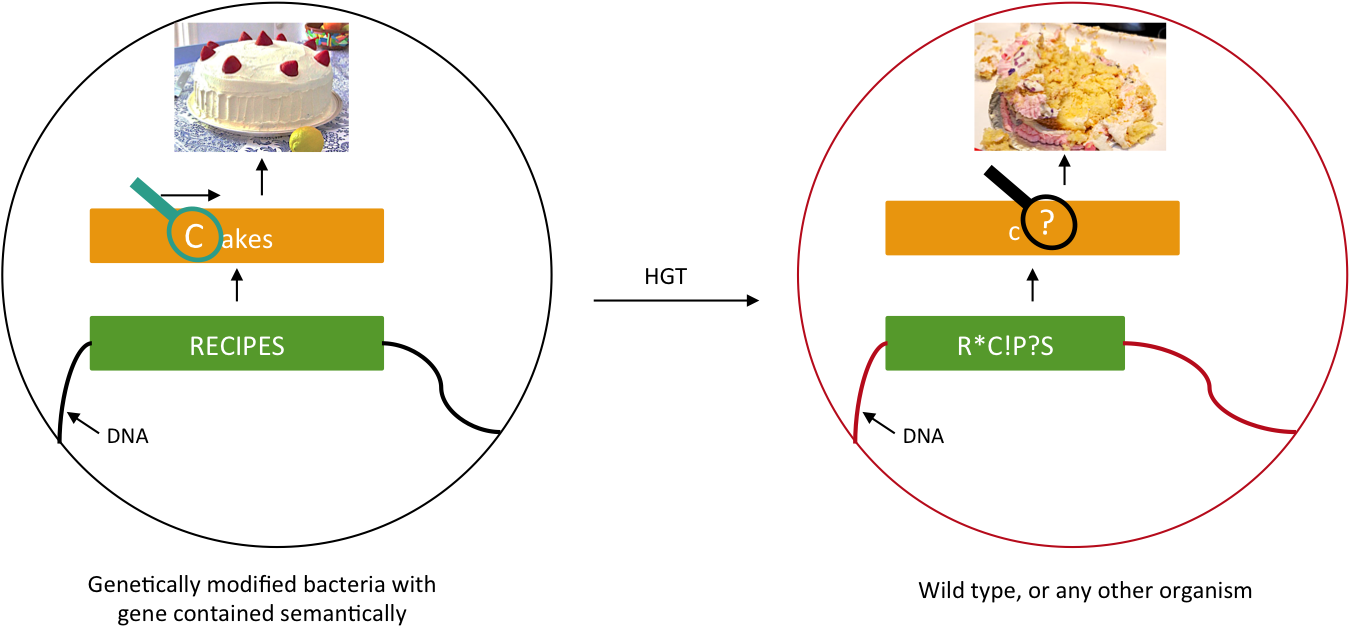
We want to prevent our genetic construct from conferring an advantage to other organisms. Horizontal gene transfer (HGT) can be performed either by conjugation, transduction, or transformation. As these processes involve two parties, our genetically modified bacteria and some wild type population, and as we will not modify wild type populations, we cannot assume that HGT is fully avoidable. Semantic containment [1] means that our bacteria won't be able to "speak" with other organisms, since they don't speak the same "language", the language being DNA. Our system will read the stop codon TAG as the amino-acid serine. It means that in our bacteria the stop codon will be translated into a serine, whereas in wild type bacteria this protein will be truncated and will not confer an advantage to these cells. The 'TAG' codon has been chosen because of its low frequency in E. coli genome (314 occurrences), and also because for further applications, Church Lab tries to remove all amber codon of an E. coli strain. Although it has been demonstrate that the over-expression of a tRNA amber suppressor sole does not affect its growth rate nor the morphology of E. coli.
Objectives
Here we want to show that semantic containment works as expected. First we had to choose between two tRNA amber suppressor, either serine, or tyrosine. For that we calculate the abilities for the amber codon to reverse to a serine or tyrosine or related amino-acid that could conserve the function. Secondly we create a biobrick with a tRNA Amber suppressor ([http://partsregistry.org/Part:BBa_K914000 BBa_K914000]), in order to have a reliable biobrick, with characterization of it. Thirdly, to test the latter biobrick, we built the biobrick [http://partsregistry.org/Part:BBa_K914009 BBa_K914009], that contain an an amber codon instead of one of it serine amino-acid. K914000 is the construction pLac-supD-T, and is named supD in the rest of the page. K914009 is the P1003 gene (kanamycin gene resistance) with the serine 133 which is replaced by a amber codon 'TAG'. Its name is Kan*.
With more time we will try to increase the robustness of this system, which is null when the tRNA amber suppressor is transferred too. We will try to create a new library of plasmid backbones in the part registry, where all backbones have at least two amber mutations. The idea is that all the community will be able to improve this library, either by adding new contained backbones, or by adding amber mutations on the same backbone.
Design
Calculation of serine and tyrosine weakness
In order to know which of these two amino-acids is the less robust to mutation from a 'TAG' codon (amber codon), we will calculate a score of weakness. The weakness of an amino-acid is defined here by its abilities to not revert to the same amino-acid or any other similar, from the amber codon. The score is calculated using the following formula :

Where i is one of the nine amino-acids accessible after 1 mutation. Subst(AA,AAi) calculate the similarity score, using a BLOSUM62 matrix, between serine or tyrosine (AA) and one of the nine amino-acids around (AAi). The lowest score is the weakest.
Qualitative experiment : does it work?
To do so, we will transform a plasmid with a the Kan* gene into a MG1655 strain that contain either pSB1C3::supD, or pSB1C3::RFP. We plate them on Chloramphenicol and Kanamycin. The Kan* is supposed to be non functional without an amber suppressor.
Quantitative experiment : Is it working well? Is the amber mutation leaky?
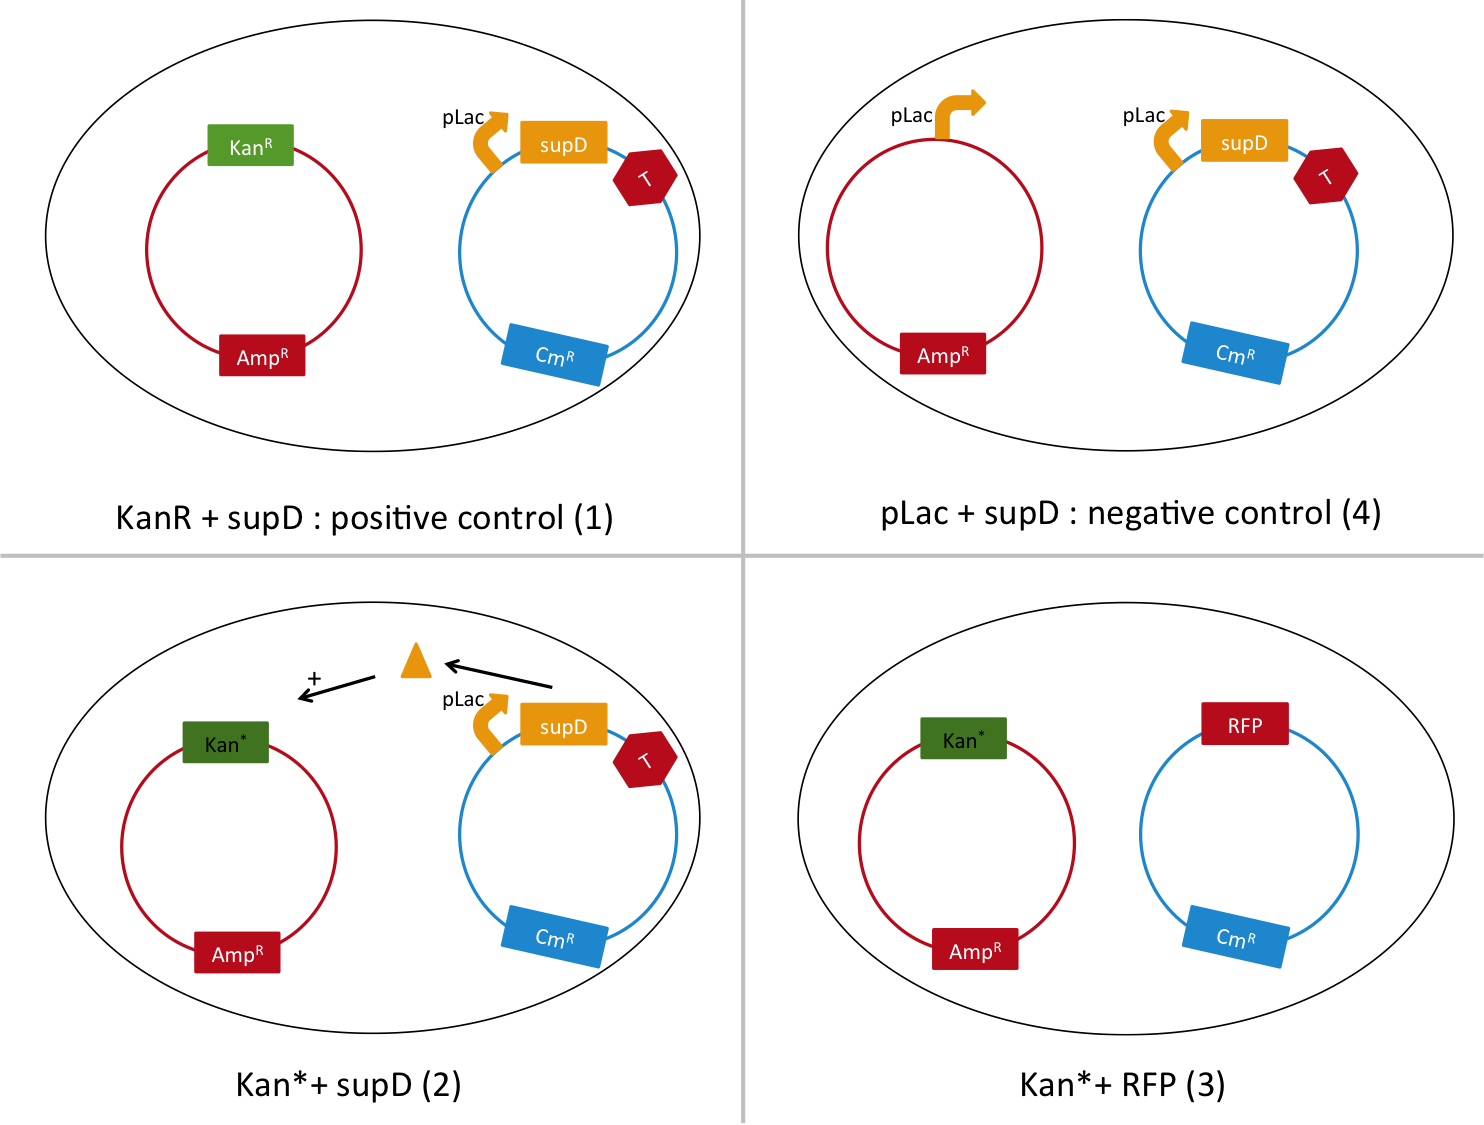
We are going to use the following strains, all in the E. coli strain MG1655. To quantify the leakiness in terms of expression of the Kan* gene, we will perform real time experiment, where we will measure the growth rate of each of these strains in different concentration of kanamycin. In case of leakiness, the Kan*+RFP strain will be able to grow in higher concentration of kanamycin than the negative control (4).
We will also be able to quantify the functionality of the Kan*+supD strain, by comparing with the positive control.
Experiments and results
Weakness calculation
We wrote a Python script that can calculate the score of weakness, with all amino-acids (not only serine or tyrosine), and will sort a list of score, with the BLOSUM62, BLOSUM80, BLOSUM100.
The scores are, with a mutation rate of 10-9,and :
- BLOSUM62 :
- Serine : -1.0000000002222223e-09
- Tyrosine : 4.4444444307407385e-10
- BLOSUM80 :
- Serine : -1.444444445111111e-09
- Tyrosine : -2.222222242962964e-10
- BLOSUM100 :
- Serine : -3.333333334925926e-09
- Tyrosine : -1.0000000044444444e-09
So, no matter the matrix used, the amber codon is always less likely to revert into a serine or similar.
Also, we favor serine replacement over tyrosine, because the frequency of serine in the E. coli genome is superior to the tyrosine one. It turns out that S has 57,88 codons over 1000 codons when Y has 28,59 codons over 1000 codons ([http://openwetware.org/wiki/Escherichia_coli/Codon_usage Codon usage]). Therefor, it might be more convenient to replace a serine than a tyrosine, because proteins would more likely to contain many serines than tyrosines.
Qualitative characterization of K914000 and K914009
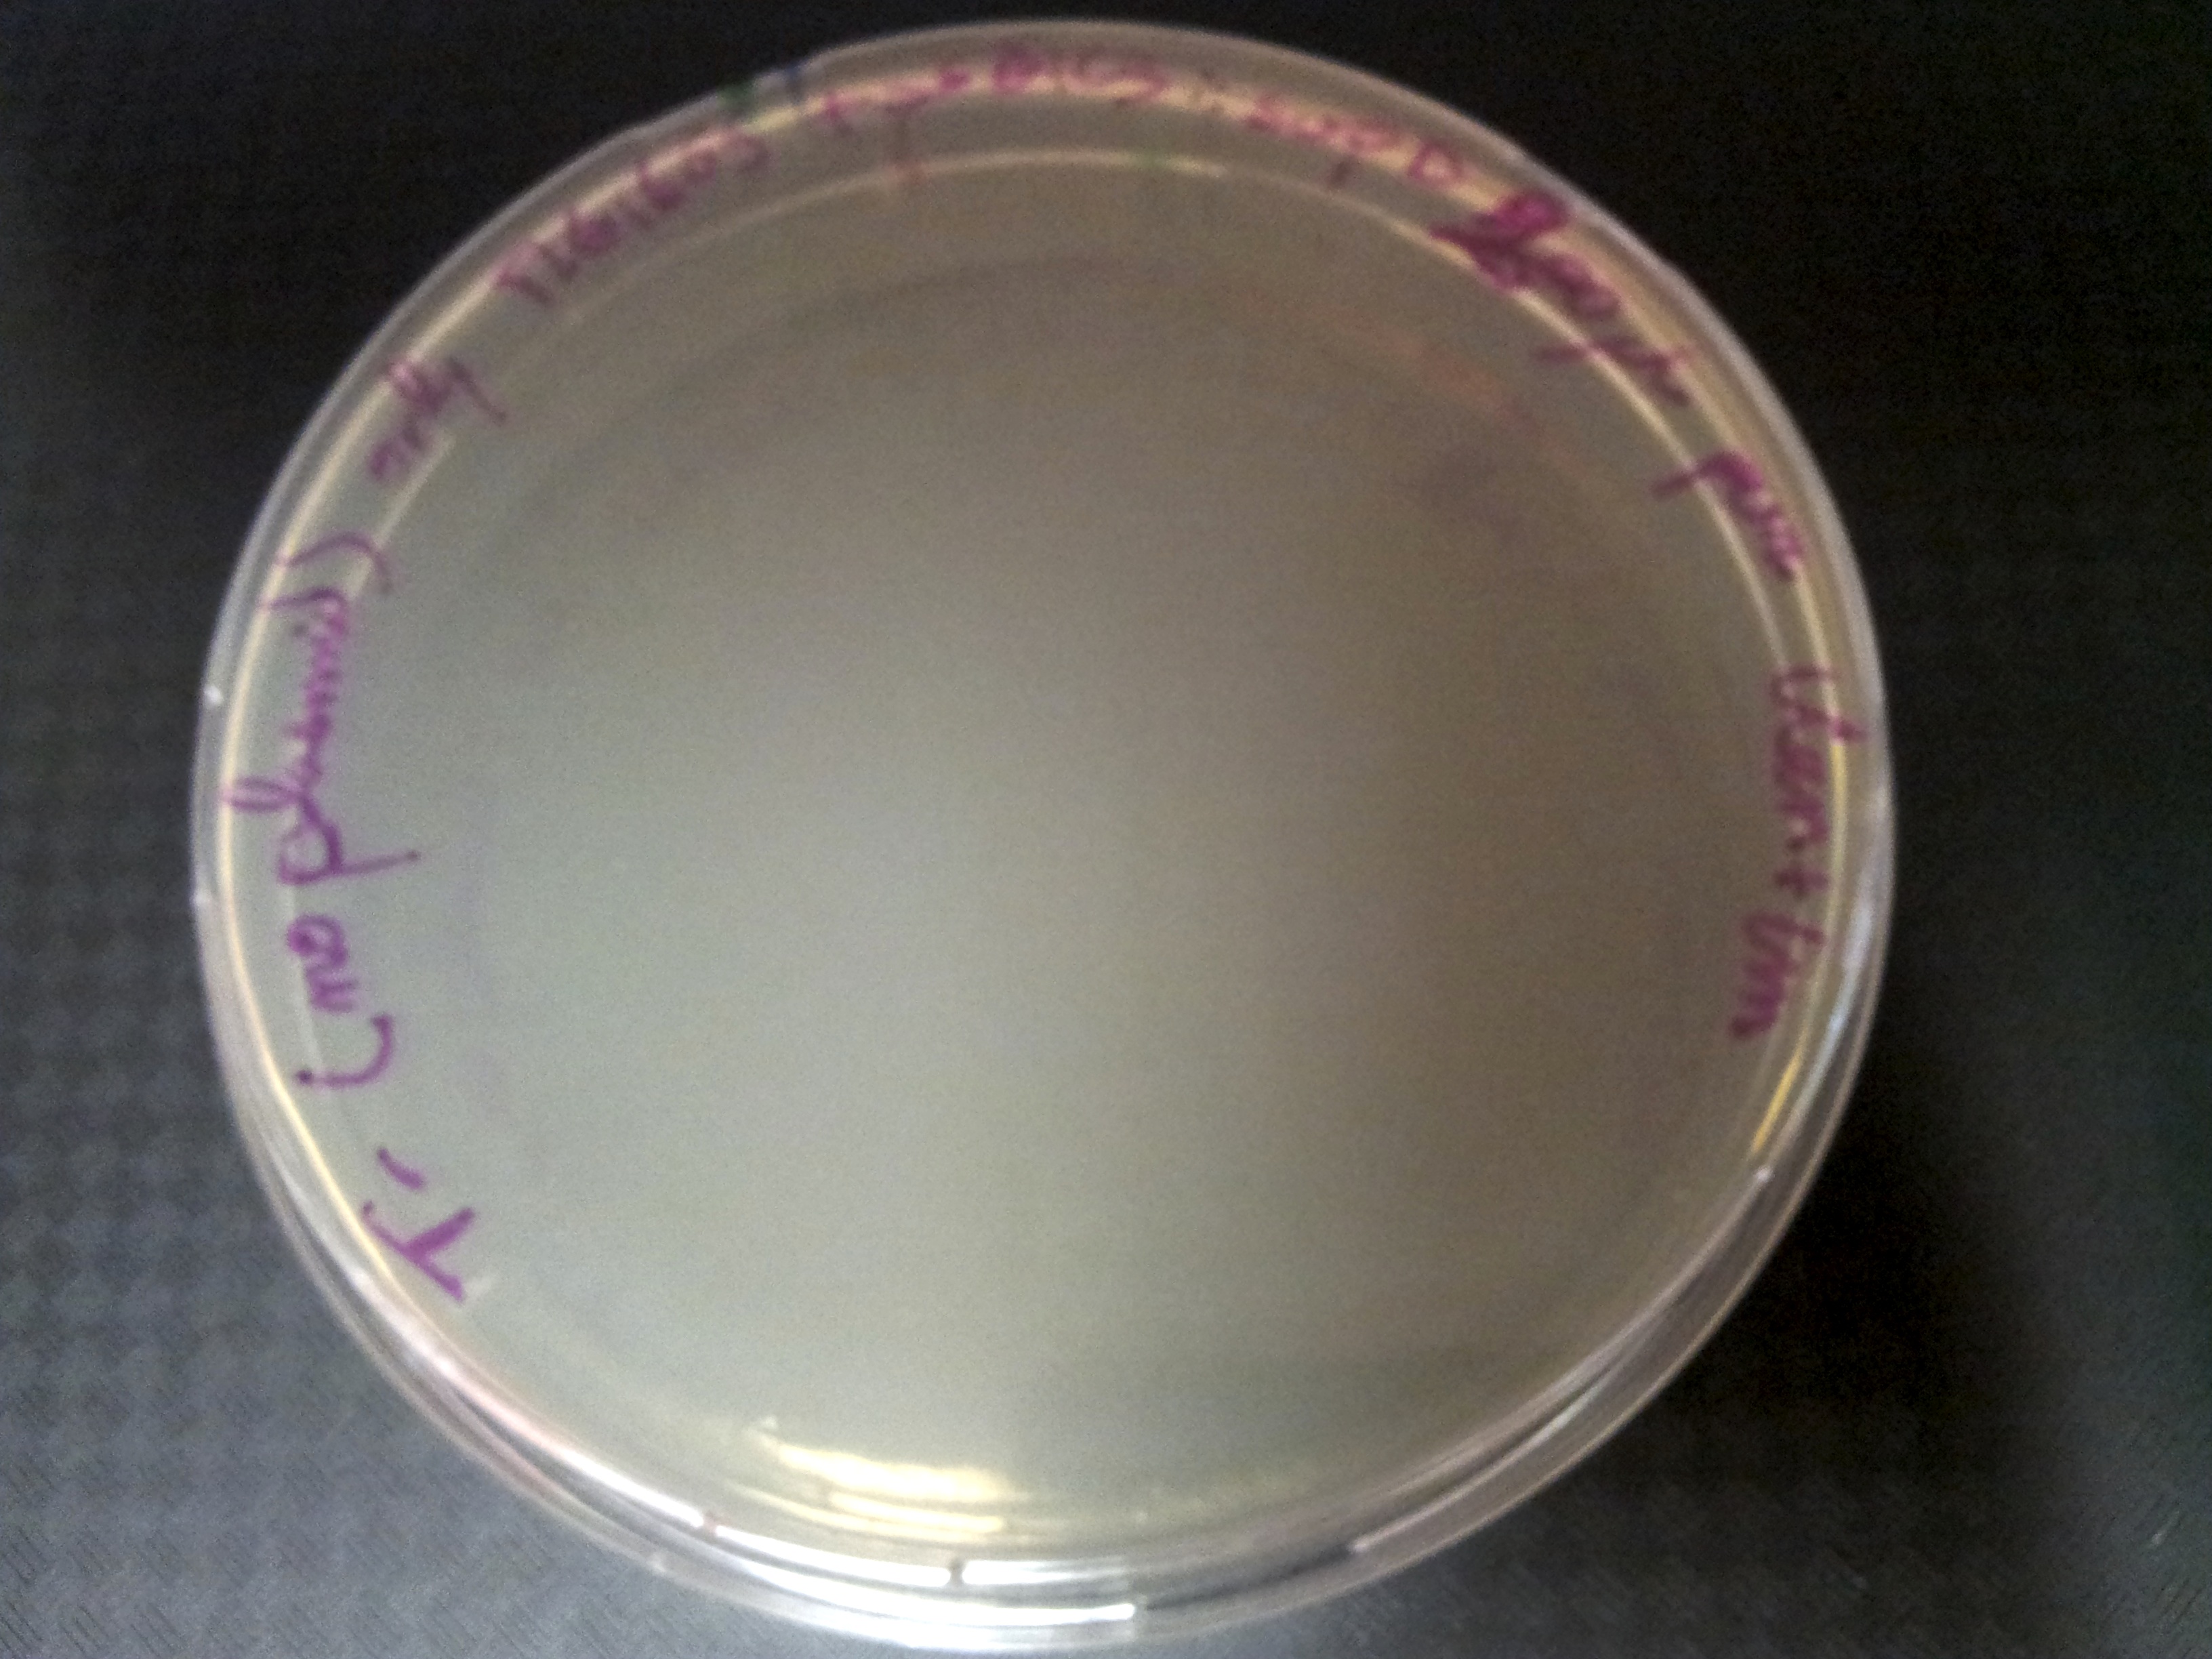
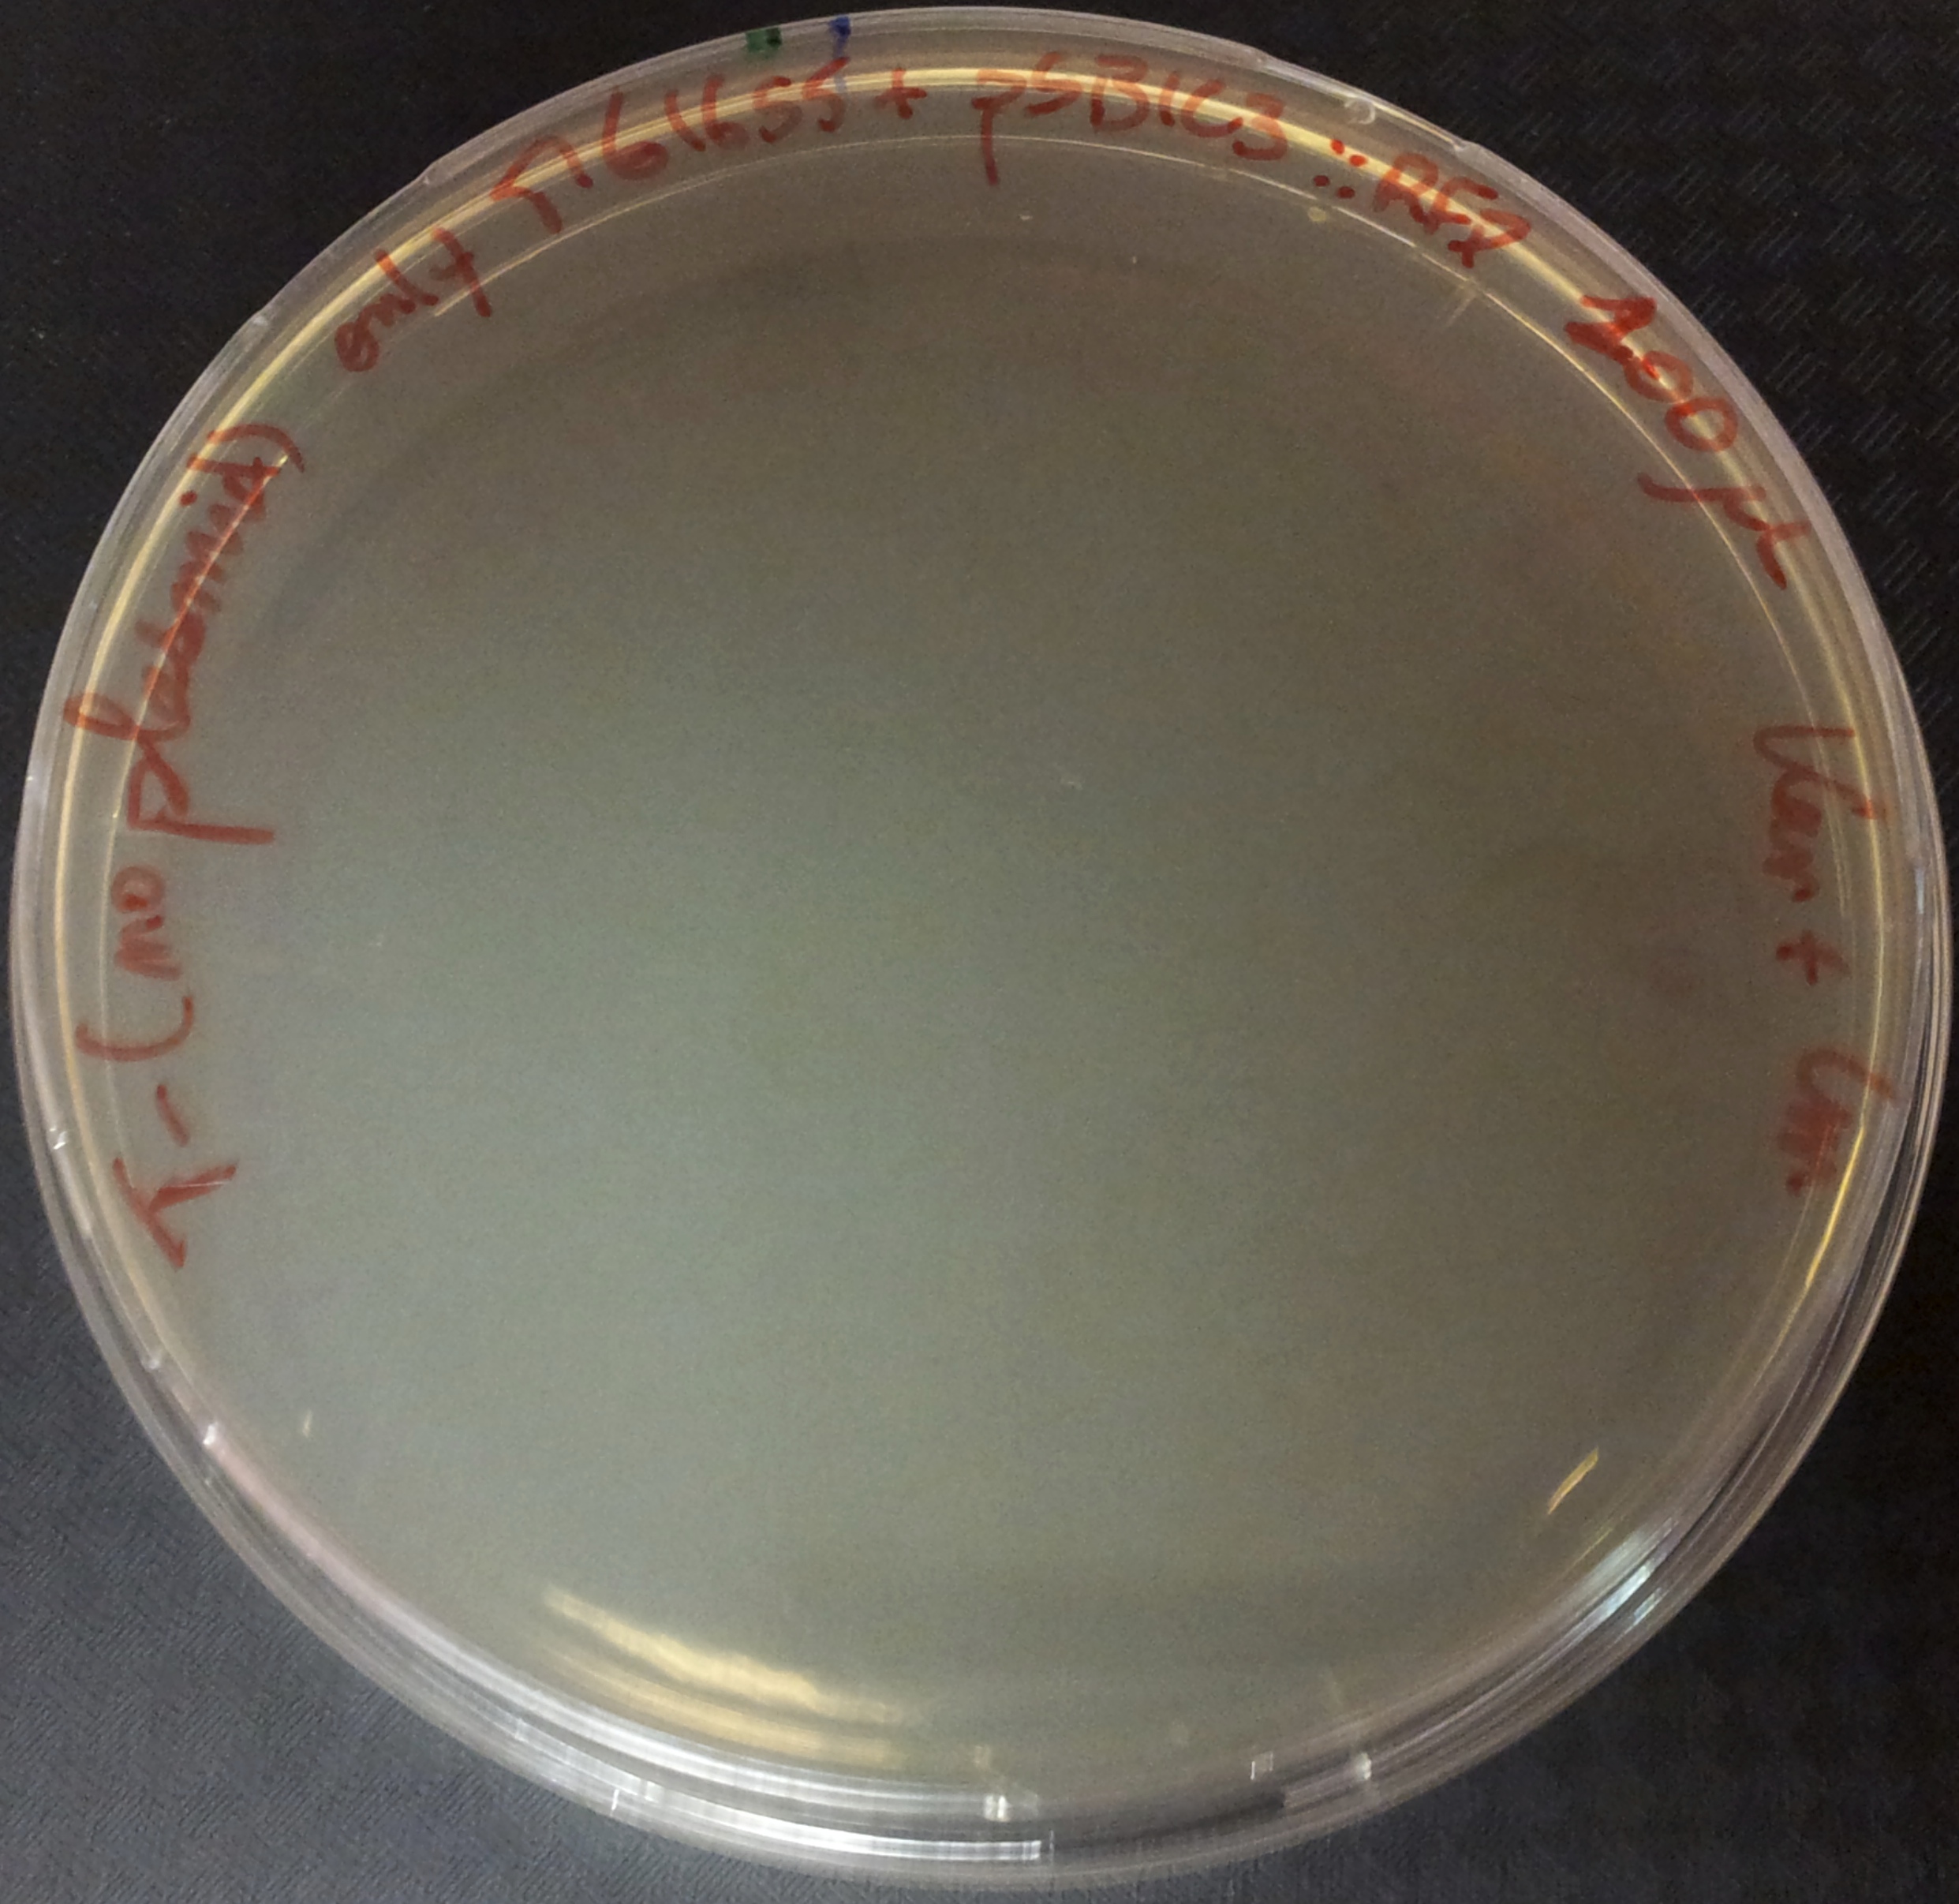
After preparing electro-competent M1655 cells with either pSB1C3::supD or pSB1C3::RFP. We transform the plasmid pSB1A1::Kan* in both competent cells. After transformation, cells are plated on Cm+Kan.
We can observe that without any plasmids transformed no cells grow, or when we transform another plasmid with no Kan resistance gene, but with an Amp gene resistance (and plated on Cm+Amp), colonies appear in the strain with RFP, unfortunately the other control (with supD) did not work this time, hence there is no picture of it. But for the quantitative experiment we need that control too (4), and we manage to do it that times. But the pSB1A1::Kan* can express the kanamycin resistance phenotype only in the strain containing the supD gene.
We can conclude here that the supD gene can rescue the phenotype KanS by allowing the correct expression of the kan gene P1003.
Quantitative characterization of K914000 and K914009
Here we characterize both biobrick quantitatively. First, we are going to confirm the qualitative result for the part K914000 and then we will determine how a single amino-acid substitution is leaky.
Experimental setup
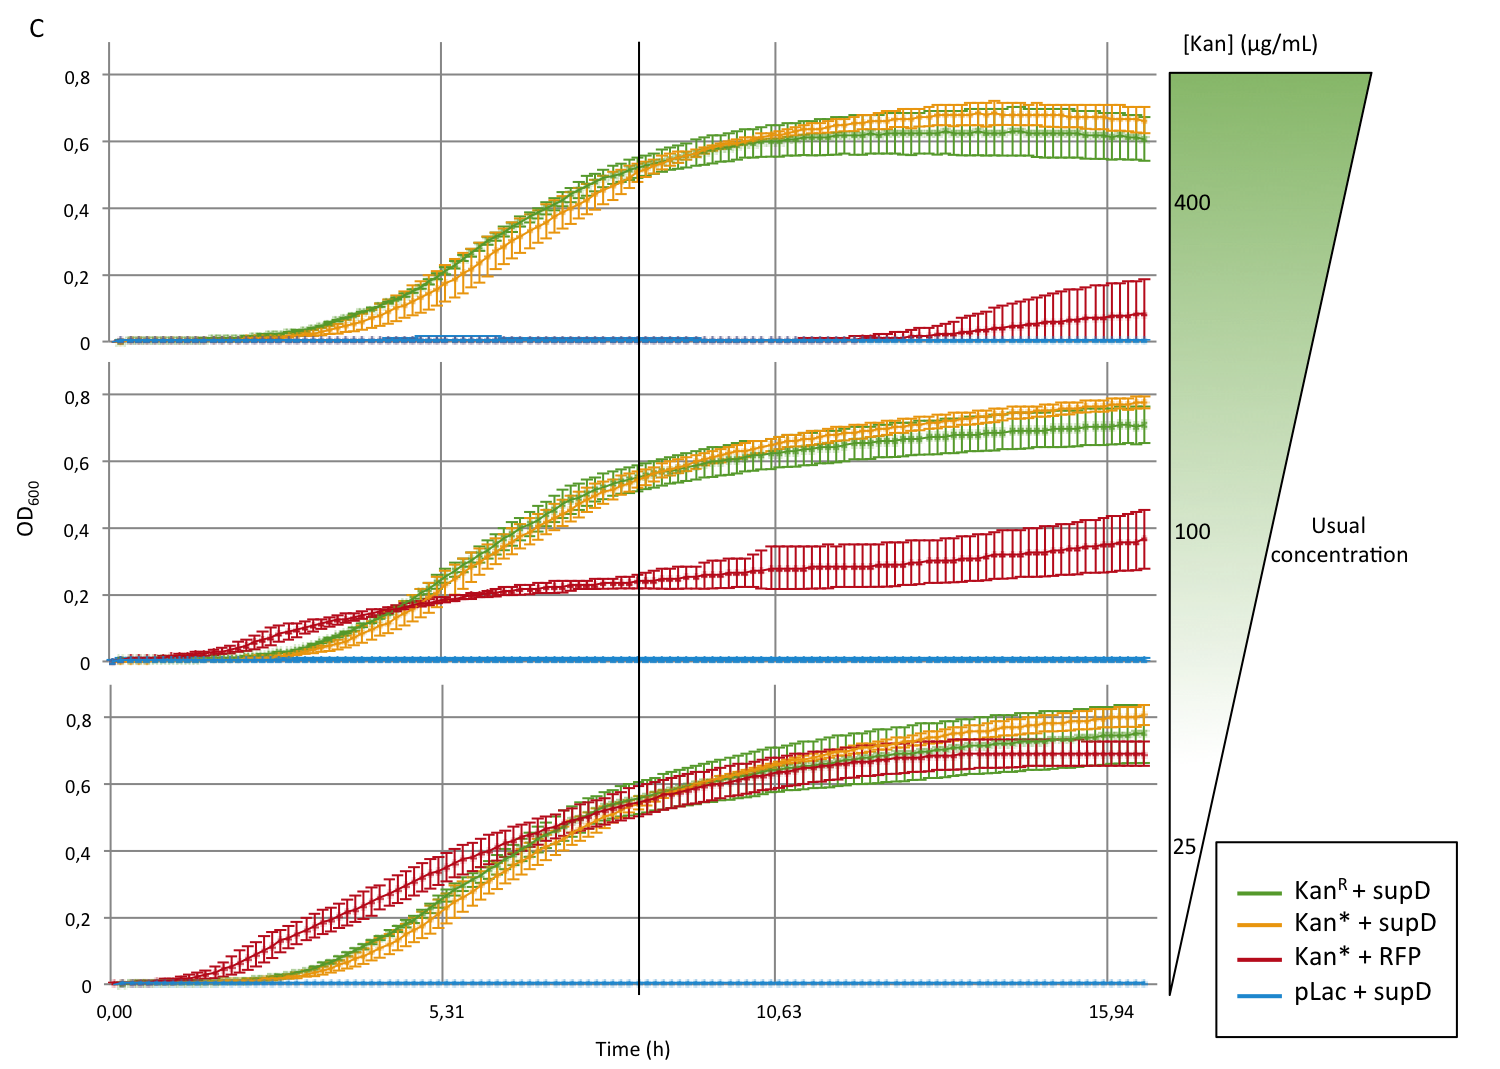
Once the construction is made (Fig. 2), we double transformed the plasmids into MG1655 strains, that does not contain any amber suppressor. We will work with three replicates of each strains, and for each strain we will be in 8 different conditions of antibiotic resistance. The antibiotic used is kanamycin, an aminoglycoside interfering with the translation. The range of concentration goes from 4 times as much as the usual concentration (100 µg/mL) to 8 times less. The 96 wells plate is then incubated in a plate reader that take measurements of OD600 every 6 minutes. This measure is correlated to the number of cell in the well. Each well contains 200µL of LB (Lysogeny broth, aka Luria Bertani), chloramphenicol and ampicilin at their usual concentration, the dilution of cells and different amount of kanamycin. An overlay of 50µL of mineral oil is added on the top. The measurement lasted approximately 16 hours and 30 min.
Results
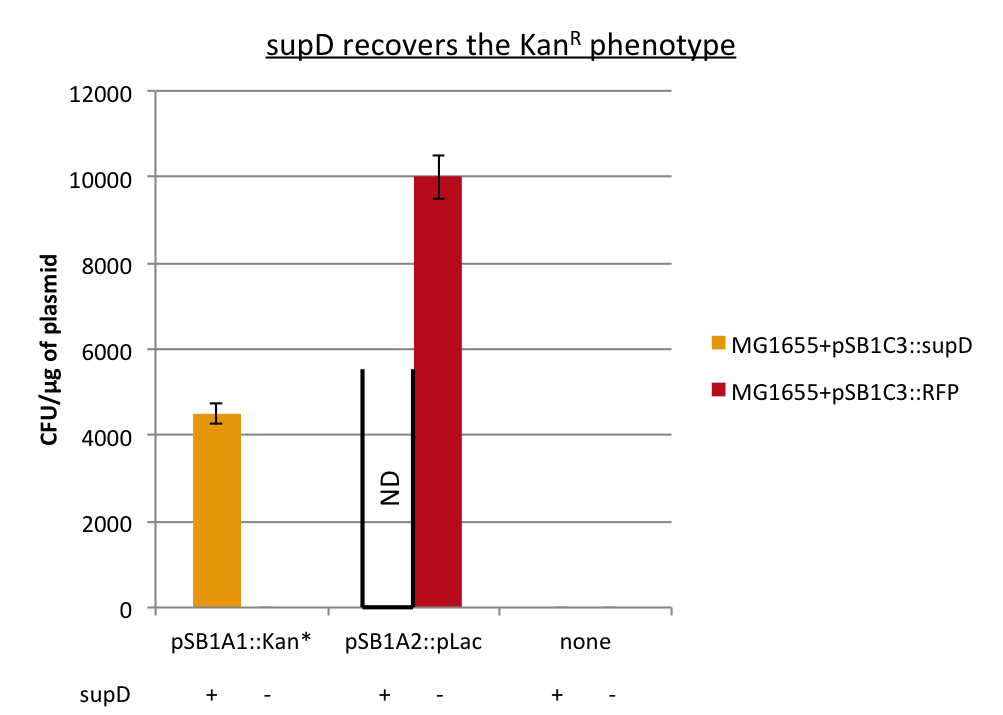
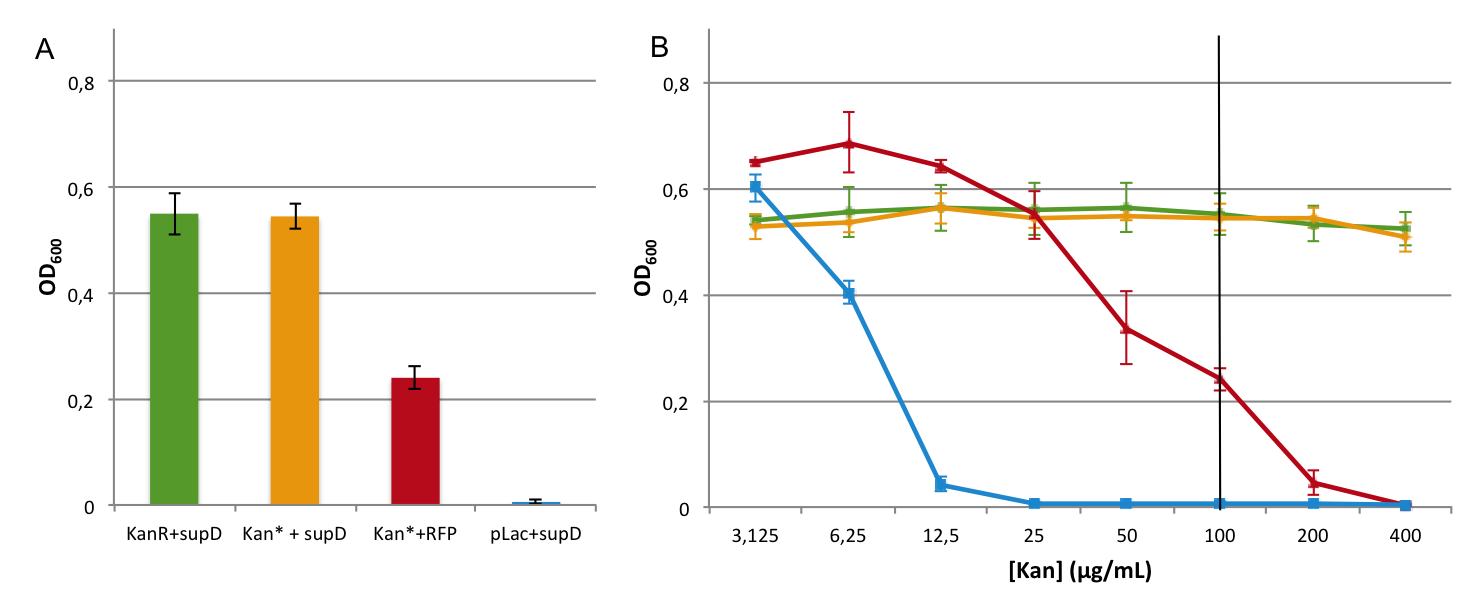
First we observed that the qualitative result is reproduce here, the supD gene rescues the kanamycin resistance at any concentration of the antibiotic. It shows also that there is no disadvantage to use the supD amber suppressor compare to the wild type kanamycin gene resistance, since there is no difference of growth rate (Figure 4B and 4C). However the leakiness of the Kan* gene is higher than expected, and thus one mutation is not sufficient for the containment. Indeed, at usual concentration, Kan* gene manages to express an antibiotic resistance, even though lower than KanR or supD (Figure 4A).
 "
"


 Overview
 Delay system
 Semantic containment
 Restriction enzyme system
 MAGE
MAGE Encapsulation
 Synthetic import domain
 Safety Questions
 Safety Assessment