Team:Amsterdam/modeling/odemodel
From 2012.igem.org


Using the here presented model, we will examine how to infer the signal detection time from the amount of methylated plasmids. The cellular division rate determines how long a signal is stored in the Cellular Logbook. All units are dimensionless in this model, as its sole purpose is clarification of practical usage of the Cellular Logbook.
Contents |
Inferring the time of signal onset
Methylated bits over time
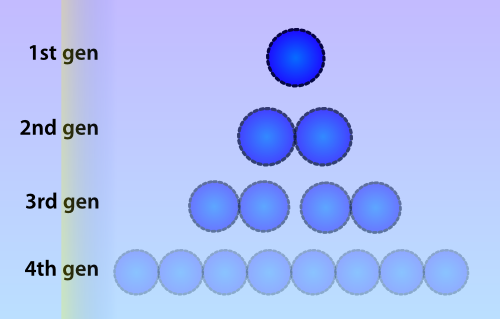
Numerous identical plasmids are often present in single cells and plasmids replicate independently of the bacterial chromosome (Scott 1984). A plasmid copy number (PCN) has been determined for all plasmids in the Parts Registry, which indicates a likely amount of copies of the plasmid to be present in each cell. Unlike eukaryotes, prokaryotes do not copy DNA methylation patterns to the newly synthesized strand during DNA replication. This will lead to a dilution of the amount of ‘written’-plasmids over time, mostly due to cell replication and the ensuing binomial division of the plasmids in the parent cell among the two daughter cells.
The volatilty of this memory design seemed a downside at first, but quickly opened our eyes to a very exciting feature of this system. By analyzing the fraction:
<math>F(t) = \frac{\text{written plasmids}}{\text{written + unwritten plasmids}}</math>
at the time of memory read-out, the time at which the signal was registered can be inferred.
Model definition
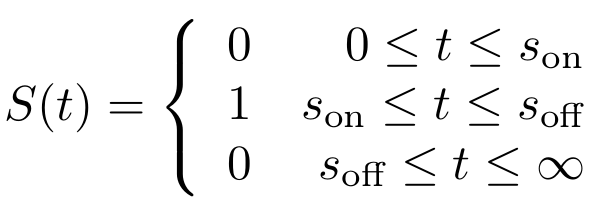
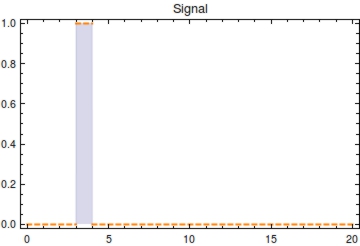
First, let’s model the input signal/compound which is to be reported on. Imagine the to be stationary and positioned along a fluidic stream so that the signal to be registered can pass the. Modelling the signal using the piecewise function <math>S(t)</math> now seems appropriate. Here, <math>s_{\text{on}}</math> is defined as the time at which the signal is first encountered and <math>s_{\text{off}}</math> as the time at which the signal is turned off.
We will model a single cell with multiple identical plasmids. Each of the plasmid copies contain the gene for the methyltransferase and the so called bit region, which is the region especially purposed to be methylated in presence of a signal. The following assumptions/conditions are made:
- A well stirred cellular system with no spatial concentrations differences and all species' concentrations large enough to be approximated by continuous functions. Hence we will use a set of ordinary differential equations (ODE’s)
- To ease the analysis of the model, a single unique bit with multiple copies per cell is considered here
- <math>P_{0}</math> denote plasmids that have the single bit set to 0, no write event has taken place in these cells
- <math>P_{1}</math> denote plasmids in which the bit has been flipped to 1 in response to encountering the signalling compound
- <math>P_{\text{T}}</math> denotes the total amount of cells in the sytem, <math>P_{0} + P_{1}</math>
- Assumed is a high response rate (3 min) termed <math>\omega</math>, which is the constant rate with which the system responds with methylation of the bit region to the detection of the signal.
- Logistic growth for the plasmid population inside the cell, with a capacity limit of <math>Ca = 40</math>, the copy number of a low copy number plasmid.
- Alternatively, this maximal plasmid number could also be described as the fraction between the plasmid proliferation rate (<math>\beta</math>) and degradation rate (<math>\alpha</math>). The steady state amount of plasmids in the cell will be determined by <math>P_{\text{SS}} = \frac{\beta}{\alpha}</math>, the solution to the differential equation <math>P'(t) = \beta P - \alpha P</math>.
- Accumulation of cells in which the bit has been written is assumed to result in non-written cells; methylation patterns are not copied to the progeny in prokaryotes.
From these rules, the following system of ODE’s has been constructed: $$ \begin{aligned} \frac{dP_{0}}{dt} &=& k\ P_{0+1}\ (1 - \frac{P_{0+1}}{\text{Ca}}) - \omega\ S(t)\ P_{0} - \alpha\ P_{0} \\ \frac{dP_{1}}{dt} &=& \omega\ S(t)\ P_{0} - \alpha\ P_{1} \end{aligned} $$
| Parameter | Value |
|---|---|
| k | 0.8 |
| <math>\alpha</math> | .06 |
| Ca | 200 |
| <math>\omega</math> | 4 |
| Table 1: Parameter values for the plasmid methylation model |
|
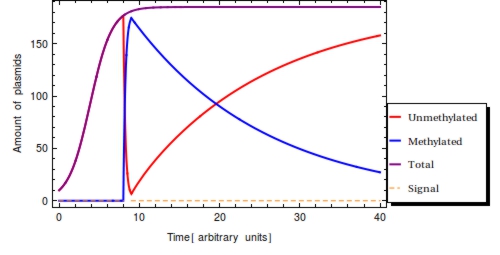
Using the parameter values of Table 1 a simulation with a duration of 40 time units is shown in Figure 2. The plasmid population within a Cellular Logbook is shown to be completely converted to methylated plasmids shortly after <math>s_{\text{on}}</math>. As long as the signal is still present – until <math>s_{\text{off}}</math>, – the bit on all newly copied plasmids will be immediately methylated as the signal is still present. After <math>s_{\text{off}}</math>, <math>F(t)</math> will start to decrease. This is mostly due to cell division, during which the cell’s plasmids will be binomially distributed between the two two daughter cells, halving the plasmid amount every division cycle. In this simulation, this degradation due to cell division has been accounted for in the constant degradation rate <math>\alpha</math>. The duration of time after which a small trail of methylated plasmids is still present is related to two factors: positively to the amount of methylated cells at <math>s_{\text{off}}</math> and negatively to the plasmid degradation rate.
| Species | Value |
|---|---|
| <math>P_{0}(0)</math> | 10 |
| <math>P_{1}(0)</math> | 0 |
| Table 2: Initial species values for the plasmid methylation model |
|
To reinforce that: $$ P_{0} + P_{1} = P_{\text{T}} \le \text{Ca} $$ is always true in the model, the total amount of plasmids has also been plotted (purple). This clearly shows the limiting value of the plasmid population count, specified by the capacity limit (<math>Ca</math>). This is reached around <math>t=10</math> with the parameter set used here.
Unknown variables affecting <math>F(t)</math> in a real-life setting would be the time of signal onset, signal duration and signal strength. Knowing the values for two of these three values, the value of the third can be solved for. Here we will simply assume maximal signal strength during <math>s_{\text{on}}</math> and <math>s_{\text{off}}</math>.
The response rate <math>\omega</math> of the Cellular Logbook could limit <math>F(t)</math>, as a low <math>\omega</math> might yield incomplete methylation of all plasmids before <math>s_{\text{off}}</math>. This rate should be experimentally determinable before actual deployment and application of our system and is more closely looked at in the next section. It is likely to be several magnitudes greater than the cellular division rate, however. Every single gene on a plasmid is thus expected to be methylated within at most 5 minutes of registering of the signal.
Assuming that the plasmid population will have reached its stationary state level before is plausible and eases the analysis somewhat. If the capacity limit has not been reached yet before, a lower value of results than had the capacity limit been reached. This could fool an experimentalist into thinking that the signal was detected relatively long ago, when in fact the amount of plasmids was still very low at <math>s_{\text{on}}</math>, such that total plasmid population <math>P_{\text{T}}</math> has continued to expand since <math>s_{\text{on}}</math>.
In theory
The monotonically decreasing value of <math>F(t) = \frac{\text{methylated plasmids}}{\text{total plasmids}}</math> can be used to infer <math>s_{\text{off}}</math>, given that the degradation rate (<math>\alpha</math>) and capacity constraint <math>Ca</math> are known and constant. Also assumed is that all bits are methylated during signal presence, this implicates <math>\omega</math> is sufficient to methylate all bits during presence of the signal. Irrespective of the initial amount of plasmids, the population of plasmids within the single cell will have reached a steady state value of <math>\frac{\beta}{\alpha}</math>. As we see in the Figure 2, <math>F(t)</math> will start to decrease as a function of the degradation rate after the signal has left the medium following the following function:
$$ \frac{dP_{1}}{dt} = - \alpha\ P_{1} $$
Integrating this differential equation and multiplying by the steady value <math>\frac{\beta}{\alpha}</math> will yield the amount of methylated plasmids at time <math>t</math>, given that there were <math>\frac{\beta}{\alpha}</math> methylated plasmids at <math>t = 0</math>.
$$ P_{1}(t) = \frac{\beta}{\alpha} e^{-\alpha t} = \frac{\beta}{\alpha} F(t) $$
By solving the previous equation, we can calculate the time <math>t</math> that has passed after <math>s_{\text{off}}</math> from <math>F(t)</math>:
$$ t = \frac{\ln(F(t))}{-\alpha} $$
In practice
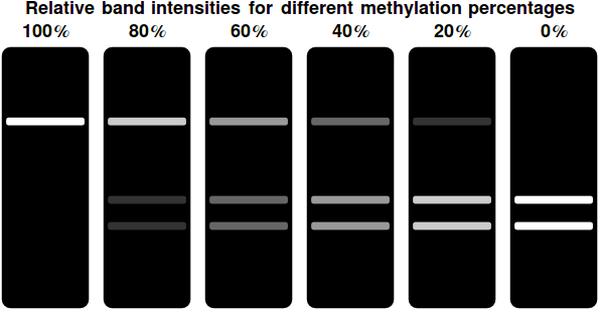
In a typical laboratory situation, doing a restriction enzyme assay on the miniprep-extracted plasmid DNA out of followed by gel electrophoresis will be the most convenient way to assess the methylation status of the bits. The relative intensities of the gel bands can then be used to infer <math>F(t)</math>. Unmethylated bits will result in successfully digested DNA fragments and thus two bands of shorter DNA fragments. Methylated bits will not be cut and will therefore result in one longer band, shown more to the top of the gel. Thus the top and two bottom gel bands are mutually exclusive as they indicate the same (linearized) plasmid DNA to either be digested, resulting in the two bottom bands, or undigested, resulting in the top band. A high value for <math>F(t)</math> indicates recent detection of the signal, whereas a low value indicates detection to have occurred longer ago.
To get a hands-on feel of the effects that the plasmid degradation and replication rate have on <math>F(t)</math>, an interactive version in Mathematica is hosted on Dropbox. This file contains the code for all analyses and graphics (except for the cell division scheme) on this page.
 "
"


