Team:Freiburg/Project/Results
From 2012.igem.org
Contents |
Results
The toolkit
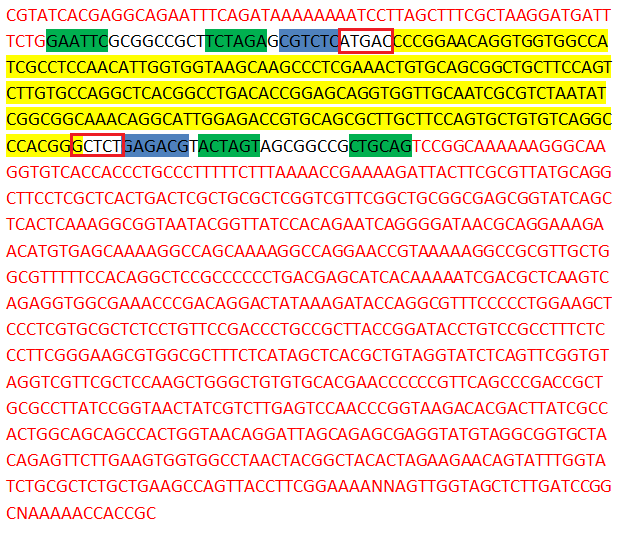
The creation of a toolkit with 96 different parts not only means a lot of labwork but also a lot of organisational tasks, sequencing and analysis. We don't want to bore you with the 96 sequences of our finished biobricks, but we want to give you one example of a finished biobrick and highlight some of the interesting and important strips in its sequence. If you are interested in the other sequences, just have a look at our parts section or go to the [http://partsregistry.org Registry of Standard Biological Parts].

|
In this sequence of our biobrick AA1, the main features of all our biobricks are highlighted. As pointed out in the Golden Gate Standard section of our project description, all direpeat plasmids are submitted in the Golden Gate Standard, that was developed by us and which is fully compatible with existing iGEM standards. In yellow you can see the direpeat gene fragment itself, the green parts are iGEM restriction sites (a requirement for all biobricks), the sequence written in red is part of the psb1C3 vector, the blue sequences are recognition sites for BsmB1 and the red boxes are the cutting sites of BsmB1.
Creation of TAL sequences - Golden Gate Cloning -
Admittedly, our GATE assembly kit is a little larger than the kit published from the Zhang kit in Nature this year (it comprises 78 parts). But considering that future iGEM teams can easily combine the parts to form more than 67 million different effectors, we believe that it was worth the effort. Now, to get from the toolbox to the finished TAL effector, you only need a few components: six direpeats, one effector backbone plasmid, two enzymes and one buffer. If you mix these components and incubate in your thermocycler for 2.5 hours, you get your custom TAL effector. To put this in perspective: The average turnaround time for TALE construction with conventional kits is about two weeks! In the following sections, we want to show you the results of our trials with the finished biobricks and the sequencing of built TAL effector constructs.
Activation of transcription
 In theory the TAL domain should bring the coupled VP64 domain in close proximity to the minimal promotor an activate the transcription of the repoter gene SEAP. The phosphatase is secreated an acummilates in the cell culture media. After 24 and 48 hours we took samples from the media kept them at -20°C and analyzed them two days later with an photometer. (For detailed experiment design and theory of SEAP look at our "Experiment" page in the project section.)
As you can see in the graph we were able to demonstrate a high increase in SEAP activity compared to the control samples and the co-transfection of TAL and SEAP plasmids (++). The graph shows the average of three biological replicates with its standard deviation. In the next table we did a ttest to prove the statistical significance, the yellow highlighted fields are the p-values for our double transfections. As you can see they are clearly below a p-value of 0,05 which demonstrates their statistical significance.

The next image shows the SEAP measurement over the first nine minutes, after this time the OD of the double transfection (++) got to high to be measured by our photometer. As you can see the OD of the double transfection rose very fast indicating a high amount of SEAP reacting with the substrate pNPP. In the other samples no SEAP was measureable, the sample transfected with only the SEAP plasmid showed the highest OD but not statisticaly significant (p-value:0,25/0,51). The results for the samples taken after 48 hours showed the same behavior.

 "
"
