Team:Penn/Targeting
From 2012.igem.org
| Line 24: | Line 24: | ||
<p style="color:black;text-indent:30px;"> | <p style="color:black;text-indent:30px;"> | ||
| - | To verify that our SKBR3 cells overexpressed HER2, we immunostained for HER2 (primary anti-Neu Mouse Igg, Santa Cruz Biotechnology and secondary donkey anti-mouse Alexa-Fluor 647 conjugate, Jackson Immunoresearch) and visualized the cells on a confocal microscope. As expected, HER2 was overexpressed in SKBR3 cells (Figure | + | To verify that our SKBR3 cells overexpressed HER2, we immunostained for HER2 (primary anti-Neu Mouse Igg, Santa Cruz Biotechnology and secondary donkey anti-mouse Alexa-Fluor 647 conjugate, Jackson Immunoresearch) and visualized the cells on a confocal microscope. As expected, HER2 was overexpressed in SKBR3 cells (Figure 1).</p> |
<div class="figs2"> | <div class="figs2"> | ||
<div class="fignew"><div align="center"><img src="https://static.igem.org/mediawiki/2012/e/e0/SKBR3_%28%2BDAPI%29_%28%2BAB1%29_%28%2BAB2%29_630x.jpg" height="400" width="400"><br> | <div class="fignew"><div align="center"><img src="https://static.igem.org/mediawiki/2012/e/e0/SKBR3_%28%2BDAPI%29_%28%2BAB1%29_%28%2BAB2%29_630x.jpg" height="400" width="400"><br> | ||
| - | <b>Figure | + | <b>Figure 1</b></div>Figure 1: SKBR3 cells over-express HER2 on their surface. Red indicates HER2 (Alexa-Fluor 647), Blue indicates DAPI.</div> |
<div class="fignew"><div align="center"><img src="https://static.igem.org/mediawiki/2012/7/7a/HER2-Breast-Tissue.jpg" height="400" width="400"><br> | <div class="fignew"><div align="center"><img src="https://static.igem.org/mediawiki/2012/7/7a/HER2-Breast-Tissue.jpg" height="400" width="400"><br> | ||
| - | <b>Figure | + | <b>Figure 2</b></div>Figure 2: Images of breast cancer cells removed from human tissue reveal similar HER 2 expression to results obtained in Figure 2. </div></div> |
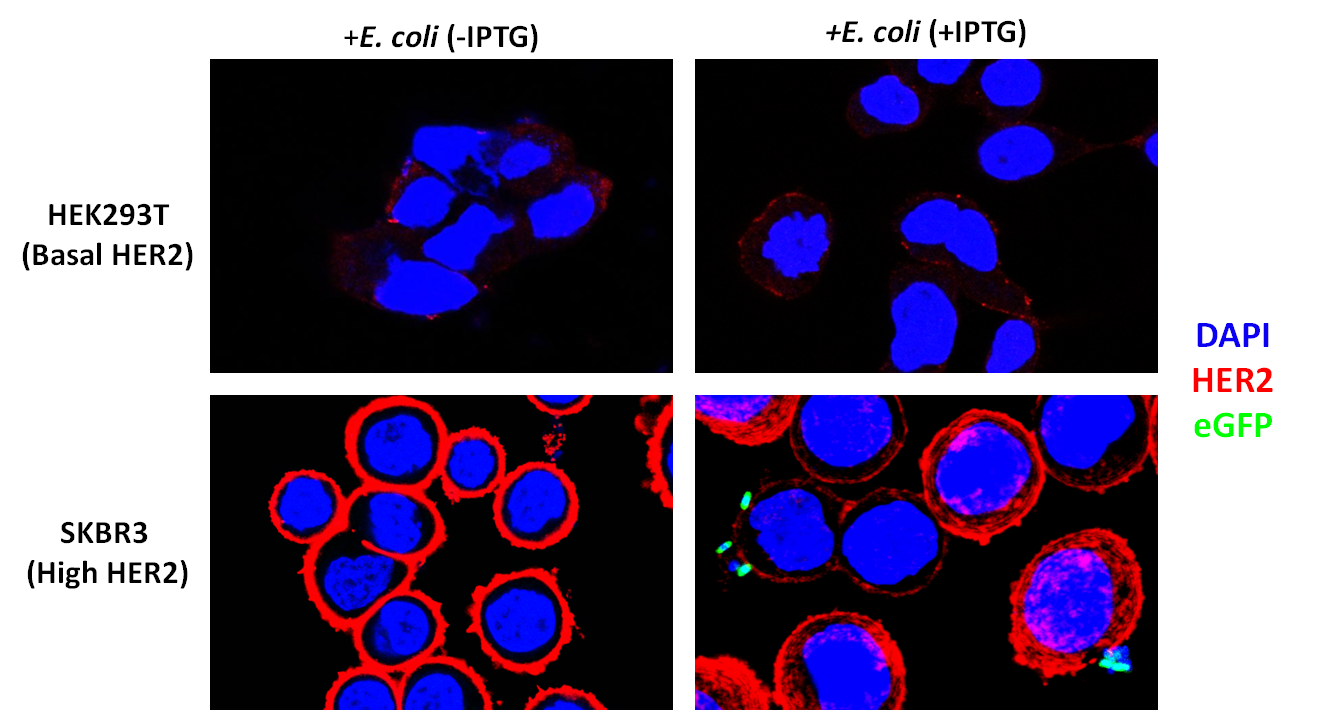
| - | <p style="color:black;text-indent:30px;">To assay whether our DARPin-displaying E. coli bound to SKBR3 cells preferentially, we conducted experiments in which our bacteria were co-incubated with SKBR3 or HEK293T cells. The DARPin-displaying bacteria were co-transformed with eGFP for easy visualization. These experiments are still in progress to optimize the co-incubation and gentamycin protection protocol (we designed this type of experiment ourselves since it has not been done before). However, preliminary results are exciting and show preferential binding to SKBR3 cells (Figure | + | <p style="color:black;text-indent:30px;">To assay whether our DARPin-displaying E. coli bound to SKBR3 cells preferentially, we conducted experiments in which our bacteria were co-incubated with SKBR3 or HEK293T cells. The DARPin-displaying bacteria were co-transformed with eGFP for easy visualization. These experiments are still in progress to optimize the co-incubation and gentamycin protection protocol (we designed this type of experiment ourselves since it has not been done before). However, preliminary results are exciting and show preferential binding to SKBR3 cells (Figure 3).</p> |
<div align="center"> | <div align="center"> | ||
<img src="https://static.igem.org/mediawiki/2012/a/a6/Darpinbinding2.png" width="794" height="425" /></div> | <img src="https://static.igem.org/mediawiki/2012/a/a6/Darpinbinding2.png" width="794" height="425" /></div> | ||
| - | <div class="fig11"><b>Figure | + | <div class="fig11"><b>Figure 3</b>: SKBR3 cells overexpress HER2 and DARPin-displaying bacteria bind to their surface. Red indicates HER2 (Alexa-Fluor 647). Blue indicates DAPI. Green indicates eGFP. Bacteria were co-incubated at a Multiplicity of Infection of 200:1 and washed three times after co-incubation followed by a 50ug/mL gentamicin protection assay.</p></div> |
Revision as of 02:22, 27 October 2012
After verifying that the DARPin was displayed on the cell surface, we sought to test whether it could allow binding to HER2-overexpressing cancer cells. We were generously provided SKBR3 cells by the lab of Matthew Lazzara. These cells are derived from breast cancer cells and over-express HER2. We also obtained Human Embryonic Kidney (HEK) 293T cells, which express a low amount of HER2, to act as controls.
To verify that our SKBR3 cells overexpressed HER2, we immunostained for HER2 (primary anti-Neu Mouse Igg, Santa Cruz Biotechnology and secondary donkey anti-mouse Alexa-Fluor 647 conjugate, Jackson Immunoresearch) and visualized the cells on a confocal microscope. As expected, HER2 was overexpressed in SKBR3 cells (Figure 1).

Figure 1

Figure 2
To assay whether our DARPin-displaying E. coli bound to SKBR3 cells preferentially, we conducted experiments in which our bacteria were co-incubated with SKBR3 or HEK293T cells. The DARPin-displaying bacteria were co-transformed with eGFP for easy visualization. These experiments are still in progress to optimize the co-incubation and gentamycin protection protocol (we designed this type of experiment ourselves since it has not been done before). However, preliminary results are exciting and show preferential binding to SKBR3 cells (Figure 3).

 "
"

