Team:LMU-Munich/Spore Coat Proteins/result
From 2012.igem.org
| Line 75: | Line 75: | ||
{| style="color:black;" cellpadding="0" width="100%" cellspacing="0" border="0" align="center" style="text-align:center;" | {| style="color:black;" cellpadding="0" width="100%" cellspacing="0" border="0" align="center" style="text-align:center;" | ||
|style="width: 70%;background-color: #EBFCE4;" | | |style="width: 70%;background-color: #EBFCE4;" | | ||
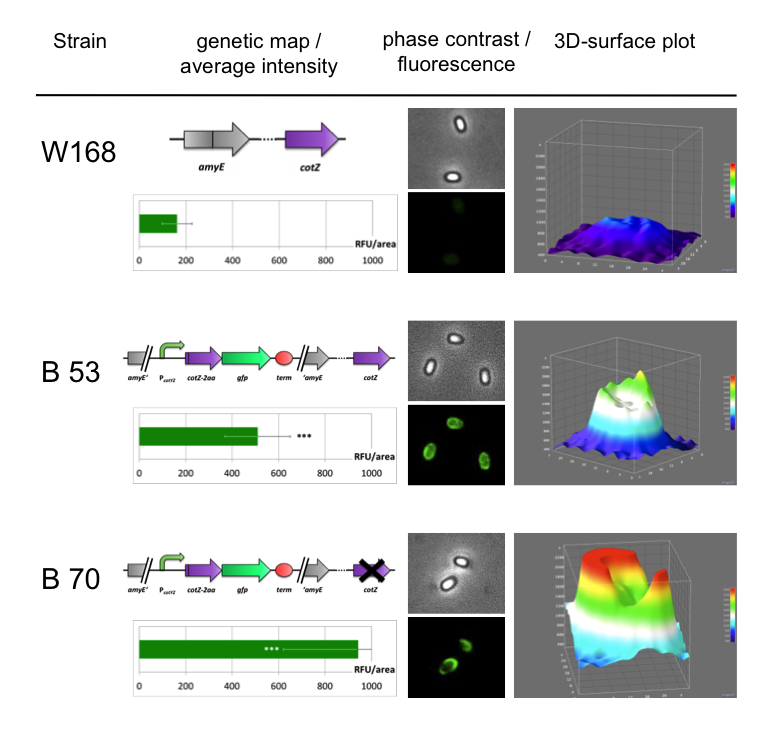
| - | <font color="#000000"; size="2">Fig. 6: Result of fluorescence evaluation of the three strains W168, B53 and B70. The bar charts show the average fluorescence intensity over 100-200 spores. For image analysis we measured the fluorescence intensity of an area of 750 pixel per spore by using ImageJ and evaluated the results with the statistical software R. The 3D graphs illustrate exemplarily for one spore, the distribution of fluorescence intensity across the spore surface. | + | <font color="#000000"; size="2">Fig. 6: Result of fluorescence evaluation of the three strains W168, B53 and B70. The bar charts show the average fluorescence intensity over 100-200 spores. For image analysis we measured the fluorescence intensity of an area of 750 pixel per spore by using ImageJ and evaluated the results with the statistical software R. The 3D graphs illustrate exemplarily for one spore, the distribution of fluorescence intensity across the spore surface.</font> |
|} | |} | ||
|} | |} | ||
Revision as of 14:52, 26 October 2012

The LMU-Munich team is exuberantly happy about the great success at the World Championship Jamboree in Boston. Our project Beadzillus finished 4th and won the prize for the "Best Wiki" (with Slovenia) and "Best New Application Project".
[ more news ]

GFP as a Proof of Principle
Finally, we started with the most important experiment for our GFP-Sporobeads, the fluorescence microscopy. For a better understanding of our results, you can see in the table below the five constructs and strain numbers we used in the following experiments.
| recipient strain W168 | recipient strain B 49 (W168 ΔcotZ) | |
|---|---|---|
| pSBBs1C-PcotYZ-cotZ-2aa-gfp-terminator | B 53 | B 70 |
| pSBBs1C-PcotYZ-cotZ-gfp-terminator | B 54 | B 71 |
| pSBBs1C-PcotV-cotZ-2aa-terminator | B 55 | B 72 |
| pSBBs1C-PcotV-cotZ-terminator | B 56 | B 73 |
| pSBBs1C-PcgeA-cotZ-2aa-terminator | B 52 | B 69 |
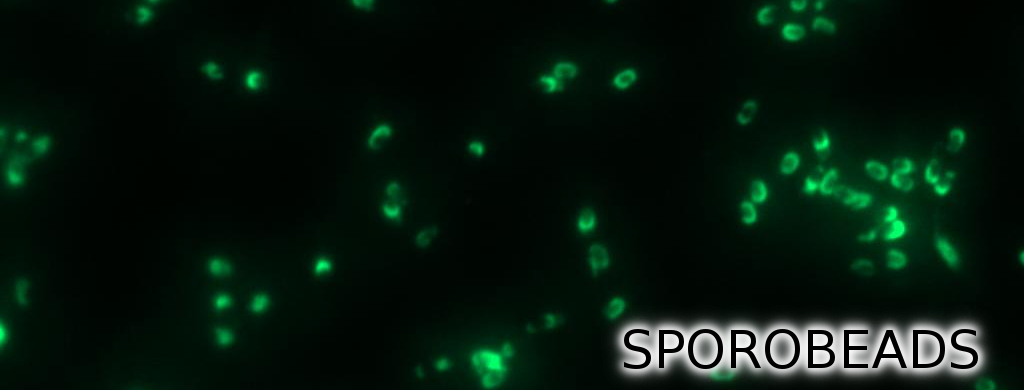
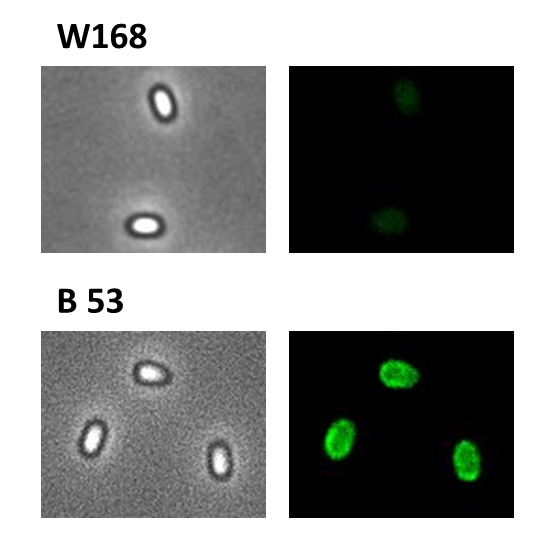
We developed a sporulation protocol (for details see Protocol for enhancement of mature spore numbers) that increases the rates of mature spores in our samples. The cells were fixed on agarose pads and investigated by phase contrast and fluorescence microscopy. While spores of the wild type only showed the known background fluorescence, all Sporobeads showed bright green fluorescence at the edge (on the surface) of the spores. Sporobeads from strain B 53 (containing the PcotYZ-cotZ-2aa-gfp-terminator construct) showed the highest fluorescence intensity (see Fig. 5 and all data). Hence, this strain was chosen for further experiments.
|
Because of the low but distinct fluorescence of wild type spores, we measured and compared the fluorescence intensity of 100 spores per construct (see data). We obtained significant differences between wild type spores and all of our Sporobeads (see data). The following graph (Fig. 6) shows the microscopy pictures and analysis of the strongest of the five constructs integrated into wildtype W168 (B53) and the deletion strain B 49 (B70).
|
| |
|
As shown in Fig. 6, the wild type spore has hardly any fluorescence, whereas both Sporobeads with the integrated construct pSBBs1C-PcotYZ-cotZ-2aa-gfp-terminator give a distinct fluorescence signal around the edge of the spore. Furthermore, it demonstrates that strain B 70 has the highest fluorescence intensity. For more detailed information look at our Data page
In summary we successfully developed functional Sporobeads that are capable of displaying any protein of choice on the surface of modified B. subtilis endospores.
 "
"


