Team:LMU-Munich/Data/gfp spore
From 2012.igem.org
Franzi.Duerr (Talk | contribs) |
|||
| Line 2: | Line 2: | ||
[[File:SporeCoat.png|100px|right|link=Team:LMU-Munich/Spore_Coat_Proteins]] | [[File:SporeCoat.png|100px|right|link=Team:LMU-Munich/Spore_Coat_Proteins]] | ||
| - | |||
| - | |||
| - | |||
Revision as of 13:49, 26 September 2012

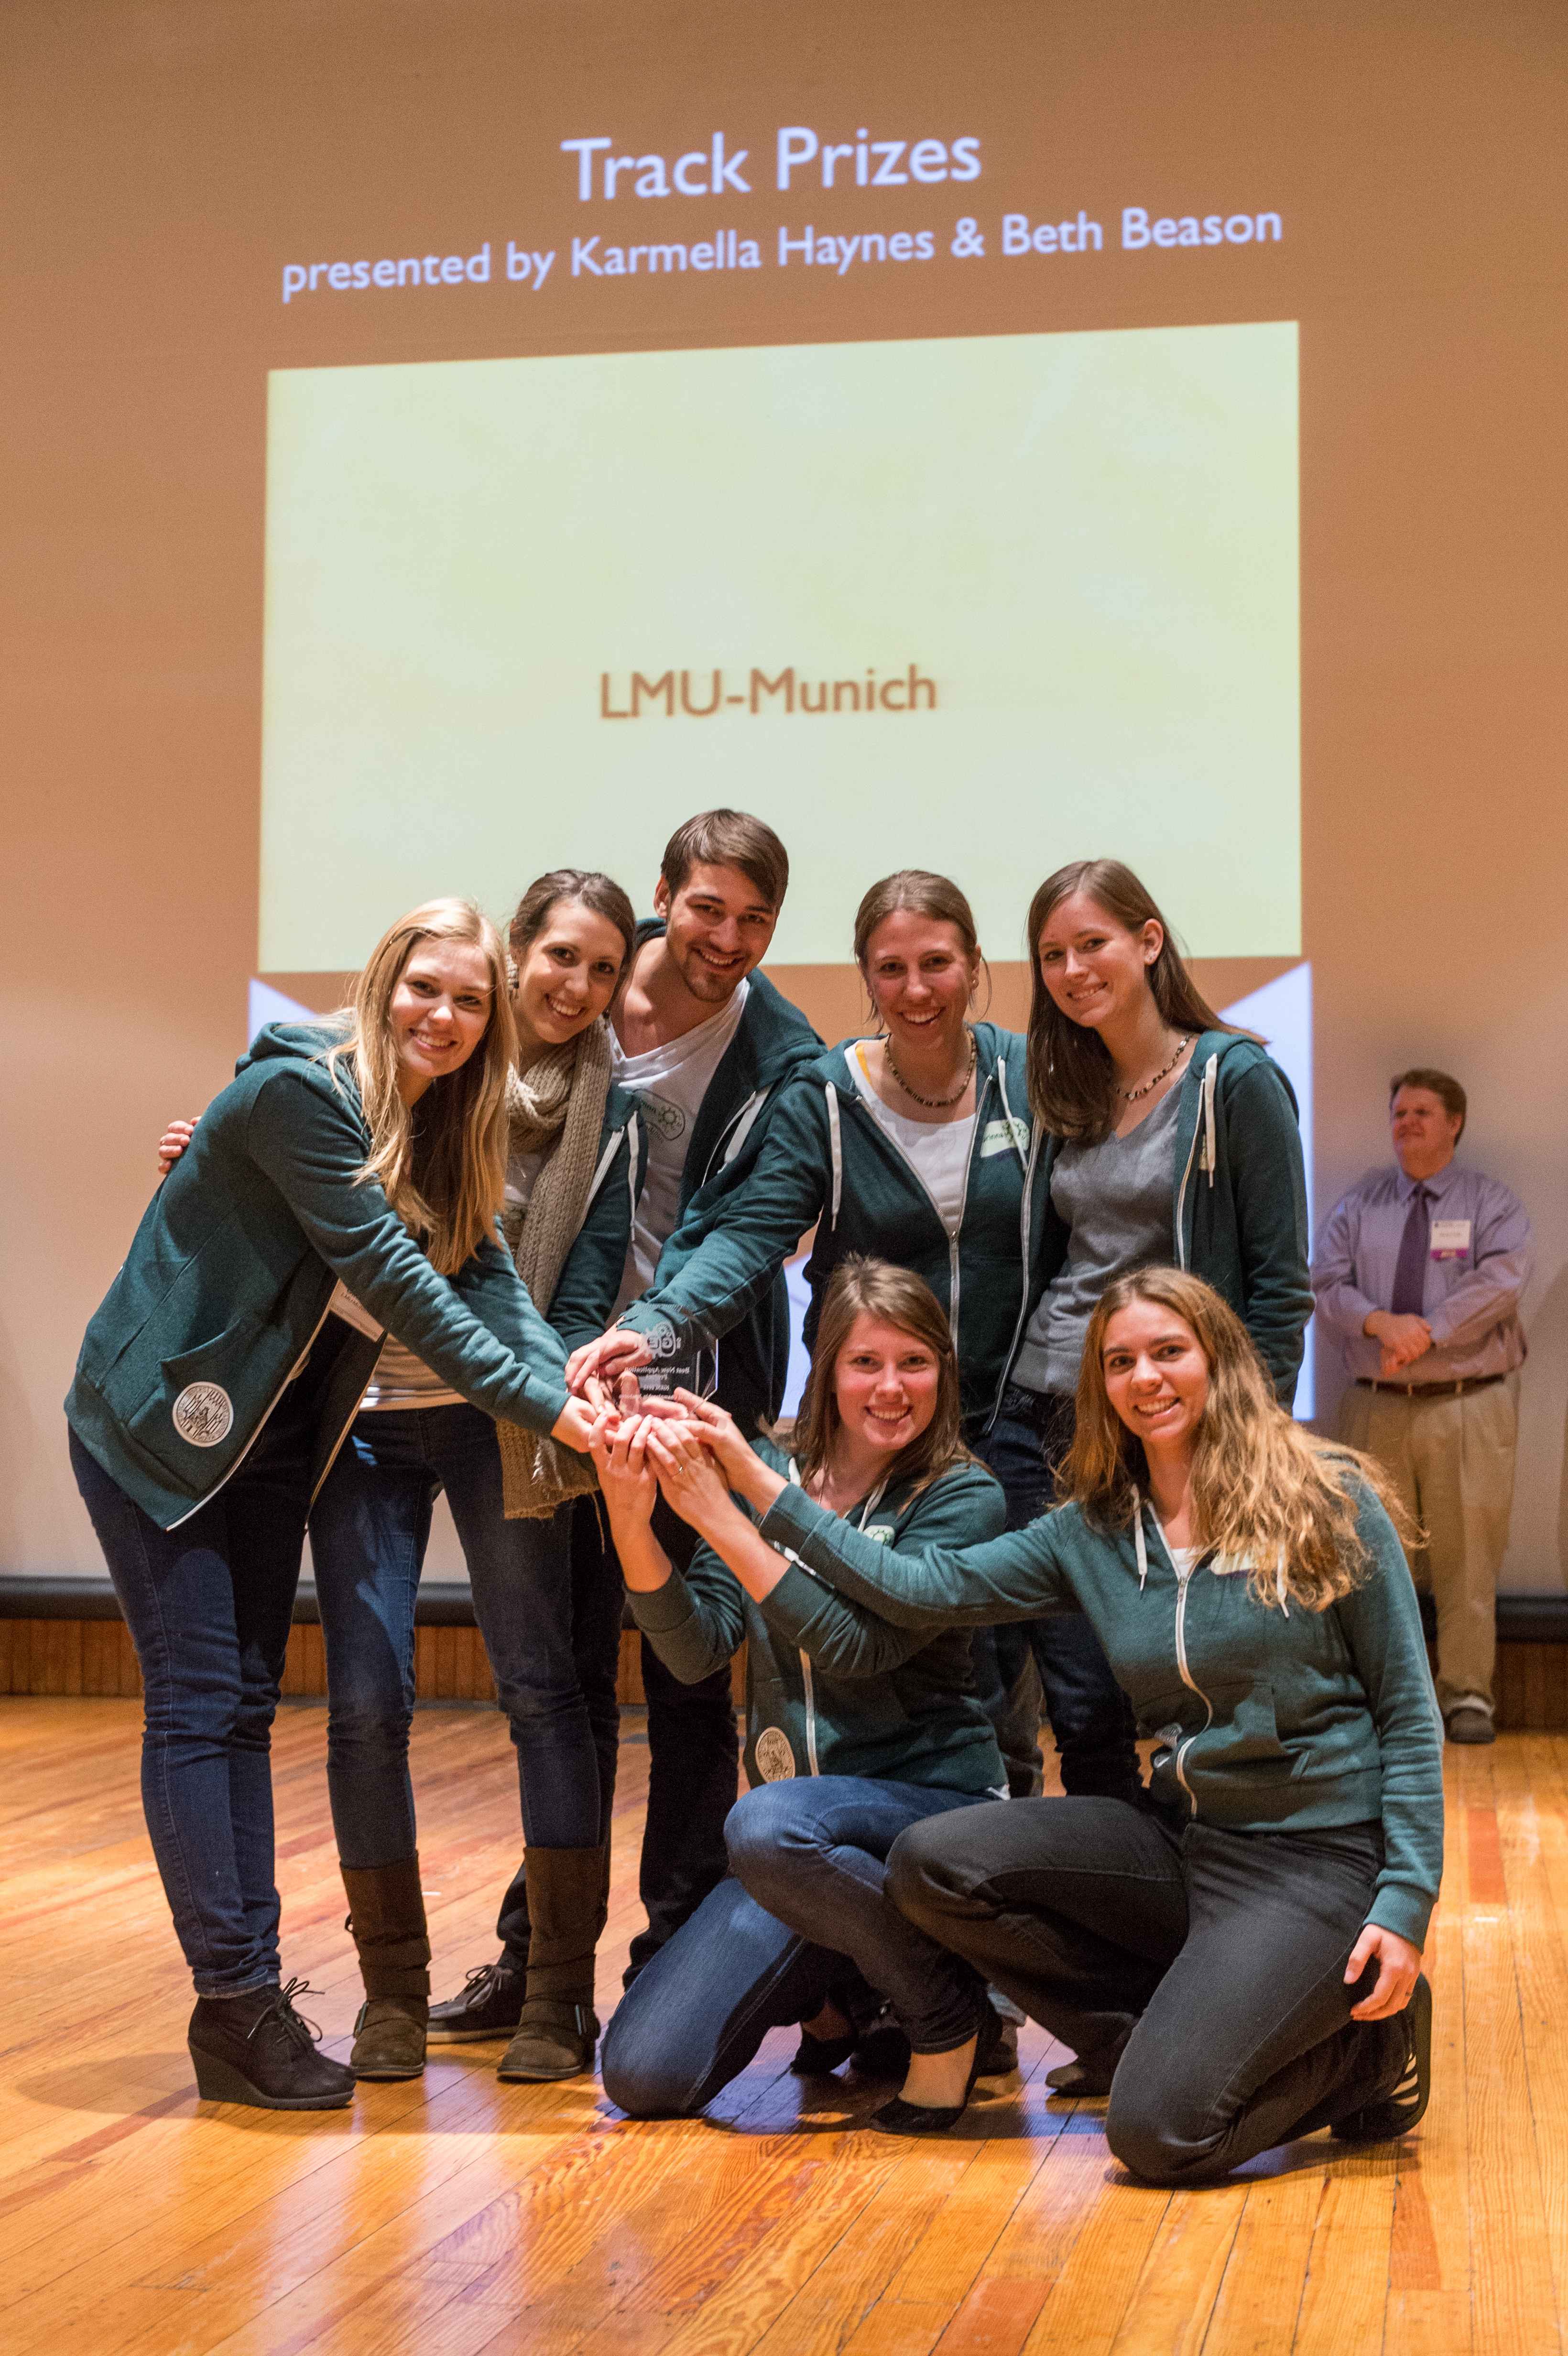
The LMU-Munich team is exuberantly happy about the great success at the World Championship Jamboree in Boston. Our project Beadzillus finished 4th and won the prize for the "Best Wiki" (with Slovenia) and "Best New Application Project".
[ more news ]

GFP-Sporobead Evaluation
For creating fusion proteins for the Sporobeads, the genes gfp, cotZ and cgeA were brought into Freiburg Standard whereas we created two different versions of the crust proteins. The restriction site NgoMIV was inserted just after the startcodon of the gene of the crust protein. Since this restriction site adds six additional basepairs the resulting gene is two codons longer [http://partsregistry.org/wiki/index.php?title=Part:BBa_K823032 CotZ]. It is not know if this insertion has any effect on protein expression that is why we created an additional version in which we deleted the following six basepairs, [http://partsregistry.org/wiki/index.php?title=Part:BBa_K823031 CotZ-2aa].
All the Sporobeads were investigated by fluorescence microscopy and analysed with ImageJ and the statistical software R. The intensity bar charts show the fluorescence intensity, while the 3D graphs illustrate the fluorescence intensity spread across the spore surface, which correlates with the distribution of our fusion proteins. For analysis we measured the fluorescence intensity of a area of 750px per spore by using ImageJ and evaluated it with the statistical software R. The following graph shows the results of microscopy and ImageJ analysis.
It appears the strain B70 with the construct PcotYZ-cotZ-2aa-gfp-terminator and the deleted native cotZ had the strongest fluorescence. Thus this would be the strain for future Sporobeads with special functions. In some 3D graphs the picked cell does not respresent the average fluorescence intensity depicted in the bar chart, because it was chosen randomly.
 "
"


