Team:Shenzhen/Result/YAO.Sensor
From 2012.igem.org
(Difference between revisions)
| Line 37: | Line 37: | ||
<h5>Simulation & Results</h5> | <h5>Simulation & Results</h5> | ||
<ul><li>I. Transportation of REX into Mitochondrial Matrix</li></ul> | <ul><li>I. Transportation of REX into Mitochondrial Matrix</li></ul> | ||
| - | <ul><p> | + | <ul><p>assume that the transcription of SP-REX is constant, SP-REX concentration in cytoplasm is constant, the probably for REX to be transported into each mitochondrion is equal, and mitochondria are of similar size. So with different number of mitochondria in yeast (Nm), the concentration of REX in each mitochondria (Ctf) might differ. Ksp is the transport coefficient of signal peptid which links the XR/Nm with Ctf. For different kinds of signal peptid, Ksp might be different.</p></ul> |
<ul><p>[[File:Eqn1.jpg]] (1)</p> | <ul><p>[[File:Eqn1.jpg]] (1)</p> | ||
<p><i>XSR: SP-REX concentration in cytoplasm. Nm: Number of mitochondria. Crex: Concentration of REX in Mitochondria. Ksp: Transport coefficient of signal peptid.</i></p></ul> | <p><i>XSR: SP-REX concentration in cytoplasm. Nm: Number of mitochondria. Crex: Concentration of REX in Mitochondria. Ksp: Transport coefficient of signal peptid.</i></p></ul> | ||
<ul><li>II. Activation of REX as a Transcription Factor with NAD+ and NADH</li></ul> | <ul><li>II. Activation of REX as a Transcription Factor with NAD+ and NADH</li></ul> | ||
| - | <ul><p> | + | <ul><p>NAD+ and NADH can competitively bind to the same site of REX, when NADH binds to REX, REX will be repressed and cannot bind to ROP. Then the transcription function is repressed. </p></ul> |
<ul><p>[[File:Eqn2.jpg]]</p> | <ul><p>[[File:Eqn2.jpg]]</p> | ||
<p><i>H stands for NADH, REXH stands for REX bidden with NADH.</i></p></ul> | <p><i>H stands for NADH, REXH stands for REX bidden with NADH.</i></p></ul> | ||
| Line 65: | Line 65: | ||
<ul><li>III. Control of promoter activity by REX</li></ul> | <ul><li>III. Control of promoter activity by REX</li></ul> | ||
| - | <ul>< | + | <ul><pIn yeast mitochondria, transcription initiation factor MTF1, combined with RNA polymerase Rpo41, bind to promoter to initiate transcription. It is MTF1 that discerns the promoter region, and the binding of MTF1 on promoter region is reversible. Also the binding of REX on ROP, a DNA region near promoter is also reversible.</p></ul> |
<ul><p>[[File:Eqn11.jpg]]</p> | <ul><p>[[File:Eqn11.jpg]]</p> | ||
<p><i>P stands for promoter, RP stands for repressor, i.e. REX’, and PRP stands for promoter bidden with repressor.</i></p></ul> | <p><i>P stands for promoter, RP stands for repressor, i.e. REX’, and PRP stands for promoter bidden with repressor.</i></p></ul> | ||
| Line 81: | Line 81: | ||
<p>[[File:Eqn19.jpg]] (13)</p></ul> | <p>[[File:Eqn19.jpg]] (13)</p></ul> | ||
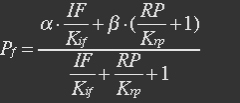
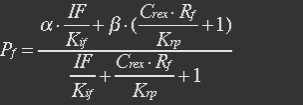
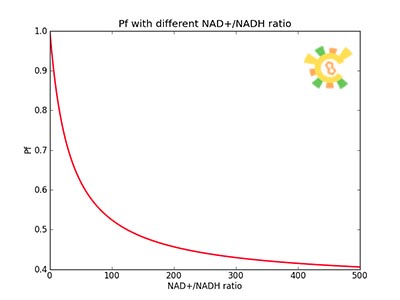
<ul><p>So the fraction will be:</p></ul> | <ul><p>So the fraction will be:</p></ul> | ||
| - | <ul><p>[[File:Eqn20.jpg]] (14)</p | + | <ul><p>[[File:Eqn20.jpg]] (14)</p> |
<p><i>α=1,Kif=5μM, Krp=5μM, IF=1mM was assumed [5] in this equation.</i></p></ul> | <p><i>α=1,Kif=5μM, Krp=5μM, IF=1mM was assumed [5] in this equation.</i></p></ul> | ||
<ul><div class="figurep"> | <ul><div class="figurep"> | ||
| Line 94: | Line 94: | ||
<ul><li>IV. Synthesis and degradation of mRNA</li></ul> | <ul><li>IV. Synthesis and degradation of mRNA</li></ul> | ||
| - | mRNA is produced from the transcription of the active promoter. Concentration of mitochondrial levels of mRNA (XmRNA) can be derived from the mRNA balance: | + | <ul><p>mRNA is produced from the transcription of the active promoter. Concentration of mitochondrial levels of mRNA (XmRNA) can be derived from the mRNA balance: </p></ul> |
| - | + | <ul><p>[[File:Eqn21.jpg]]</p></ul> | |
| - | Here it is assumed that mRNA is degraded corresponding to a first order reaction and that mRNA is not exported from the cell. | + | <ul><p>Here it is assumed that mRNA is degraded corresponding to a first order reaction and that mRNA is not exported from the cell. </p></ul> |
| - | The term μXmRNA represents the dilution due to growth. However mRNA is highly unstable and is thus degraded fast. This makes Kdm+μ≈Kdm, simplify the mRNA balance to: | + | <ul><p>The term μXmRNA represents the dilution due to growth. However mRNA is highly unstable and is thus degraded fast. This makes Kdm+μ≈Kdm, simplify the mRNA balance to: </p></ul> |
| - | + | <ul><p>[[File:Eqn22.jpg]] (16)</p></ul> | |
| - | It is assumed that when RNA polymerase is efficiently bound to the promoter, the promoter is active and mRNA is transcribed at constant maximum rate | + | <ul><p>It is assumed that when RNA polymerase is efficiently bound to the promoter, the promoter is active and mRNA is transcribed at constant maximum rate [[File:Eqn23.jpg]] . The binding of RNA polymerase is dependent on Pf. In the overall production rate of mRNA, the number of promoters (and genes) Np is also influencing: </p></ul> |
| - | + | <ul><p>[[File:Eqn24.jpg]] (17)</p></ul> | |
| - | With (16) and (17), the mRNA balance equation becomes | + | <ul><p>With (16) and (17), the mRNA balance equation becomes</p> |
| - | + | <p>[[File:Eqn25.jpg]] (18)</p></ul> | |
| - | At equilibrium | + | <ul><p>At equilibrium: [[File:Eqn26.jpg]] , so</p> |
| - | + | <p>[[File:Eqn27.jpg]] (19)</p></ul> | |
| - | + | <ul><p> | |
| - | + | <ul><div class="figurep"> | |
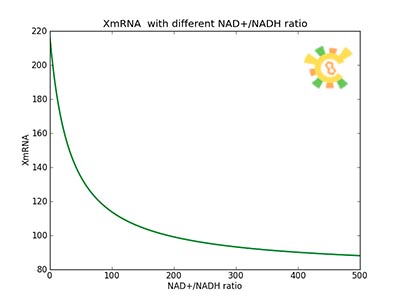
| - | β=0.05, Vmax = 180 U/h (assuming 75 bases per second, and 1500 bases in gene), Np=10 (1 micron plasmid is used), Kdm=8.3 h-1 (half life = 5 min) was used to plot this picture. | + | [[File:result_yao_sensor_p5.jpg]] |
| + | <p>Figure 5. XmRNA with different NAD+/NADH ratio.</p><p>β=0.05, Vmax = 180 U/h (assuming 75 bases per second, and 1500 bases in gene), Np=10 (1 micron plasmid is used), Kdm=8.3 h-1 (half life = 5 min) was used to plot this picture.</p></div></ul> | ||
<ul><li>V. Synthesis, dilution and degradation of GFP</li></ul> | <ul><li>V. Synthesis, dilution and degradation of GFP</li></ul> | ||
| - | The GFP protein balance: | + | <ul><p>The GFP protein balance:</p> |
| - | + | <p>[[File:Eqn28.jpg]] (20)</p></ul> | |
| - | It is assumed that GFP is degraded by first order rate. The dilution cannot be neglected since protein degradation is much slower than mRNA degradation. Furthermore it is assumed that GFP is not transported out of the cell. | + | <ul><p>It is assumed that GFP is degraded by first order rate. The dilution cannot be neglected since protein degradation is much slower than mRNA degradation. Furthermore it is assumed that GFP is not transported out of the cell. </p></ul> |
| - | The protein is synthesized by ribosomes. The number of ribosomes bound to one mRNA (Np) and the protein production rate of the ribosome (Kp) should be taken into account. The number of ribosomes in the cell, ATP and available charged amino acids are assumed to be non-limiting. Taking this into account, the protein synthesis rate can be described as | + | <ul><p>The protein is synthesized by ribosomes. The number of ribosomes bound to one mRNA (Np) and the protein production rate of the ribosome (Kp) should be taken into account. The number of ribosomes in the cell, ATP and available charged amino acids are assumed to be non-limiting. Taking this into account, the protein synthesis rate can be described as </p> |
| - | + | <p>[[File:Eqn29.jpg]] (21)</p> | |
| - | With (21) in (20), | + | <p>With (21) in (20),</p> |
| - | + | <p>[[File:Eqn30.jpg]] (22)</p></ul> | |
| - | At equilibrium , so | + | <ul><p>At equilibrium , so</p> |
| - | + | <p>[[File:Eqn31.jpg]] (23)</p> | |
| - | Nrib = 1. Kp = 288 U/h, assuming 40 amino acids per second. KdGFP = 1.386 h-1 equal to a half time of 30 min [3]. Growth rate = 0.1 h-1 | + | <p><i>Nrib = 1. Kp = 288 U/h, assuming 40 amino acids per second. KdGFP = 1.386 h-1 equal to a half time of 30 min [3]. Growth rate = 0.1 h-1.</i></p></ul> |
| - | + | <ul><div class="figurep"> | |
| - | Figure | + | [[File:result_yao_sensor_p6.jpg]] |
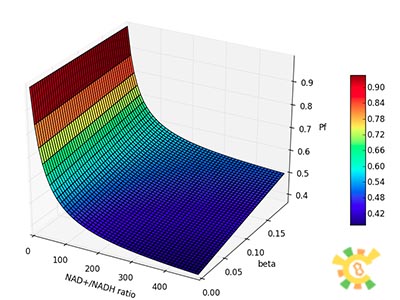
| - | X | + | <p>Figure 6. XGFP with different β and changing NAD+/NADH ratio.</p><p>X axis: NAD+/NADH ratio, range from 0 to 500, Y axis:β, range from 0 to 0.2, Z axis:XGFP unit.</p></div></ul> |
| - | + | <ul><div class="figurep"> | |
| - | + | [[File:result_yao_sensor_p7.jpg]] | |
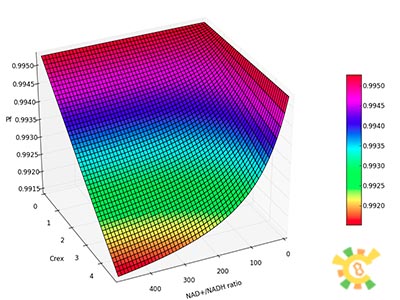
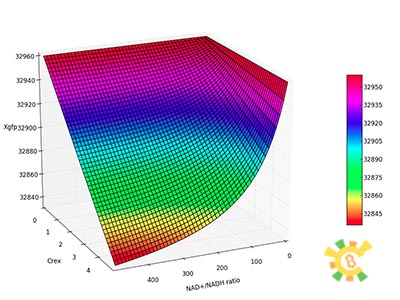
| - | Figure 7 | + | <p>Figure 7. XGFP with different Crex and changing NAD+/NADH ratio.</p><p>X axis: NAD+/NADH ratio, range from 0 to 500, Y axis:Crex , range from 0mM to 5mM, Z axis:XGFP unit. </p></div></ul> |
| - | X | + | <ul><div class="figurep"> |
| - | + | [[File:result_yao_sensor_p8.jpg]] | |
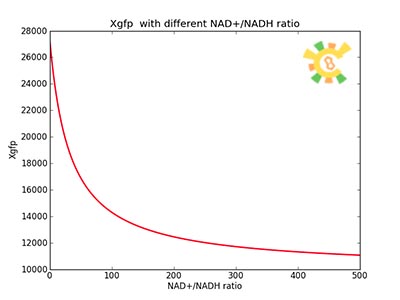
| - | Figure 8: XGFP with different NAD+/NADH ratio | + | <p>Figure 8. Figure 8: XGFP with different NAD+/NADH ratio.</p></div></ul> |
| - | + | <ul><p>Response for Dynamic states</p></ul> | |
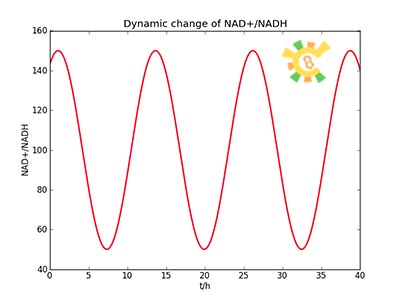
| - | Response for Dynamic states | + | <ul><p>Because the NAD+/NADH level might change in times, so we assume that the change is sinusoidal function as follows: </p> |
| - | Because the NAD+/NADH level might change in times, so we assume that the change is sinusoidal function as follows: | + | <p> NH=Asin(t/2)+B</p> |
| - | NH=Asin(t/2)+B | + | <p> A=100, B=50, t=0~40. </p></ul> |
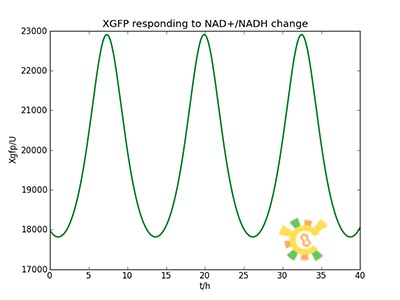
| - | A=100, B=50, t=0~40. | + | <ul><p>The curve is shown in Figure 9. Then as a result the production of GFP might also changes as a response to the change in NAD+/NADH.</p></ul> |
| - | The curve is shown in Figure 9. Then as a result the production of GFP might also changes as a response to the change in NAD+/NADH | + | <ul><div class="figurep"> |
| - | + | [[File:result_yao_sensor_p9.jpg]] | |
| - | Figure 9 | + | <p>Figure 9. Dynamic change of NAD+/NADH</p></div></ul> |
| - | + | <ul><div class="figurep"> | |
| - | Figure 10 | + | [[File:result_yao_sensor_p10.jpg]] |
| + | <p>Figure 10. Response in GFP production</p></div></ul> | ||
<div class="context"> | <div class="context"> | ||
Revision as of 13:25, 25 September 2012
 "
"


