Team:Shenzhen/Result/YAO.Sensor
From 2012.igem.org
(Difference between revisions)
| Line 60: | Line 60: | ||
<ul><p>With (5), (4), (2) and (3) in (6), the fraction becomes</p></ul> | <ul><p>With (5), (4), (2) and (3) in (6), the fraction becomes</p></ul> | ||
<ul><p>[[File:Eqn10.jpg]] (7)</p></ul> | <ul><p>[[File:Eqn10.jpg]] (7)</p></ul> | ||
| - | + | <ul><div class="figurep"> | |
| - | <div class="figurep"> | + | |
[[File:result_yao_sensor_p1.jpg]] | [[File:result_yao_sensor_p1.jpg]] | ||
| - | <p>Figure 1. Rf responding to different NAD+/NADH ratio.</p><p>For plotting of this picture the following parameters were used: assuming K_H = 0,02 μM and K_N = 2 μM since REX NADH affinity > REX NAD affinity [2]. </p></div> | + | <p>Figure 1. Rf responding to different NAD+/NADH ratio.</p><p>For plotting of this picture the following parameters were used: assuming K_H = 0,02 μM and K_N = 2 μM since REX NADH affinity > REX NAD affinity [2]. </p></div></ul> |
| - | |||
<ul><li>III. Control of promoter activity by REX</li></ul> | <ul><li>III. Control of promoter activity by REX</li></ul> | ||
| - | In yeast mitochondria, transcription initiation factor MTF1, combined with RNA polymerase Rpo41, bind to promoter to initiate transcription. It is MTF1 that discerns the promoter region, and the binding of MTF1 on promoter region is reversible. Also the binding of REX on ROP, a DNA region near promoter is also reversible. | + | <ul><p> In yeast mitochondria, transcription initiation factor MTF1, combined with RNA polymerase Rpo41, bind to promoter to initiate transcription. It is MTF1 that discerns the promoter region, and the binding of MTF1 on promoter region is reversible. Also the binding of REX on ROP, a DNA region near promoter is also reversible.</p></ul> |
| - | + | <ul><p>[[File:Eqn11.jpg]]</p> | |
| - | P stands for promoter, RP stands for repressor, i.e. REX’, and PRP stands for promoter bidden with repressor. | + | <p><i>P stands for promoter, RP stands for repressor, i.e. REX’, and PRP stands for promoter bidden with repressor.</i></p></ul> |
| - | At equilibrium: | + | <ul><p>At equilibrium: [[File:Eqn12.jpg]] (8)</p> |
| - | + | <p>[[File:Eqn13.jpg]]</p> | |
| - | P stands for promoter, IF stands for initiation factor i.e. MTF1, and PRP stands for promoter bidden with initiation factor. | + | <p><i>P stands for promoter, IF stands for initiation factor i.e. MTF1, and PRP stands for promoter bidden with initiation factor.</i></p></ul> |
| - | At equilibrium: | + | <ul><p>At equilibrium: [[File:Eqn14.jpg]] (9)</p></ul> |
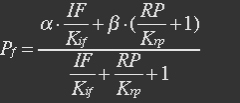
| - | Because most of promoters bidden with IF can started transcription, and few of promoters bidden by repressor or not bidden with any TF will transcript. So two coefficient α and β are assumed to reflect the relations. | + | <ul><p>Because most of promoters bidden with IF can started transcription, and few of promoters bidden by repressor or not bidden with any TF will transcript. So two coefficient α and β are assumed to reflect the relations.</p></ul> |
| - | + | <ul><p>[[File:Eqn15.jpg]] [[File:Eqn16.jpg]] (10)</p></ul> | |
| - | The fraction of promoters that can be transcribed is Pf. | + | <ul><p>The fraction of promoters that can be transcribed is Pf.</p></ul> |
| - | + | <ul><p>[[File:Eqn17.jpg]] (11)</p></ul> | |
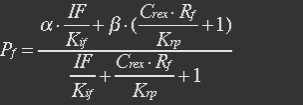
| - | With (10), (8) and (9) in (11), the fraction becomes | + | <ul><p>With (10), (8) and (9) in (11), the fraction becomes</p> |
| - | + | <p>[[File:Eqn18.jpg]] (12)</p> | |
| - | And | + | <p>And</p> |
| - | + | <p>[[File:Eqn19.jpg]] (13)</p></ul> | |
| - | So the fraction will be: | + | <ul><p>So the fraction will be:</p></ul> |
| - | + | <ul><p>[[File:Eqn20.jpg]] (14)</p></ul> | |
| - | α=1,Kif=5μM, Krp=5μM, IF=1mM was assumed [5] in this equation. | + | <p><i>α=1,Kif=5μM, Krp=5μM, IF=1mM was assumed [5] in this equation.</i></p></ul> |
| - | + | <ul><div class="figurep"> | |
| - | Figure | + | [[File:result_yao_sensor_p2.jpg]] |
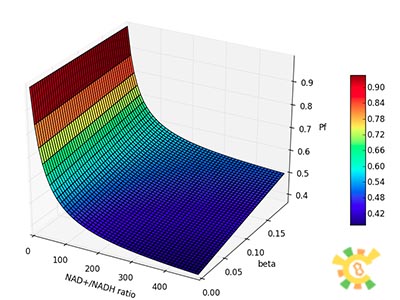
| - | X axis:NAD+/NADH ratio, range from 0 to 500, Y axis:β, range from 0 to 0.2, Z axis:Pf. | + | <p>Figure 2. Pf with different β and changing NAD+/NADH ratio. </p><p>X axis:NAD+/NADH ratio, range from 0 to 500, Y axis:β, range from 0 to 0.2, Z axis:Pf. </p></div></ul> |
| - | + | <ul><div class="figurep"> | |
| - | Figure | + | [[File:result_yao_sensor_p3.jpg]] |
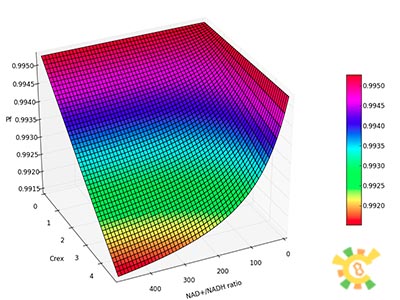
| - | X axis:NAD+/NADH ratio, range from 0 to 500, Y axis:Crex , range from 0mM to 5mM, Z axis:Pf. | + | <p>Figure 3. Pf with different Crex and changing NAD+/NADH ratio.</p><p>X axis:NAD+/NADH ratio, range from 0 to 500, Y axis:Crex , range from 0mM to 5mM, Z axis:Pf. </p></div></ul> |
| - | + | <ul><div class="figurep"> | |
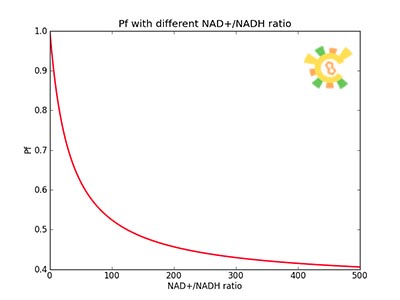
| - | Figure | + | [[File:result_yao_sensor_p4.jpg]] |
| - | β=0.05, Crex= 2mM was used to plot this picture. | + | <p>Figure 4. Pf with different NAD+/NADH ratio.</p><p>β=0.05, Crex= 2mM was used to plot this picture.</p></div></ul> |
<ul><li>IV. Synthesis and degradation of mRNA</li></ul> | <ul><li>IV. Synthesis and degradation of mRNA</li></ul> | ||
Revision as of 13:09, 25 September 2012
 "
"


