Team:Amsterdam/modeling/generaldesign
From 2012.igem.org
(Difference between revisions)
(→In practice) |
|||
| Line 170: | Line 170: | ||
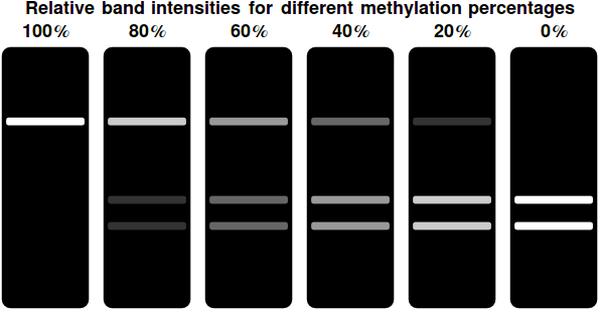
[[File:bands.jpeg|center|frame|300px|Gel representations for a range of different <math>F(t)</math> values. Complete methylation of all bits results in a single, bright band at the top of the gel. This indicates the undigested, linearized plasmid. Decreasing the amount of methylated bits shifts the intensity of the top band away to the two bottom bands. These indicate the linearized & successfully digested plasmid]] | [[File:bands.jpeg|center|frame|300px|Gel representations for a range of different <math>F(t)</math> values. Complete methylation of all bits results in a single, bright band at the top of the gel. This indicates the undigested, linearized plasmid. Decreasing the amount of methylated bits shifts the intensity of the top band away to the two bottom bands. These indicate the linearized & successfully digested plasmid]] | ||
| - | In a typical laboratory situation, doing a restriction enzyme assay on the miniprep-extracted plasmid DNA out of followed by gel electrophoresis will be the most convenient way to assess the methylation status of the bits. The relative intensities of the gel bands can then be used to infer <math>F(t)</math> | + | In a typical laboratory situation, doing a restriction enzyme assay on the miniprep-extracted plasmid DNA out of followed by gel electrophoresis will be the most convenient way to assess the methylation status of the bits. The relative intensities of the gel bands can then be used to infer <math>F(t)</math>. Unmethylated bits will result in successfully digested DNA fragments and thus two bands of shorter DNA fragments. Methylated bits will not be cut and will therefore result in one longer band, shown more to the top of the gel. Thus the top and two bottom gel bands are mutually exclusive as they indicate the same (linearized) plasmid DNA to either be digested, resulting in the two bottom bands, or undigested, resulting in the top band. A high value for <math>F(t)</math> indicates recent detection of the signal, whereas a low value indicates detection to have occurred longer ago. To get a hands-on feel of the effects that the plasmid degradation and replication rate have on <math>F(t)</math>, an interactive version in Mathematica is included in the attached Mathematica file. |
== References == | == References == | ||
Revision as of 11:35, 23 September 2012
 "
"


