Team:University College London/LabBook/Week15
From 2012.igem.org
(Difference between revisions)
(→15.2) |
(→15.2) |
||
| Line 38: | Line 38: | ||
<img id="15.3" src="https://static.igem.org/mediawiki/2012/1/13/Ucl2012-labbook-graph7-1.png" /> | <img id="15.3" src="https://static.igem.org/mediawiki/2012/1/13/Ucl2012-labbook-graph7-1.png" /> | ||
<div class="experimentContent"></html> | <div class="experimentContent"></html> | ||
| + | |||
| + | |||
| + | [[File:Gel2table2week15.png]] | ||
== 15.3 == | == 15.3 == | ||
Revision as of 18:50, 26 September 2012


15.1
Moday (17.09.12) 3A assembly
Aim – Start 3A assembly to ligate:
- the first (BBa_K729004 and plasmid backbone PSB1C3 ) and second ( BBa_J23119 +BBa_0034) construct
- the first (BBa_K729003 and plasmid backbone PSB1C3 ) and second ( BBa_J23119 +BBa_0034) construct
- the first (plasmid backbone PSB1K3 and BBa_K118011 ) and second ( BBA_I746916 and plasmid backbone PSB1K3) construct
- the first (plasmid backbone PSB1K3 and BBa_K118011 ) and second ( BBA_I746916 and plasmid backbone PSB1K3) construct
- pstA promoter (BBA_I719005) and the GFP (BBA_I712069)
- the Biobricks BBa_I746909 and BBa_K729007 to generate a Biobrick that contains pcstA-T7RNAP-pT7-GFP-TT
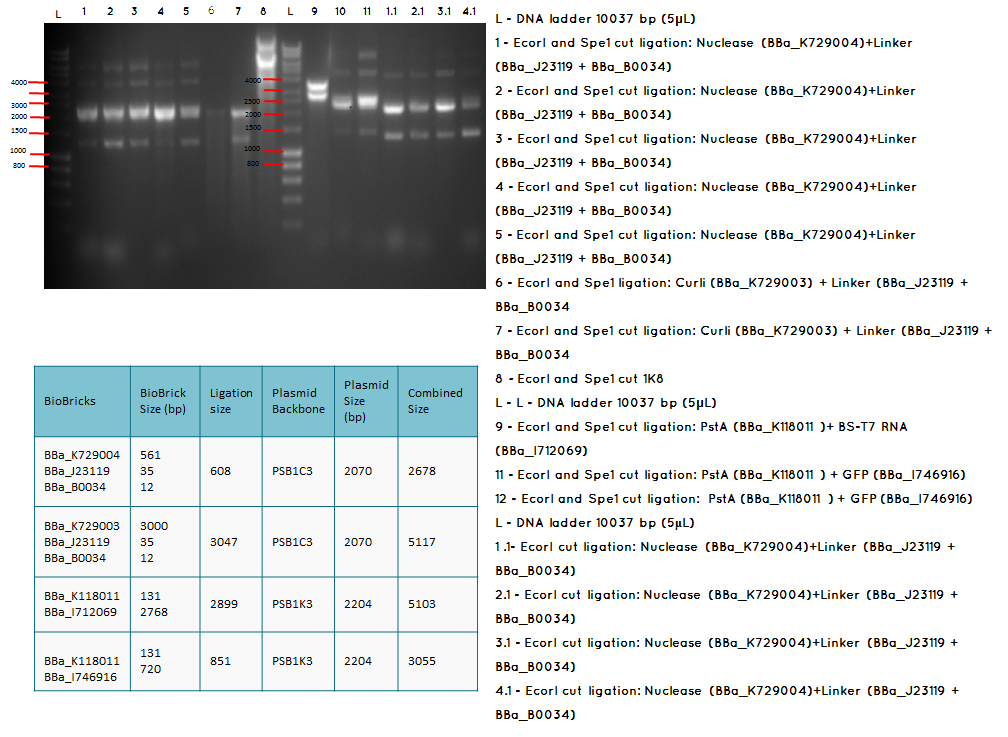
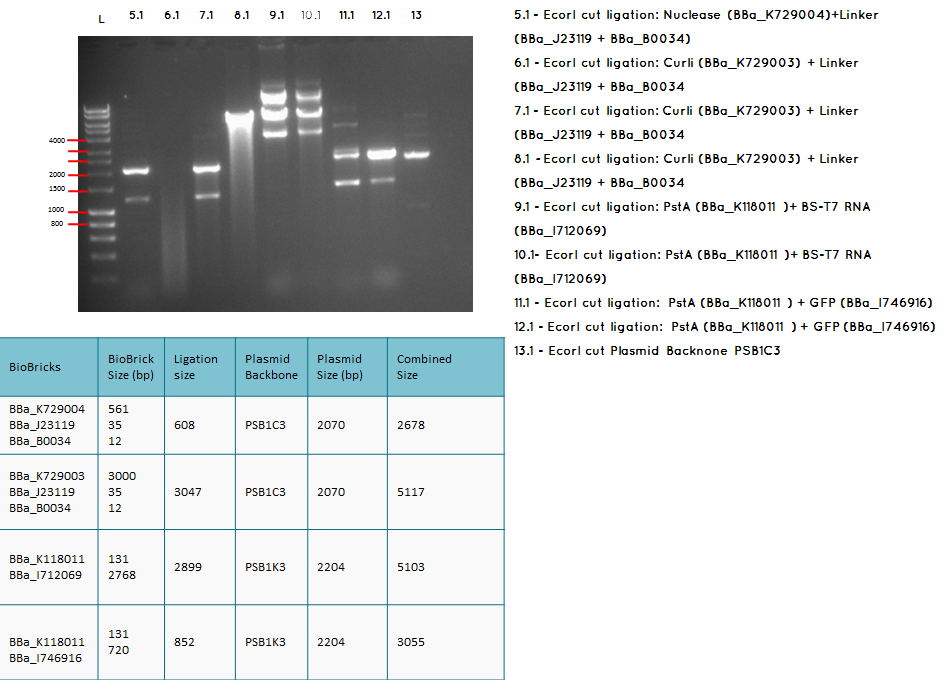
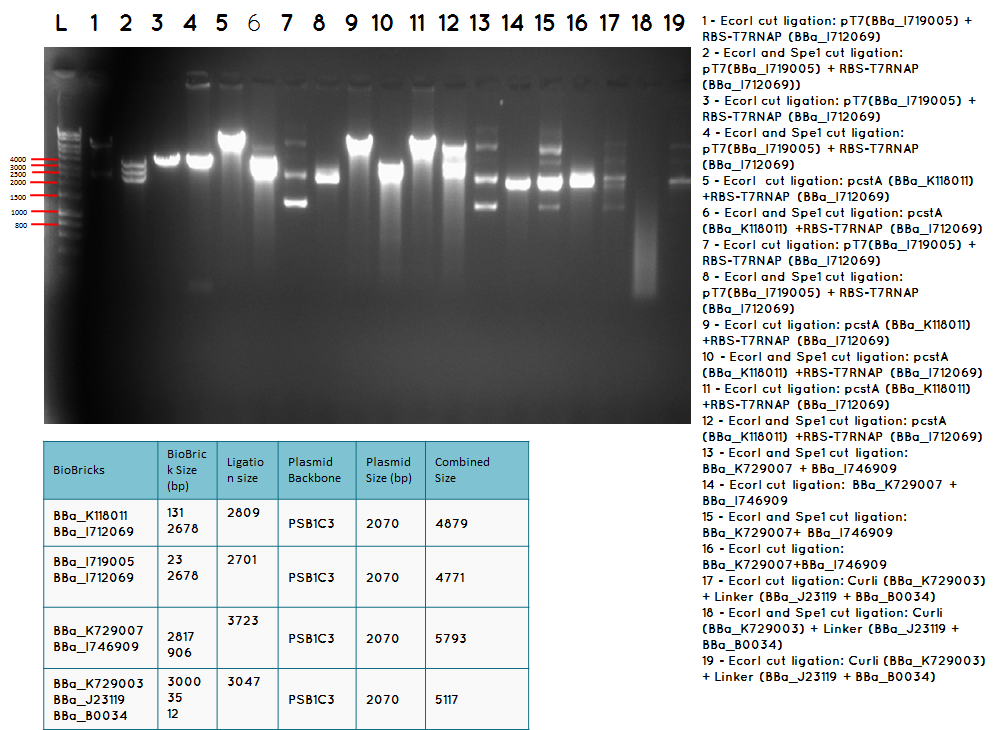
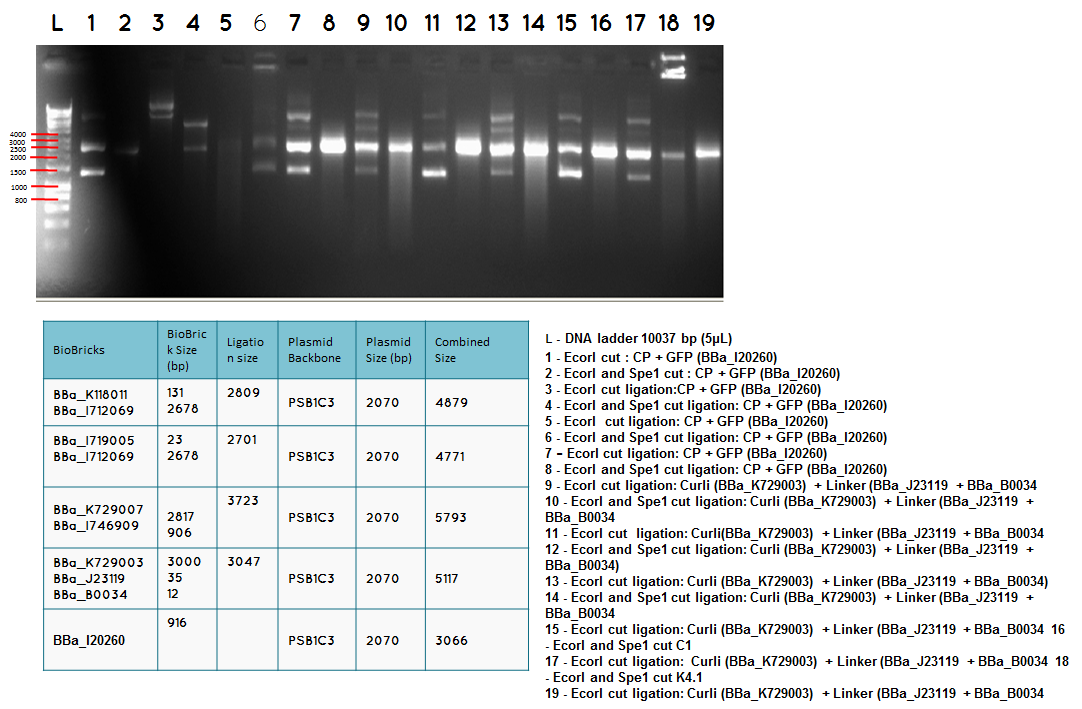
Conclusion: The bands that we obtained on the gel did not correspond to the sizes we were expecting. For most of the samples we could clearly see a band at around 2000 which most probably is the backbone. These confusing results may be due to mistakes during the ligation or the enzyme digestion. Contamination is another possible reason for these results.


 "
"


