Team:Cambridge/Project/MagnesiumRiboswitch
From 2012.igem.org
| Line 13: | Line 13: | ||
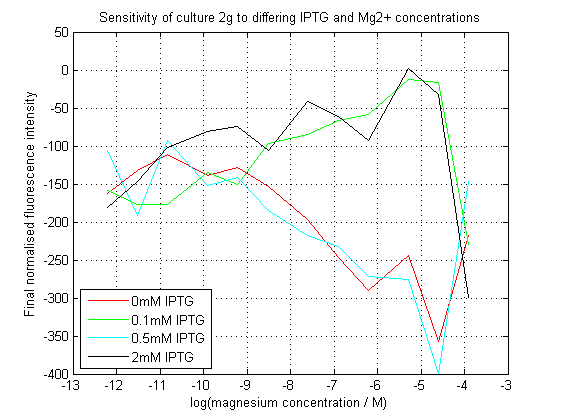
[[File:2gAssay.png|left|450px|thumb|Normalized final fluorescence readings from our construct. Readings were adjusted against final OD620. The construct did not work as expected. ]] | [[File:2gAssay.png|left|450px|thumb|Normalized final fluorescence readings from our construct. Readings were adjusted against final OD620. The construct did not work as expected. ]] | ||
| - | We succeeded in creating this construct, and had its sequence verified independently. | + | We succeeded in creating this construct, and had its sequence verified independently. As can be seen, our initial assay did not give the expected results. At differing IPTG concentrations, the response to magnesium seems to have inverted. |
| + | |||
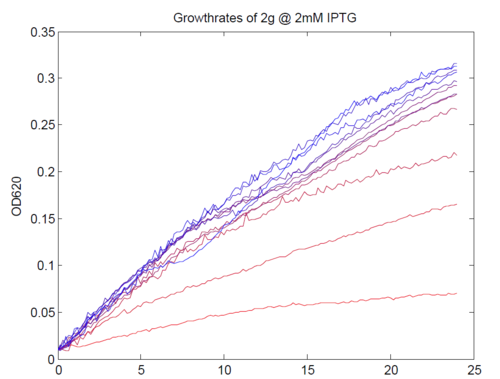
| + | [[Image:AssayGrowthCurves.png|left|500px|thumb|Typical growth curves of our construct. Magnesium concentrations varied from 1 μM (most red) to 5mM (most green).]] | ||
| + | |||
| + | We repeated this experiment, using a different range of magnesium concentrations (1μM - 5mM) and doing duplicates in alternate rows. The cells grew well, although they did not appear to do so in an exponential fashion. It is believed that this may be a feature of the minimal medium in which we were performing the assay, as failed tests using a rich defined medium (which, unfortunately, autofluoresced at GFP wavelengths due to the aromatic amino acids it contained) showed normal exponential growth with the same construct and at identical magnesium concentrations. | ||
| + | |||
| + | Having collected OD620 data as well as fluorescence data, we hoped to generate graphs containing fluorescence readings normalized to cell density. We used the following formula to normalize our data: | ||
| + | |||
| + | [[Image:NormalisationFormula.png|center|400px]] | ||
| + | |||
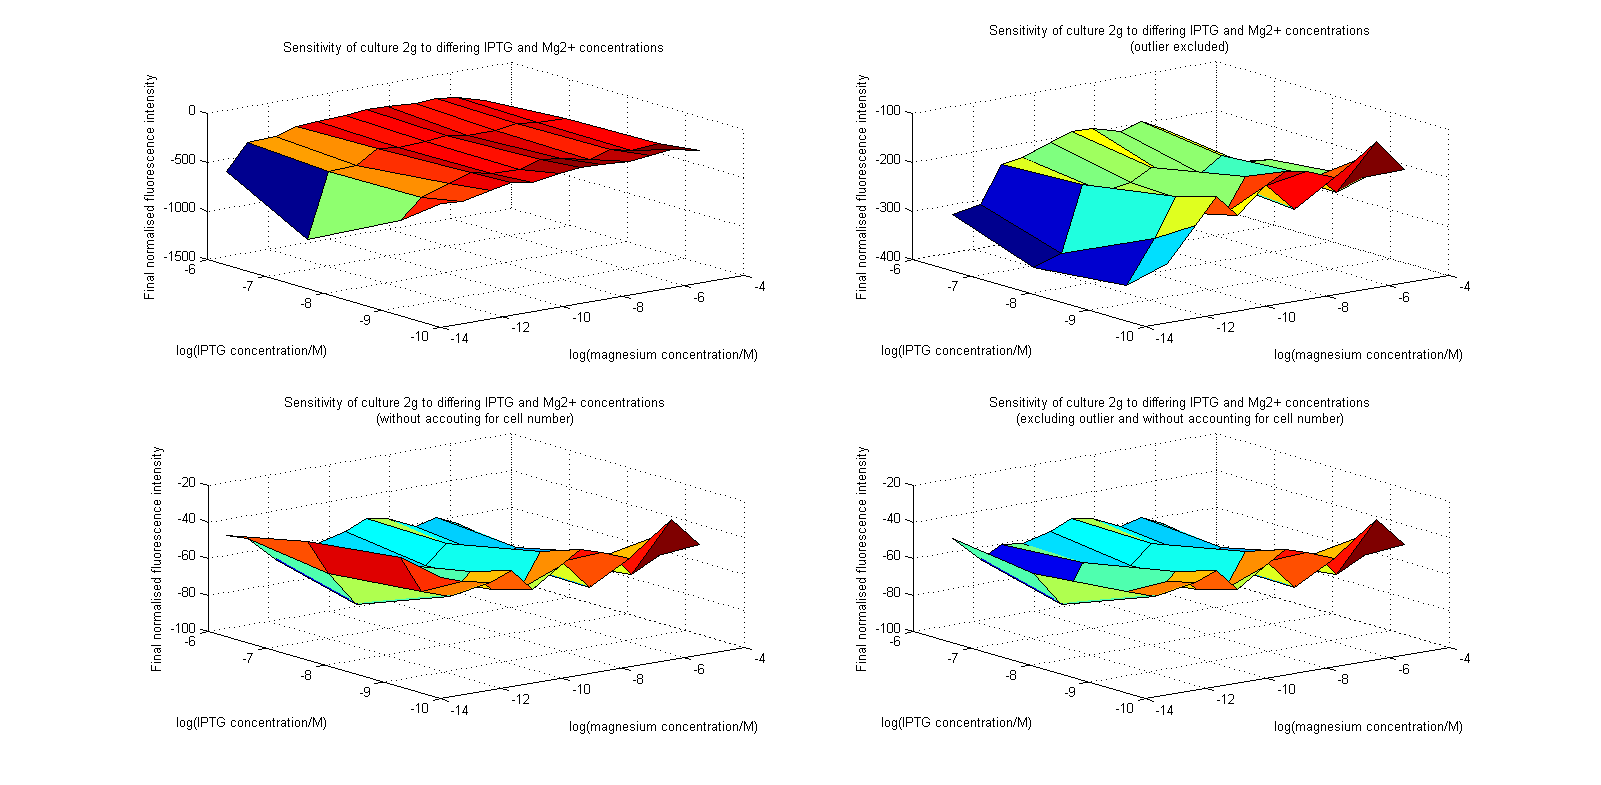
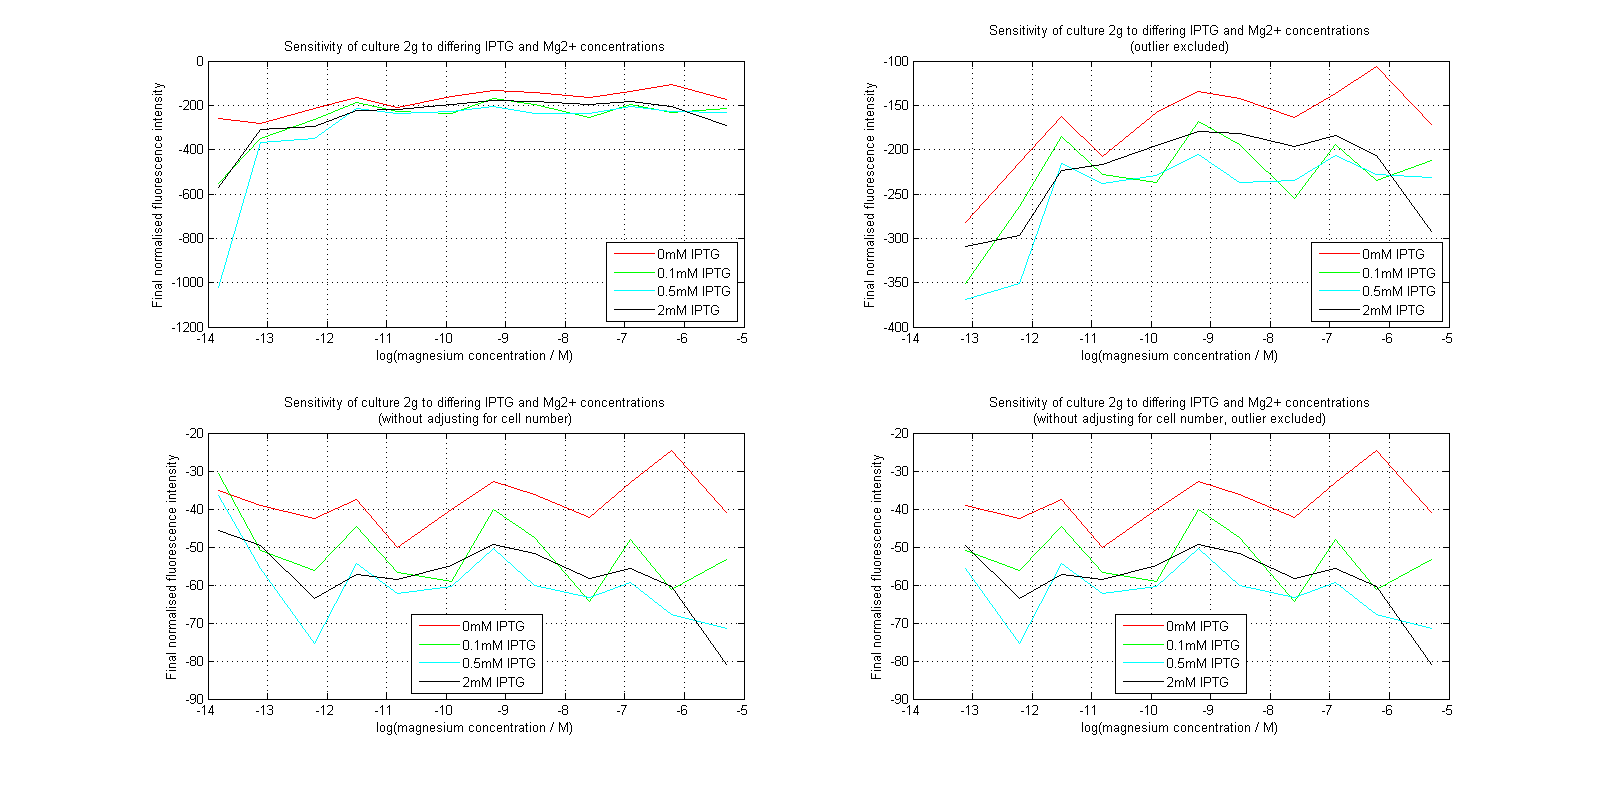
| + | Initial analysis produced fairly convincing data, as shown in the graphs below (top images). Certainly, the part appeared to produce a convincing response to magnesium between 1 μM and ~10μM, within the sensitivity range of the original paper. A more modest increase can be seen past this point. More careful analysis of the raw data indicated that this apparent trend may have been an artifact of the normalization formula, as no particularly convincing trend can be seen in the raw final fluorescence data (bottom images). | ||
| + | |||
| + | [[Image:MgSurfs.png|center|thumb|900px|Surface plots of our plate reader assay data. Top images have been normalized to cell population, while bottom images have not. Images on the right leave out the outlier at 1μM.]] | ||
| + | |||
| + | [[Image:MgLines.png|center|thumb|900px|Line graphs of our plate reader assay data. Top images have been normalized to cell population, while bottom images have not. Images on the right leave out the outlier at 1μM.]] | ||
| + | |||
| + | However, visual inspection under the fluorescence microscope demonstrated that the low magnesium cultures had very different fluorescent properties, both in quantity and quality of the light produced (higher magnesium cultures had a more yellow hue). We took this as a sign that our plate reader may not be producing reliable data, perhaps not surprising given that we were having to use non-optimal emission and excitation filters. Additionally, the final fluorescence was lower than the initial fluorescence despite the fact that visual inspection demonstrated that it increased considerably from start to finish. This just goes to show the dangers of normalizing data without looking at it first! It also shows the importance of an [[Team:Cambridge/Project/Standardised_Outputs|internal ratiometric control channel]] which is measured in the same way - this should eliminate the normalization artifacts that we have found from using OD620 as our normalization channel. If the plate reader was unable to measure one fluorescence channel, it is unlikely that it would be able to measure the second, eliminating the artifacts. | ||
| + | |||
| + | We then attempted to transform the construct into Bacillus subtilis, with a view to repeat the same assay in this new chassis. Because the part originally comes from bacillus, we hoped that this might give more useful data. Unfortunately, we did not have time to characterise the part in this chassis, as our transformation attempts failed. This may be an excellent starting point for any future teams seeking to explore this part. | ||
| + | |||
===References=== | ===References=== | ||
Revision as of 18:38, 26 September 2012


Magnesium riboswitch
Magnesium is essential for life, being a vital component of many enzymatic reactions. Of particular interest for synthetic biology is its role in the action of DNA polymerase enzymes such as Taq. and Phusion. However, no teams have really characterized a sensor that can be used to measure its concentration in solution. Such a biological sensor exists in the form of the bacillus Mg2+ riboswitch. We attempted to isolate this component and submit it as a biobrick, characterizing its function by inserting it into a derepressor construct.
The riboswitch acts as a transcriptional attenuator when Mg2+ is bound, causing disengagement of the RNA polymerase before it can access downstream ORFs. Consequently, these proteins are not expressed. The system that we used inserted this riboswitch just upstream of the LacI repressor in plasmid pJS130. The lac operator that LacI acted on was upstream of sfGFP, consequently we hope that expression of LacI will lead to repression of sfGFP.
To characterize this construct, we used a 96-well plate reader to assay the effects of the different concentrations of Mg2+ and IPTG on the levels of GFP. We expected the presence of either to allow the expression of sfGFP, however because transcriptional attenuation by the riboswitch occurs before expression of the repressor protein, it was expected that Mg2+ would somehow demonstrate a dominant effect.
We succeeded in creating this construct, and had its sequence verified independently. As can be seen, our initial assay did not give the expected results. At differing IPTG concentrations, the response to magnesium seems to have inverted.
We repeated this experiment, using a different range of magnesium concentrations (1μM - 5mM) and doing duplicates in alternate rows. The cells grew well, although they did not appear to do so in an exponential fashion. It is believed that this may be a feature of the minimal medium in which we were performing the assay, as failed tests using a rich defined medium (which, unfortunately, autofluoresced at GFP wavelengths due to the aromatic amino acids it contained) showed normal exponential growth with the same construct and at identical magnesium concentrations.
Having collected OD620 data as well as fluorescence data, we hoped to generate graphs containing fluorescence readings normalized to cell density. We used the following formula to normalize our data:
Initial analysis produced fairly convincing data, as shown in the graphs below (top images). Certainly, the part appeared to produce a convincing response to magnesium between 1 μM and ~10μM, within the sensitivity range of the original paper. A more modest increase can be seen past this point. More careful analysis of the raw data indicated that this apparent trend may have been an artifact of the normalization formula, as no particularly convincing trend can be seen in the raw final fluorescence data (bottom images).
However, visual inspection under the fluorescence microscope demonstrated that the low magnesium cultures had very different fluorescent properties, both in quantity and quality of the light produced (higher magnesium cultures had a more yellow hue). We took this as a sign that our plate reader may not be producing reliable data, perhaps not surprising given that we were having to use non-optimal emission and excitation filters. Additionally, the final fluorescence was lower than the initial fluorescence despite the fact that visual inspection demonstrated that it increased considerably from start to finish. This just goes to show the dangers of normalizing data without looking at it first! It also shows the importance of an internal ratiometric control channel which is measured in the same way - this should eliminate the normalization artifacts that we have found from using OD620 as our normalization channel. If the plate reader was unable to measure one fluorescence channel, it is unlikely that it would be able to measure the second, eliminating the artifacts.
We then attempted to transform the construct into Bacillus subtilis, with a view to repeat the same assay in this new chassis. Because the part originally comes from bacillus, we hoped that this might give more useful data. Unfortunately, we did not have time to characterise the part in this chassis, as our transformation attempts failed. This may be an excellent starting point for any future teams seeking to explore this part.
References
- Dann C., Wakeman C., Sieling C. Baker S. Irnov I. and Winkler W., Structure and Mechanism of a Metal-Sensing Regulatory RNA, Cell 130, 878–892,
 "
"


