Team:Amsterdam/modeling/odemodel
From 2012.igem.org
(Difference between revisions)
(→Model definition) |
|||
| Line 14: | Line 14: | ||
== Methylated bits over time == | == Methylated bits over time == | ||
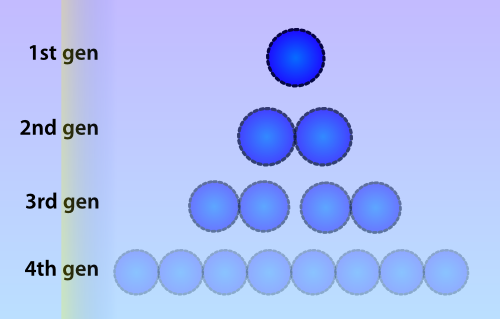
| - | Numerous | + | Numerous identical plasmids are often present in single cells and plasmids replicate independently of the bacterial chromosome (Scott 1984). A plasmid copy number (PCN) has been determined for all plasmids in the Parts Registry, which indicates a likely amount of copies of the plasmid to be present in each cell. Unlike eukaryotes, prokaryotes do not copy DNA methylation patterns to the newly synthesized strand during DNA replication. This will lead to a dilution of the amount of ‘written’-plasmids over time, mostly due to cell replication and the ensuing binomial division of the plasmids in the parent cell among the two daughter cells. |
[[File:Celldivision.png|thumb|300px|Due to cell division, the amount of methylated plasmids will be approximately halved during each divison cycle. In this picture a lower opacity indicates a lower amount of methylated plasmids]] | [[File:Celldivision.png|thumb|300px|Due to cell division, the amount of methylated plasmids will be approximately halved during each divison cycle. In this picture a lower opacity indicates a lower amount of methylated plasmids]] | ||
| Line 124: | Line 124: | ||
Integrating this differential equation, <math>P_{1}</math> will be given by: | Integrating this differential equation, <math>P_{1}</math> will be given by: | ||
| - | + | $$ | |
| + | P_{1}(t) = F(t) = e^{-\alpha t} | ||
| + | $$ | ||
Multiplying <math>F(t)</math> by the steady value <math>\frac{\beta}{\alpha}</math> will yield the amount of methylated plasmids at time <math>t</math>, given that there were <math>\frac{\beta}{\alpha}</math> methylated plasmids at <math>t = 0</math>. | Multiplying <math>F(t)</math> by the steady value <math>\frac{\beta}{\alpha}</math> will yield the amount of methylated plasmids at time <math>t</math>, given that there were <math>\frac{\beta}{\alpha}</math> methylated plasmids at <math>t = 0</math>. | ||
| - | + | $$ | |
| - | \label{math:Pt} | + | P_{1}(t) = \frac{\beta}{\alpha} e^{-\alpha t} |
| + | \label{math:Pt} | ||
| + | $$ | ||
By solving the previous equation, we can calculate the time <math>t</math> that has passed after <math>s_{\text{off}}</math> from <math>F(t)</math>: | By solving the previous equation, we can calculate the time <math>t</math> that has passed after <math>s_{\text{off}}</math> from <math>F(t)</math>: | ||
| - | + | $$ | |
| + | t = \frac{\ln(F(t))}{-\alpha} | ||
| + | $$ | ||
== In practice == | == In practice == | ||
| - | |||
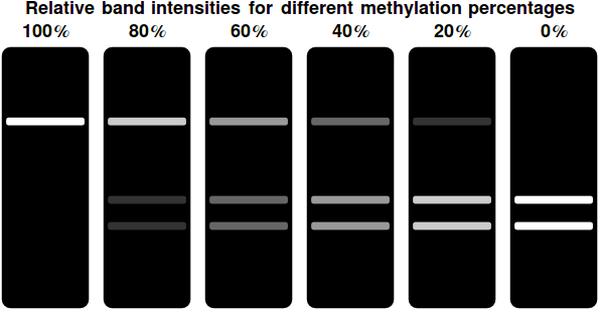
[[File:bands.jpeg|center|thumb|500px|Gel representations for a range of different <math>F(t)</math> values. Complete methylation of all bits results in a single, bright band at the top of the gel. This indicates the undigested, linearized plasmid. Decreasing the amount of methylated bits shifts the intensity of the top band away to the two bottom bands. These indicate the linearized & successfully digested plasmid]] | [[File:bands.jpeg|center|thumb|500px|Gel representations for a range of different <math>F(t)</math> values. Complete methylation of all bits results in a single, bright band at the top of the gel. This indicates the undigested, linearized plasmid. Decreasing the amount of methylated bits shifts the intensity of the top band away to the two bottom bands. These indicate the linearized & successfully digested plasmid]] | ||
Revision as of 12:46, 23 September 2012
 "
"


