Team:Buenos Aires/Results/SynEcoTesting
From 2012.igem.org
(→Results) |
(→Results) |
||
| (One intermediate revision not shown) | |||
| Line 88: | Line 88: | ||
==== Results ==== | ==== Results ==== | ||
| - | [[File: | + | [[File:BsAs2012coculture3.jpg | 800px]] |
Latest revision as of 03:53, 27 October 2012

Contents |
SynEco Testing
Coculture of transformed strains
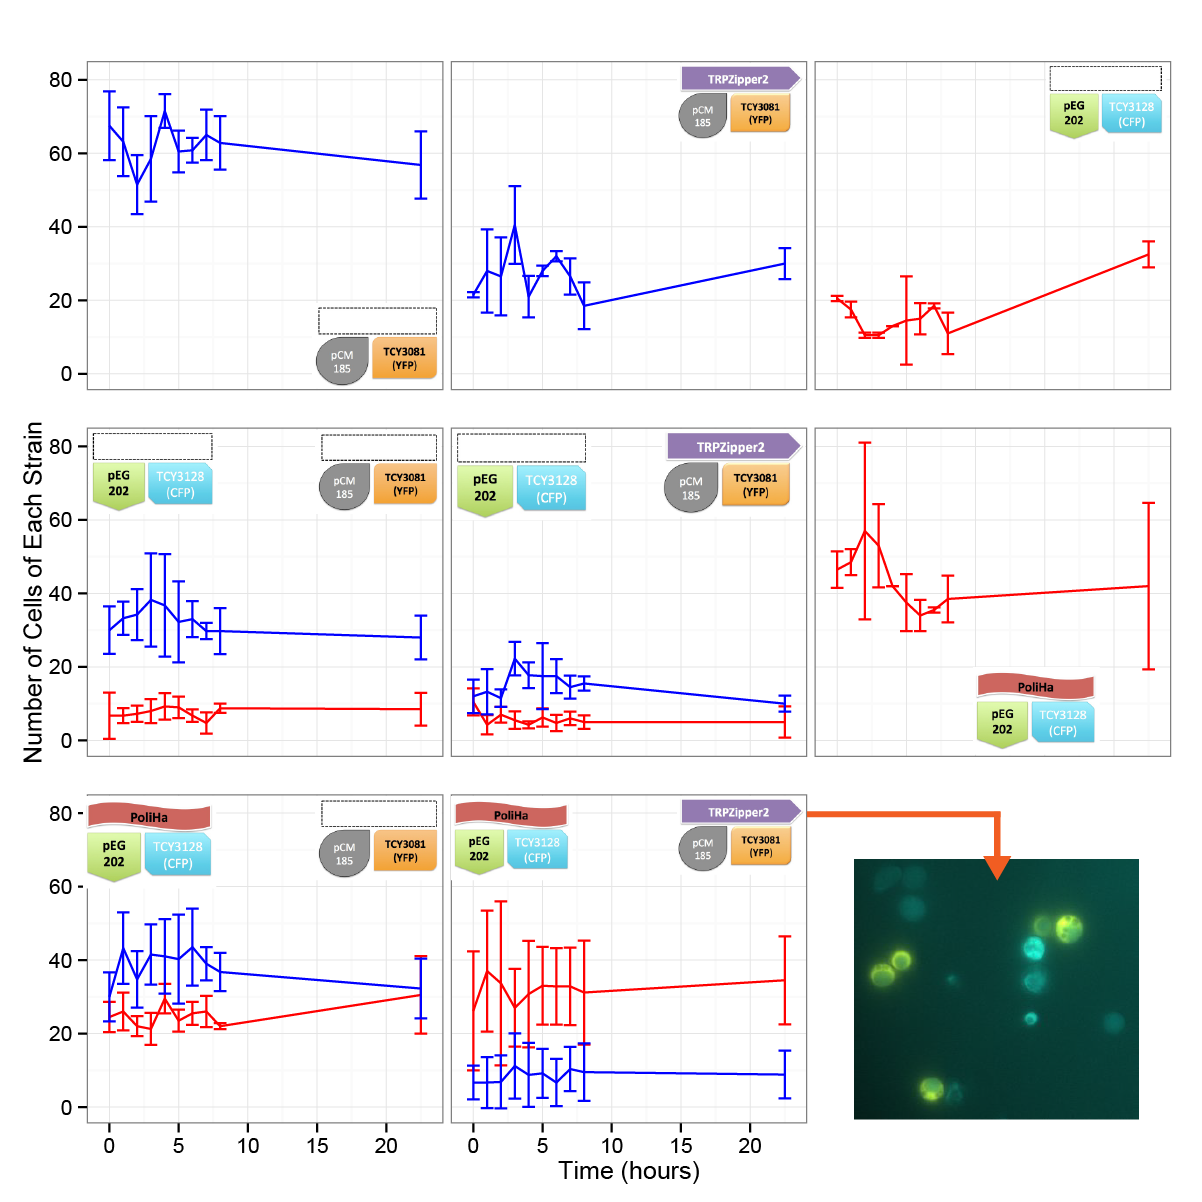
We did the first assay to test whether our system works and how two transformed strains grow together.
|
Protocol
|
|
|
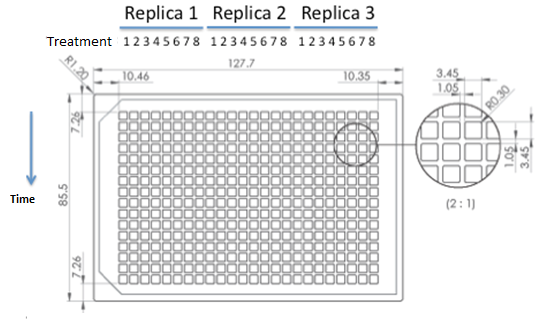
| 384 wells plate to be used for epifluorescence microscope. |
Results
In the time framed we worked with, we werent able to see significant differences in the cell density. We are aware, based on our model predictions that there could be a lag time of days (1-3). This is also consistent with the results obtained in other experiments. We will repeat this test in a longer time period.
Coculture in liquid medium
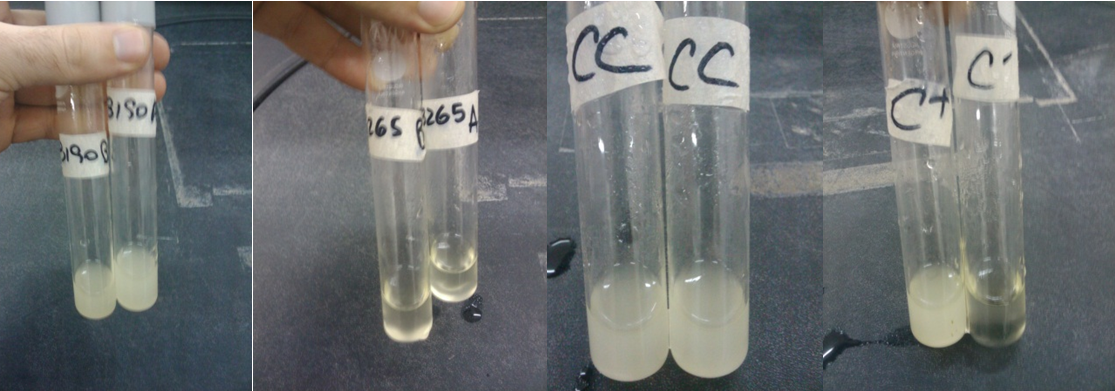
We used for these experiment TCY3190(H+T-) and TCY3265(H-T+) Positive control: TCY3154 (H+T+) and negative control TCY3043(H-T-)
At different initial OD and proportions
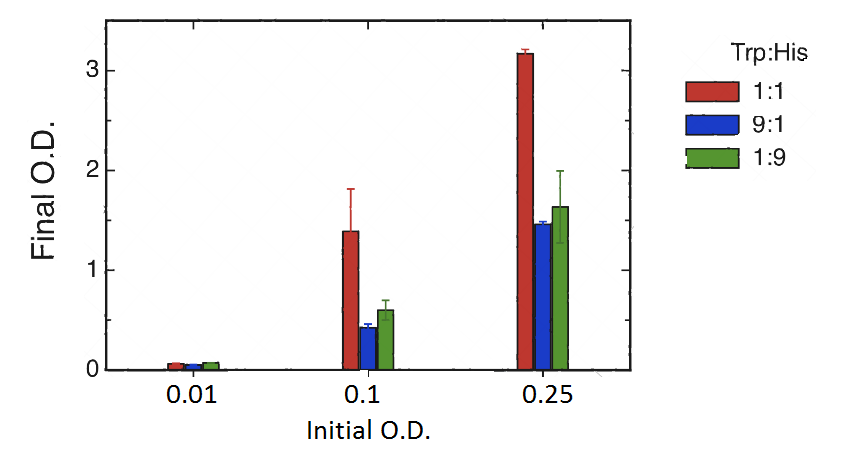
Cultures were set at different initial concentrations (0.25, 0.1 and 0.01) and proportions (1:1; 1:9; 9:1). After 24 hs, we measured OD with the use of a spectrophotometer (two replicas) and we calculated the mean OD and a Growth factor (as Mean OD en time 1 over Initial OD time 0).
| Coculture Proportion (H+T-):(H-T+) | Initial OD(t=0) | OD1 (t=1) | OD2 (t=1) | dilution used for measure t=1 | Mean OD | Growth Factor |
|---|---|---|---|---|---|---|
| 01:01 | 0,25 | 0,32 | 0,314 | 10 | 3,17 | 12,68 |
| 09:01 | 0,25 | 0,148 | 0,144 | 10 | 1,46 | 5,84 |
| 01:09 | 0,25 | 0,138 | 0,189 | 10 | 1,635 | 6,54 |
| 01:01 | 0,1 | 0,109 | 0,169 | 10 | 1,39 | 13,9 |
| 09:01 | 0,1 | 0,04 | 0,045 | 10 | 0,425 | 4,25 |
| 01:09 | 0,1 | 0,067 | 0,053 | 10 | 0,6 | 6 |
| 01:01 | 0,01 | 0,067 | 0,061 | 1 | 0,064 | 6,4 |
| 09:01 | 0,01 | 0,056 | 0,05 | 1 | 0,053 | 5,3 |
| 01:09 | 0,01 | 0,074 | 0,073 | 1 | 0,0735 | 7,35 |
|
As shown in graph and table there is a basal growth that does not depend on the initial OD or strain proportion, of a growth factor of 6 approximately.
However we observed a much higher growth at the proportion 1:1 when the initial OD 0.25 and 0.1. Therefore we can assume that at these proportions there is a natural cooperation between the strains and that should be the level of growth that we would like to assess through our bioengineering. Besides we would like to be able in the future to tune the strains in order to be able to obtain in the proportions 9:1 and 1:9 similar results to those obtained in the 1:1, at our own will.
At the same initial OD: 0.2, followed over time
We set the same cultures and cocultures as in point i), but starting all of them at the same OD: 0.2 and we followed them over 2 days. At day 1 we took pictures of them and at day 2 we measured the final OD.
Coculture in Agar and Revertant mutation control
Through this experiment we aim to quantify the rate of revertants of each strain, and to asses if cross-feeding between a lawn of cells of one strain and colonies from and other strain is posible.
We used petri dishes with agar medium with (+) and without (-) Trp and His as shown in the following table.
We started a culture of each strain in synthetic complete medium, measured its OD 24 hs after the culture initiated, replaced the synthetic complete medium for one lacking both H and T (to avoid residual growth) and plated ~10^6 cells (lawn) or ~10^2 cells (seed) as shown by the following table (we considered OD600=1 represents 3*10^7 cells). At the same time, 3 controls (one for each strain) were carried in YPD complete medium to check the viability of each strain separately, and to estimate the seed CFU (colony formin units) more precisely.
| Medium H | Medium T | Lawn (10^6 cells) | Seed (10^2 cells) | Description of experiment | Results after 3 days - Replica 1 | Results after 3 days - Replica 2 |
|---|---|---|---|---|---|---|
| (-) | (+) | (-) | Strain –H+T | Control of His revertants | 7 | 7 |
| (+) | (-) | (-) | Strain +H-T | Control of Trp revertants | 2 | 7 |
| (-) | (-) | Strain +H-T | Strain –H+T | Coculture; we expect to see natural cooperation | 960 | 800 |
| (-) | (-) | Strain –H+T | Strain +H-T | Coculture; we expect to see natural cooperation | 500 | 712 |
| (-) | (-) | (-) | Strain +H+T | Viability of yeasts in medium | 171 | (-) |
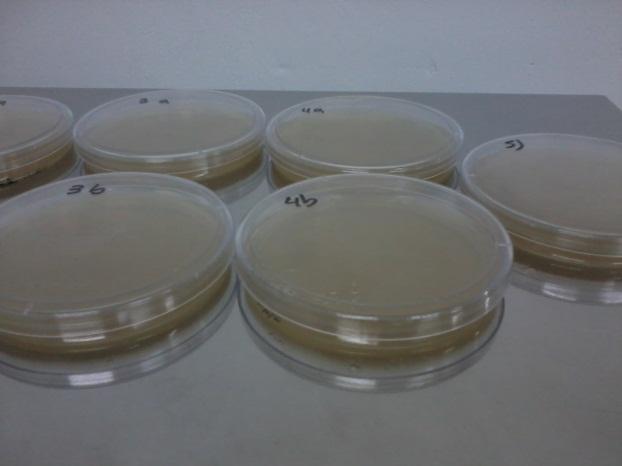
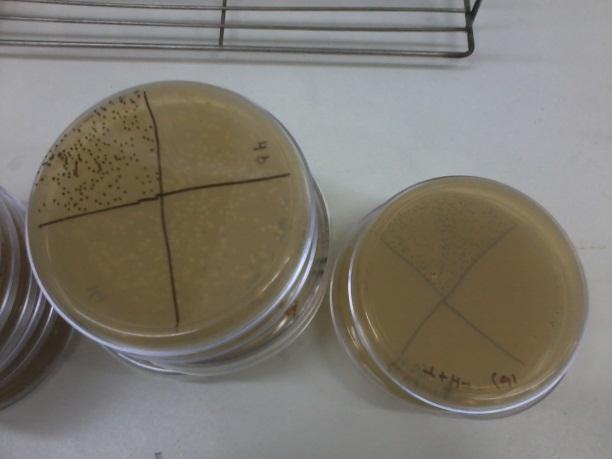
Table: Shows description of each plate content and results in number of colonies counted by plate at day 3. YPD control results plates are not shown in the table.
| 
|
| Petri Dishes | With marks of the counting of colonies |
Results
The viability of the strains was high as expected, as well as the viability of a control positive strain in the –H-T medium. As shown in the table, we have a low, but existent, number of revertants from both his and trp auxotrophy strains. This number should be taken into account when interpreting the results from coculture growth after several days, given that the rate of revertants in liquid medium is probably the same.
Growth in coculture was puzzling, as it resulted in more colonies than the expected. If cooperation was effective, we expected to see as many colonies as "seed" cells, not more. Revertion of cells from the "lawn" doesn't explain the number of colonies either. Probably a combination of both these effects are taking place.
 "
"
