Team:ZJU-China/model s2 3.htm
From 2012.igem.org
| (2 intermediate revisions not shown) | |||
| Line 109: | Line 109: | ||
padding: 5px 20px; | padding: 5px 20px; | ||
} | } | ||
| + | table.tm,td.tm | ||
| + | { | ||
| + | background-color: transparent; | ||
| + | border:0px; | ||
| + | font-size:15px; | ||
| + | border-collapse:collapse; | ||
| + | padding: 0px; | ||
| + | } | ||
| + | |||
h3 | h3 | ||
{ | { | ||
| Line 273: | Line 282: | ||
</table> | </table> | ||
<p align="justify"> </p> | <p align="justify"> </p> | ||
| - | < | + | <table class="tm" align="center"> |
| - | <p class="fig" align="justify"><b>Fig 4.</b> Result of scaffold system for large scale simulation. After 1200 iterations, there are 436 B and 147 C.</ | + | <tr> |
| - | + | <td class="tm"><img src="https://static.igem.org/mediawiki/2012/3/3a/Scaffold.gif" width="350px" /></td> | |
| - | + | <td class="tm"><img src="https://static.igem.org/mediawiki/2012/a/ab/Nonscaffold.gif" width="350px" /></td> | |
| + | </tr> | ||
| + | </table> | ||
| + | <p class="fig" align="justify"><b>Fig 4.(Left)</b> Result of scaffold system for large scale simulation. After 1200 iterations, there are 436 B and 147 C.<br/> | ||
| + | <b>Fig 5.(Right)</b> Result of non-scaffold system for large scale simulation. After 1200 iterations, there are 451 B and 79 C.</p> | ||
<p align="justify"> </p> | <p align="justify"> </p> | ||
<h2>Comparison between the two system</h2> | <h2>Comparison between the two system</h2> | ||
<p align="justify">As the iteration increasing, the number of A is decreasing and the number of B and C are increasing. We record the number of B and C for both scaffold system and non-scaffold system as iteration grows to watch the reaction rate of pathway (i.e. the number of C).</p> | <p align="justify">As the iteration increasing, the number of A is decreasing and the number of B and C are increasing. We record the number of B and C for both scaffold system and non-scaffold system as iteration grows to watch the reaction rate of pathway (i.e. the number of C).</p> | ||
<div class="floatC"><img src="http://www.jiajunlu.com/igem/zju_model2_6.jpg" width="400px"> | <div class="floatC"><img src="http://www.jiajunlu.com/igem/zju_model2_6.jpg" width="400px"> | ||
| - | <p class="fig | + | <p class="fig"><b>Fig 6.</b> The number of B and C as iteration grows.</p> |
| - | + | </div> | |
| - | + | ||
| + | <p align="justify">From figure 4.5.6, it is obvious that the number of C for scaffold system is more than that for non-scaffold system and the number of B for scaffold system is less than that for non-scaffold system. This phenomenon can be interpreted as that the probability that B meets an E2 is highly increased since their distance is closer. Therefore, it is safely to draw a conclusion that the reaction rate of pathway has been speed up because of the scaffold bringing two enzymes closer.</p> | ||
| + | <br/> | ||
</body></html> | </body></html> | ||
Latest revision as of 19:58, 26 October 2012
A large scale simulation
The initial state is as following:
Edge of cube: 50 units
The amount of A: 2000
The amount of B: 0
The amount of C: 0
The amount of E1: 50
The amount of E2: 50
The distance between E1 and E2 for RNA scaffold: 2 units
After 1200 iterations, the scaffold and non-scaffold results are as following:
| Scaffold | Non-scaffold | |
|---|---|---|
| A (Substrate) | 1417 | 1470 |
| B (Intermediate) | 436 | 451 |
| C (Product) | 147 | 79 |
| E1 (Enzyme1) | 50 | 50 |
| E2 (Enzyme2) | 50 | 50 |
 |
 |
Fig 4.(Left) Result of scaffold system for large scale simulation. After 1200 iterations, there are 436 B and 147 C.
Fig 5.(Right) Result of non-scaffold system for large scale simulation. After 1200 iterations, there are 451 B and 79 C.
Comparison between the two system
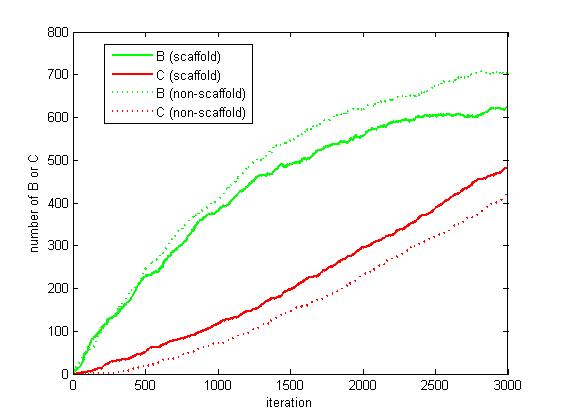
As the iteration increasing, the number of A is decreasing and the number of B and C are increasing. We record the number of B and C for both scaffold system and non-scaffold system as iteration grows to watch the reaction rate of pathway (i.e. the number of C).

Fig 6. The number of B and C as iteration grows.
From figure 4.5.6, it is obvious that the number of C for scaffold system is more than that for non-scaffold system and the number of B for scaffold system is less than that for non-scaffold system. This phenomenon can be interpreted as that the probability that B meets an E2 is highly increased since their distance is closer. Therefore, it is safely to draw a conclusion that the reaction rate of pathway has been speed up because of the scaffold bringing two enzymes closer.
 "
"