Team:University College London/Module 4/Modelling
From 2012.igem.org
(→Modelling) |
(→Aims) |
||
| (16 intermediate revisions not shown) | |||
| Line 6: | Line 6: | ||
== Modelling == | == Modelling == | ||
We have two separate models for buoyancy, namely a Simbiology Model and a MATLab Mathematical Model. | We have two separate models for buoyancy, namely a Simbiology Model and a MATLab Mathematical Model. | ||
| - | + | ||
| + | == Aims == | ||
| + | For the simbiology model was to investigate if the addition of T7 RNA Polymerase as well as T7 promoter woud increase the expression levels for the GFP. The aim for the mathematical model is to predict the number of ''E.coli'' cells required to maintain buoyancy in a mass of aggregated plastics. | ||
'''Simbiology Model''' | '''Simbiology Model''' | ||
| - | [[File:buoynet1.png]] | + | [[File:buoynet1.png|center]] |
The block diagram shows the module where GFP expression is control by cstA promoter; the expression is triggered under low glucose concentrations. | The block diagram shows the module where GFP expression is control by cstA promoter; the expression is triggered under low glucose concentrations. | ||
| - | [[File:buoynet2.png]] | + | [[File:buoynet2.png|center]] |
In the models the environmental sensitive promoters (cstA) is activated by carbon starvation stress, then the mRNA encoding T7 RNA polymerase is transcribed, whose protein binds the T7 promoter driving the expression of the the reporter output (GFP). | In the models the environmental sensitive promoters (cstA) is activated by carbon starvation stress, then the mRNA encoding T7 RNA polymerase is transcribed, whose protein binds the T7 promoter driving the expression of the the reporter output (GFP). | ||
| Line 20: | Line 22: | ||
| - | [[File:buoygraph1.png]] | + | [[File:buoygraph1.png|center]] |
| Line 26: | Line 28: | ||
| - | [[File:buoygraph2.png]] | + | [[File:buoygraph2.png|center]] |
The green line represents GFP expression levels and the blue line shows the T7 RNAP concentration over time. GFP production is considerably higher than in the previous model. | The green line represents GFP expression levels and the blue line shows the T7 RNAP concentration over time. GFP production is considerably higher than in the previous model. | ||
| - | Conclusion and influence to our experimental work | + | Conclusion and influence to our experimental work: |
| - | From the results obtained above | + | From the results obtained above our model suggests that there was a 10 fold increase in GFP expression when the T7 RNA Polymerase as well as T7 promoter are added to the original construct (which was cstA + GFP). |
We expect that our experimental data fill follow this. | We expect that our experimental data fill follow this. | ||
| Line 38: | Line 40: | ||
'''Mathematical Model''' | '''Mathematical Model''' | ||
| - | Given a fixed ratio of volume of gas produced to total | + | Given a fixed ratio of volume of gas produced to total ''E.coli'' volume, this model calculates the number of ''E.coli'' cells required to keep a certain mass of aggregated microplastic buoyant. The model also compares how the number of cells is affected by varying densities of microplastics, and allows the user to investigate how the results will change in different sea water densities. Sea water density, under influence of temperature, salinity and pressure, can be calculated using a third party [http://www.csgnetwork.com/water_density_calculator.html calculator by CSG Network]. |
Taking sea water density to be at 1020kg/m3, and volume ratio of gas produced in e.coli to be 0.5, the model produces the following graph. | Taking sea water density to be at 1020kg/m3, and volume ratio of gas produced in e.coli to be 0.5, the model produces the following graph. | ||
| - | [[File:buoyancy2.jpg]] | + | [[File:buoyancy2.jpg|center]] |
Results confirm the general trend that a higher number of cells is required to keep buoyant a higher mass of aggregated plastic. Plastics with higher densities also require more cells to be kept buoyant as opposed to lower density plastics of the same mass. Though conclusions drawn from the model seem simplistic, they confirm that the model makes sense in the real-world context. | Results confirm the general trend that a higher number of cells is required to keep buoyant a higher mass of aggregated plastic. Plastics with higher densities also require more cells to be kept buoyant as opposed to lower density plastics of the same mass. Though conclusions drawn from the model seem simplistic, they confirm that the model makes sense in the real-world context. | ||
| - | The MATLab script file can be downloaded here: [[Media: | + | The MATLab script file can be downloaded here: [[Media:buoyancy31.m]] |
| - | The mathematical model was written based on | + | The mathematical model was written based on Archimedes' Principle that at the point of buoyancy: |
'''Mass of e.coli + aggregated plastic + gas produced = Mass of total sea water displaced''' | '''Mass of e.coli + aggregated plastic + gas produced = Mass of total sea water displaced''' | ||
| Line 54: | Line 56: | ||
From that, we get the corresponding equations: | From that, we get the corresponding equations: | ||
| - | [[File:capture1.jpg]] | + | [[File:capture1.jpg|center]] |
| + | |||
| + | Where | ||
| + | |||
| + | [[File:unknowns.jpg|center]] | ||
| + | |||
| + | Using the following substitutions, | ||
| + | |||
| + | [[File:Capture2.jpg|center]] | ||
| + | |||
| + | The first equation can be rewritten as: | ||
| + | |||
| + | [[File:Capture4.jpg|center]] | ||
| + | |||
| + | The equation was written into a MATLab script and can be used to find the relationship between the number of cells required to keep a certain mass of aggregated plastic buoyant. | ||
| + | |||
| + | Assumptions we've made while putting the equation into MATLab: | ||
| + | |||
| + | 1. density of plastic has to be higher than density of cells | ||
| + | |||
| + | 2. density of ''E.coli'' is 10000/7 kg/m3 | ||
| + | |||
| + | 3. density of gas produced is 1.2 kg/m3 | ||
| + | |||
| + | 4. mass of single ''E.coli'' cell is 1*10^-15kg | ||
| - | + | ||
| + | The model leads into experimental work by informing us how the number of cells that would be required to make our buoyancy module effective. So for example, according to the model, for 5kg of plastics of density 1030kg/m3, the number of ''E.coli'' cells needed would be 1*10^14. | ||
{{:Team:University_College_London/templates/foot}} | {{:Team:University_College_London/templates/foot}} | ||
Latest revision as of 01:25, 27 September 2012
Module 4: Buoyancy
Description | Design | Construction | Characterisation | Modelling | Results | Conclusions
Modelling
We have two separate models for buoyancy, namely a Simbiology Model and a MATLab Mathematical Model.
Aims
For the simbiology model was to investigate if the addition of T7 RNA Polymerase as well as T7 promoter woud increase the expression levels for the GFP. The aim for the mathematical model is to predict the number of E.coli cells required to maintain buoyancy in a mass of aggregated plastics.
Simbiology Model
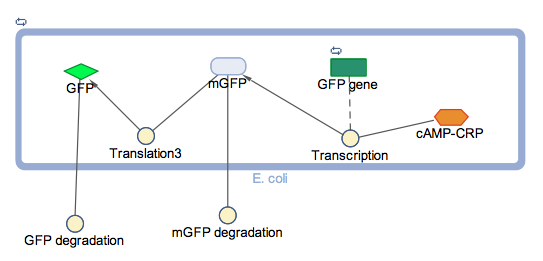
The block diagram shows the module where GFP expression is control by cstA promoter; the expression is triggered under low glucose concentrations.
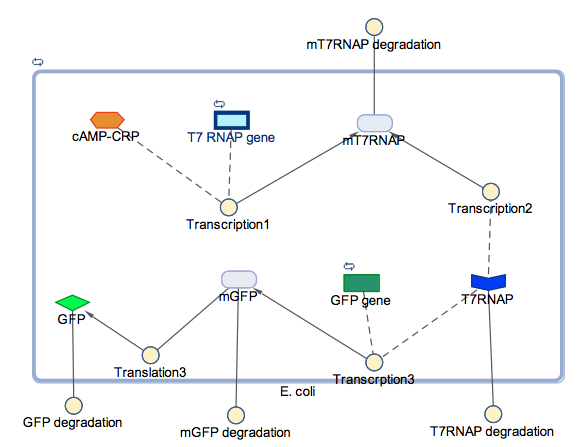
In the models the environmental sensitive promoters (cstA) is activated by carbon starvation stress, then the mRNA encoding T7 RNA polymerase is transcribed, whose protein binds the T7 promoter driving the expression of the the reporter output (GFP).
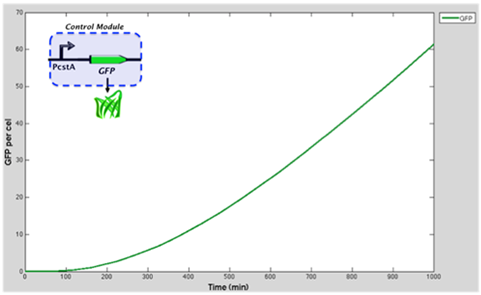
Graph represents the GFP accummulation through time when is controlled by cstA promoter
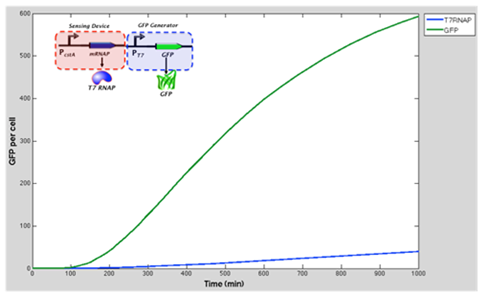
The green line represents GFP expression levels and the blue line shows the T7 RNAP concentration over time. GFP production is considerably higher than in the previous model.
Conclusion and influence to our experimental work: From the results obtained above our model suggests that there was a 10 fold increase in GFP expression when the T7 RNA Polymerase as well as T7 promoter are added to the original construct (which was cstA + GFP). We expect that our experimental data fill follow this.
Mathematical Model
Given a fixed ratio of volume of gas produced to total E.coli volume, this model calculates the number of E.coli cells required to keep a certain mass of aggregated microplastic buoyant. The model also compares how the number of cells is affected by varying densities of microplastics, and allows the user to investigate how the results will change in different sea water densities. Sea water density, under influence of temperature, salinity and pressure, can be calculated using a third party [http://www.csgnetwork.com/water_density_calculator.html calculator by CSG Network].
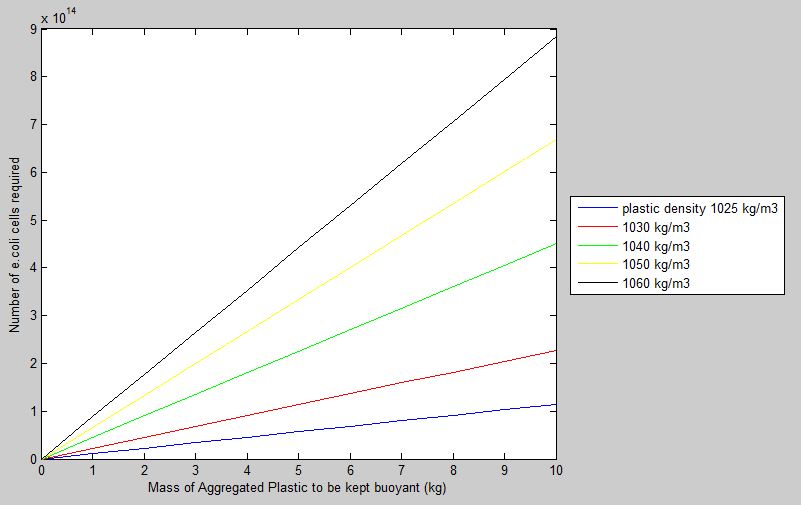
Taking sea water density to be at 1020kg/m3, and volume ratio of gas produced in e.coli to be 0.5, the model produces the following graph.
Results confirm the general trend that a higher number of cells is required to keep buoyant a higher mass of aggregated plastic. Plastics with higher densities also require more cells to be kept buoyant as opposed to lower density plastics of the same mass. Though conclusions drawn from the model seem simplistic, they confirm that the model makes sense in the real-world context.
The MATLab script file can be downloaded here: Media:buoyancy31.m
The mathematical model was written based on Archimedes' Principle that at the point of buoyancy:
Mass of e.coli + aggregated plastic + gas produced = Mass of total sea water displaced
From that, we get the corresponding equations:
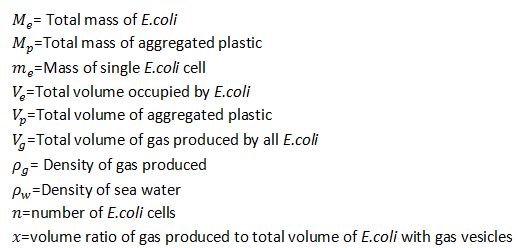
Where
Using the following substitutions,
The first equation can be rewritten as:
The equation was written into a MATLab script and can be used to find the relationship between the number of cells required to keep a certain mass of aggregated plastic buoyant.
Assumptions we've made while putting the equation into MATLab:
1. density of plastic has to be higher than density of cells
2. density of E.coli is 10000/7 kg/m3
3. density of gas produced is 1.2 kg/m3
4. mass of single E.coli cell is 1*10^-15kg
The model leads into experimental work by informing us how the number of cells that would be required to make our buoyancy module effective. So for example, according to the model, for 5kg of plastics of density 1030kg/m3, the number of E.coli cells needed would be 1*10^14.
 "
"
