Team:Chalmers-Gothenburg/Results
From 2012.igem.org
(→References) |
m |
||
| (17 intermediate revisions not shown) | |||
| Line 56: | Line 56: | ||
</html> | </html> | ||
<div align="justify" style="width:auto; margin-left:0px; margin-right:300px;"> | <div align="justify" style="width:auto; margin-left:0px; margin-right:300px;"> | ||
| + | __NOEDITSECTION__ | ||
='''Results Summary'''= | ='''Results Summary'''= | ||
Spot test analysis and growth measurements of yeast in urine were performed in order to test the survival of yeast cells in urinary medium. These initial experiments showed that yeast cells are able to survive in urinary medium which is an important prerequisite for the biosensor. | Spot test analysis and growth measurements of yeast in urine were performed in order to test the survival of yeast cells in urinary medium. These initial experiments showed that yeast cells are able to survive in urinary medium which is an important prerequisite for the biosensor. | ||
| Line 65: | Line 66: | ||
The Indigo group managed to obtain different colour changes in different growth media by introducing a plasmid containing the genes tnaA and fmo (pIndigo). For instance, blue bubbles could be seen in one medium and other media turned into different shades of brown. These changes of colour were strictly dependent on the presence of pIndigo and could not be detected in any of the cultures with the strain containing the control plasmid. This indicates an at least partial activity of the pathway. However, we did not manage to confirm the presence of bio-indigo and to determine exactly which compound or reaction that was responsible for the colourful bubbles or colour changes. | The Indigo group managed to obtain different colour changes in different growth media by introducing a plasmid containing the genes tnaA and fmo (pIndigo). For instance, blue bubbles could be seen in one medium and other media turned into different shades of brown. These changes of colour were strictly dependent on the presence of pIndigo and could not be detected in any of the cultures with the strain containing the control plasmid. This indicates an at least partial activity of the pathway. However, we did not manage to confirm the presence of bio-indigo and to determine exactly which compound or reaction that was responsible for the colourful bubbles or colour changes. | ||
| - | [IMFD-73 Δ''cwp2''::kanMX] was successfully transformed with both receptor genes and genes required for bio-indigo production. However, the system was never functional as a pregnancy test kit since it did not give any significant response in the presence of hCG. More detailed analysis | + | [IMFD-73 Δ''cwp2''::kanMX] was successfully transformed with both receptor genes and genes required for bio-indigo production. However, the system was never functional as a pregnancy test kit since it did not give any significant response in the presence of hCG. More detailed analysis of the results are shown in the section below and the discussion can be found [https://2012.igem.org/Team:Chalmers-Gothenburg/Discussion here]. |
='''Survival of yeast in urine'''= | ='''Survival of yeast in urine'''= | ||
| Line 97: | Line 98: | ||
='''Introduction of genes for indigo-synthesizing enzymes'''= | ='''Introduction of genes for indigo-synthesizing enzymes'''= | ||
| - | + | Another big tasks in this project was the introducing of two enzymes needed for indigo synthesizes in yeast. In the following sections the construction of the plasmid for indigo production and the testing of the same will be presented. | |
=='''Construction of pIndigo'''== | =='''Construction of pIndigo'''== | ||
| Line 103: | Line 104: | ||
Digested ''tnaA'' was ligated with pIYC04-fmo, and digested ''fmo'' was ligated with pIYC04-tnaA and the plasmids were now called pIndigo. The reason that pIndigo was constructed in both ways was in order to increase the chances of getting a functional plasmid. DH5α were transformed with pIndigo. The amplification was successful and pIndigo was purified. pIndigo now contained ''tnaA'' under control of the constitutive ''PGK1'' promoter and ''fmo'' under the control of the constitutive ''TEF1'' promoter. The plasmid was verified by sequencing (data not shown). Sequencing showed that the plasmid contained both ''tnaA'' and ''fmo'' and there were no signs of mutations. | Digested ''tnaA'' was ligated with pIYC04-fmo, and digested ''fmo'' was ligated with pIYC04-tnaA and the plasmids were now called pIndigo. The reason that pIndigo was constructed in both ways was in order to increase the chances of getting a functional plasmid. DH5α were transformed with pIndigo. The amplification was successful and pIndigo was purified. pIndigo now contained ''tnaA'' under control of the constitutive ''PGK1'' promoter and ''fmo'' under the control of the constitutive ''TEF1'' promoter. The plasmid was verified by sequencing (data not shown). Sequencing showed that the plasmid contained both ''tnaA'' and ''fmo'' and there were no signs of mutations. | ||
| - | The yeast strain CEN.PK 113-11C was transformed with pIndigo and the presence of the plasmid should theoretically enable the cells to produce indigo, but no blue cells were seen on the plates. To see if the ''tnaA'' and the ''fmo'' gene had been correctly introduced into the cells, a colony-PCR with a following gel electrophoresis was performed for the genes. The expected bands were approximately 1400 bp for both genes. As one can see on the gel picture in Figure | + | The yeast strain CEN.PK 113-11C was transformed with pIndigo and the presence of the plasmid should theoretically enable the cells to produce indigo, but no blue cells were seen on the plates. To see if the ''tnaA'' and the ''fmo'' gene had been correctly introduced into the cells, a colony-PCR with a following gel electrophoresis was performed for the genes. The expected bands were approximately 1400 bp for both genes. As one can see on the gel picture in Figure 8, bands with right lengths were present for both genes. |
| - | [[File: | + | [[File:Gelpic.jpg|thumb|center|500px|Figure 8: Verification of transformation of CEN.PK 113-11C with pIndigo through gel electrophoresis. For both tnaA and fmo was one band expected to be seen with a length of approximately 1400 bp. As one can see on gel picture, bands with right lengths were present for both genes.]] |
After the CEN PK 113-11C had been transformed with the pIndigo the cells were transferred to SD His- plates along with two controls consisting of CEN PK 113-11C without the plasmid and CEN PK 113-11C with empty plasmid. The control cells that lacked the plasmid were not able to grow on the plates, while the transformed ones did, so the transformation was considered to be successful. After more than one week of cultivation in room temperature and 30 ºC no blue cells were detected. After some time the cells were also transferred to fresh SD His- plates, and further cultivated, but this did not give blue cells on the plate. The strains were also cultivated in SD His- media in room temperature, but no blue colour was obtained. | After the CEN PK 113-11C had been transformed with the pIndigo the cells were transferred to SD His- plates along with two controls consisting of CEN PK 113-11C without the plasmid and CEN PK 113-11C with empty plasmid. The control cells that lacked the plasmid were not able to grow on the plates, while the transformed ones did, so the transformation was considered to be successful. After more than one week of cultivation in room temperature and 30 ºC no blue cells were detected. After some time the cells were also transferred to fresh SD His- plates, and further cultivated, but this did not give blue cells on the plate. The strains were also cultivated in SD His- media in room temperature, but no blue colour was obtained. | ||
| Line 121: | Line 122: | ||
==='''Day1'''=== | ==='''Day1'''=== | ||
| - | During day 1 no major changes in colour were observed for the samples (see Figure | + | During day 1 no major changes in colour were observed for the samples (see Figure 9 and 10). All cultivations had a foggy yellow colour. The samples with added L-tryptophan had initially a slight darker shade of yellow. |
| - | [[File: | + | [[File:Galactose_day1.jpg|thumb|center|500px|Figure 9: . Cultivations in galactose media day 1, all cultivations were made with the strain CEN PK 113-11C . The order of the cultivations is, from left to right; pIndigo, pIYC04, pIndigo with 5 ml L-tryptophan 20 g/l added to medium, pIYC04 with 5 ml L-tryptophan 20 g/l added to medium, pIndigo with 5 ml L-tryptophan 20 g/l added after 24 hours of cultivation, pIYC04 with 5 ml L-tryptophan 20 g/l added after 24 hours of cultivation, pIndigo with 5 ml indole 2 g/l added to medium, pIYC04 with 5 ml indole 2 g/l added to medium, pIndigo with 2 drops of indole 2 g/l added after 24 hours of cultivation and pIYC04 with 2 drops of indole 2 g/l added after 24 hours of cultivation.]] |
| - | [[File: | + | [[File:Glucose_day1.jpg|thumb|center|500px|Figure 10: . Cultivations in glucose media day 1, all cultivations were made with the strain CEN PK 113-11C . The order of the cultivations is, from left to right; pIndigo, pIYC04, pIndigo with 5 ml L-tryptophan 20 g/l added to medium, pIYC04 with 5 ml L-tryptophan 20 g/l added to medium, pIndigo with 5 ml L-tryptophan 20 g/l added after 24 hours of cultivation, pIYC04 with 5 ml L-tryptophan 20 g/l added after 24 hours of cultivation, pIndigo with 5 ml indole 2 g/l added to medium, pIYC04 with 5 ml indole 2 g/l added to medium, pIndigo with 2 drops of indole 2 g/l added after 24 hours of cultivation and pIYC04 with 2 drops of indole 2 g/l added after 24 hours of cultivation.]] |
==='''Day2'''=== | ==='''Day2'''=== | ||
| - | At 9 am on day 2, see Figure | + | At 9 am on day 2, see Figure 11 and 12, some changes had happened overnight. The culture containing CEN PK 113-11C + pIndigo with 5 ml L-tryptophan 20 g/l added to medium had turned brownish for both galactose and glucose medium. This effect is something that has occurred several times for this type of cultivation after about 24 hours. Another short remark that can be done about these pictures is that the cultivations with the initially added indole are quite clear, an indication that it is harder for the cells to survive in the chosen concentration of indole. In the flasks that indole was added on day 2, CEN PK 113-11C + pIndigo with 2 drops of indole 2 g/l added after 24 hours of cultivation and CEN PK 113-11C + pIYC04 with 2 drops of indole 2 g/l added after 24 hours of cultivation, the solution turned slightly darker after indole addition. Finally it can be said that the result for media containing glucose respectively galactose, after 24 hours, were similar and the controls were unchanged. |
| - | At 4 pm on day 2, see Figure | + | At 4 pm on day 2, see Figure 11-13, all colours were preserved from the morning except for the cultivations of CEN PK 113-11C + pIndigo with 5 ml L-tryptophan 20 g/l added after 24 hours of cultivation and CEN PK 113-11C + pIndigo with 2 drops of indole 2 g/l added after 24 hours of cultivation. They had turned brown for the cultivations in galactose, and green for the ones in glucose. |
| - | [[File: | + | [[File:Galactose_day2.jpg|thumb|center|500px|Figure 11: Cultivations in galactose media day 2, all cultivations were made with the strain CEN PK 113-11C . The order of the cultivations is, from left to right; pIndigo, pIYC04, pIndigo with 5 ml L-tryptophan 20 g/l added to medium, pIYC04 with 5 ml L-tryptophan 20 g/l added to medium, pIndigo with 5 ml L-tryptophan 20 g/l added after 24 hours of cultivation, pIYC04 with 5 ml L-tryptophan 20 g/l added after 24 hours of cultivation, pIndigo with 5 ml indole 2 g/l added to medium, pIYC04 with 5 ml indole 2 g/l added to medium, pIndigo with 2 drops of indole 2 g/l added after 24 hours of cultivation and pIYC04 with 2 drops of indole 2 g/l added after 24 hours of cultivation.]] |
| - | [[File: | + | [[File:Glucose_day2.jpg|thumb|center|500px|Figure 12: Cultivations in glucose media day 2, all cultivations were made with the strain CEN PK 113-11C . The order of the cultivations is, from left to right; pIndigo, pIYC04, pIndigo with 5 ml L-tryptophan 20 g/l added to medium, pIYC04 with 5 ml L-tryptophan 20 g/l added to medium, pIndigo with 5 ml L-tryptophan 20 g/l added after 24 hours of cultivation, pIYC04 with 5 ml L-tryptophan 20 g/l added after 24 hours of cultivation, pIndigo with 5 ml indole 2 g/l added to medium, pIYC04 with 5 ml indole 2 g/l added to medium, pIndigo with 2 drops of indole 2 g/l added after 24 hours of cultivation and pIYC04 with 2 drops of indole 2 g/l added after 24 hours of cultivation.]] |
| - | [[File: | + | [[File:Comparisonday2.jpg|thumb|center|500px|Figure 13: Comparison of cultivation flasks at 16.00 day 2. Cultivations flaks at back row contained galactose media and front row flasks contained glucose media. All cultivations were made with the strain CEN PK 113-11C. Both rows, the flasks are arranged in the same order. From left to right; pIndigo, pIYC04, pIndigo with 5 ml L-tryptophan 20 g/l added to medium, pIYC04 with 5 ml L-tryptophan 20 g/l added to medium, pIndigo with 5 ml L-tryptophan 20 g/l added after 24 hours of cultivation, pIYC04 with 5 ml L-tryptophan 20 g/l added after 24 hours of cultivation, pIndigo with 5 ml indole 2 g/l added to medium, pIYC04 with 5 ml indole 2 g/l added to medium, pIndigo with 2 drops of indole 2 g/l added after 24 hours of cultivation and pIYC04 with 2 drops of indole 2 g/l added after 24 hours of cultivation.]] |
| - | Interestingly, when the two flasks containing CEN PK 113-11C + pIndigo with 2 drops of indole 2 g/l added after 24 hours of cultivation in glucose medium and CEN PK 113-11C + pIndigo in galactose medium were shaken blue bubbles occurred in both flasks (see Figure | + | Interestingly, when the two flasks containing CEN PK 113-11C + pIndigo with 2 drops of indole 2 g/l added after 24 hours of cultivation in glucose medium and CEN PK 113-11C + pIndigo in galactose medium were shaken blue bubbles occurred in both flasks (see Figure 14). The bubbles were pipetted from the flasks and were examined under microscope. In between the cells big blue sheets bigger than the cells were observed but we could not figure out what the bubbles consisted of. When the flask was shaken again, new blue bubbles were formed. |
| - | [[File: | + | [[File:Figure14.png|thumb|center|500px|Figure 14: CEN PK 113-11C + pIndigo in glucose medium with 2 drops of indole 2 g/l added after 24 hours of cultivation and CEN PK 113-11C + pIndigo in galactose medium, both flasks were shaken blue bubbles occurred in both flasks.]] |
==='''Day3'''=== | ==='''Day3'''=== | ||
| - | The following pictures show a detailed comparison of the different cultures after 3 days of cultivation. What can be concluded from these results is: | + | The following pictures show a detailed comparison of the different cultures after 3 days of cultivation. What can be concluded from these results is:<br> |
| - | 1. A clear colour change was observed in several cultures, which was strictly dependent on the presence of pIndigo and could not be detected in any of the cultures with the strain containing the control plasmid (e.g. comparison figure | + | 1. A clear colour change was observed in several cultures, which was strictly dependent on the presence of pIndigo and could not be detected in any of the cultures with the strain containing the control plasmid (e.g. comparison figure 17 and 18). This indicates an at least partial activity of the pathway.<br> |
| - | 2. Clear colour changes only occurred when pathway precursors (tryptophan) or intermediates (indole) were added to the medium (e.g. comparison figure | + | 2. Clear colour changes only occurred when pathway precursors (tryptophan) or intermediates (indole) were added to the medium (e.g. comparison figure 15 and 17) assuming that they represent a limiting factor in the non-supplemented cultures. <br> |
| - | 3. A colour difference could be seen between cells grown in glucose and galactose, respectively (figures | + | 3. A colour difference could be seen between cells grown in glucose and galactose, respectively (figures 19 and 23), which might however be due to differences in cell density.<br> |
4. Although the pIndigo cultures showed a colour change none of them exhibited the expected blue colour typical of indigo. We therefore assume that the detected colours we caused by not yet identified pathway intermediates or by-products. | 4. Although the pIndigo cultures showed a colour change none of them exhibited the expected blue colour typical of indigo. We therefore assume that the detected colours we caused by not yet identified pathway intermediates or by-products. | ||
| - | [[File: | + | [[File:Figure15.png|thumb|center|500px|Figure 15: Comparision of cultivation flasks at 13.30 day 3. Left flask: CEN PK 113-11C + pIndigo in glucose medium. Right flask: CEN PK 113-11C + pIndigo in galactose medium.]] |
| - | [[File: | + | [[File:Figure16.jpg|thumb|center|500px|Figure 16: Comparision of cultivation flasks at 13.30 day 3. Left flask: CEN PK 113-11C + pIYC04 in glucose medium. Right flask: CEN PK 113-11C + pIYC04 in galactose medium.]] |
| - | [[File: | + | [[File:Figure17.jpg|thumb|center|500px|Figure 17: Comparision of cultivation flasks at 13.30 day 3. Left flask: CEN PK 113-11C + pIndigo in glucose medium with 5 ml L-tryptophan 20 g/l added to medium. Right flask: CEN PK 113-11C + pIndigo in galactose medium with 5 ml L-tryptophan 20 g/l added to medium.]] |
| - | [[File: | + | [[File:Figure18.jpg|thumb|center|500px|Figure 18: Comparision of cultivation flasks at 13.30 day 3. Left flask: CEN PK 113-11C + pIYC04 in glucose medium with 5 ml L-tryptophan 20 g/l added to medium. Right flask: CEN PK 113-11C + pIYC04 in galactose medium with 5 ml L-tryptophan 20 g/l added to medium.]] |
| - | [[File: | + | [[File:Figure19.jpg|thumb|center|500px|Figure 19: Comparision of cultivation flasks at 13.30 day 3. Left flask: CEN PK 113-11C + pIndigo in glucose medium with 5 ml L-tryptophan 20 g/l added after 24 hours of cultivation. Right flask: CEN PK 113-11C + pIndigo in galactose medium with 5 ml L-tryptophan 20 g/l added after 24 hours of cultivation.]] |
| - | [[File: | + | [[File:Figure20.jpg|thumb|center|500px|Figure 20: Comparision of cultivation flasks at 13.30 day 3. Left flask: CEN PK 113-11C + pIYC04 in glucose medium with 5 ml L-tryptophan 20 g/l added after 24 hours of cultivation. Right flask: CEN PK 113-11C + pIYC04 in galactose medium with 5 ml L-tryptophan 20 g/l added after 24 hours of cultivation.]] |
| - | [[File: | + | [[File:Figure21.jpg|thumb|center|500px|Figure 21: Comparision of cultivation flasks at 13.30 day 3. Left flask: CEN PK 113-11C + pIndigo in glucose medium with 5 ml indole 2 g/l added to medium. Right flask: CEN PK 113-11C + pIndigo in galactose medium with 5 ml indole 2 g/l added to medium. Not that the flasks are incorrectly labelled, the concentration of indole should be 0.2 g/L instead of 2 g/L.]] |
| - | [[File: | + | [[File:Figure22.jpg|thumb|center|500px|Figure 22: Comparision of cultivation flasks at 13.30 day 3. Left flask: CEN PK 113-11C + pIYC04 in glucose medium with 5 ml indole 2 g/l added to medium. Right flask: CEN PK 113-11C + pIYC04 in galactose medium with 5 ml indole 2 g/l added to medium. Not that the flasks are incorrectly labelled, the concentration of indole should be 0.2 g/L instead of 2 g/L.]] |
| - | [[File: | + | [[File:Figure23.jpg|thumb|center|500px|Figure 23: Comparision of cultivation flasks at 13.30 day 3. Left flask: CEN PK 113-11C + pIndigo in glucose medium with 2 drops of indole 2 g/l added after 24 hours of cultivation. Right flask: CEN PK 113-11C + pIndigo in galactose medium with 2 drops of indole 2 g/l added after 24 hours of cultivation.]] |
| - | [[File: | + | [[File:Figure24.jpg|thumb|center|500px|Figure 24: Comparision of cultivation flasks at 13.30 day 3. Left flask: CEN PK 113-11C + pIYC04 in glucose medium with 2 drops of indole 2 g/l added after 24 hours of cultivation. Right flask: CEN PK 113-11C + pIYC04 in galactose medium with 2 drops of indole 2 g/l added after 24 hours of cultivation. ]] |
=='''Absorption spectra'''== | =='''Absorption spectra'''== | ||
| Line 173: | Line 174: | ||
(1) CEN PK 113-11C + pIndigo in glucose media with 2 g/L L-tryptophan added after 24 hours: yellow-brown colour, (2) 1:4 dilution of CEN PK 113-11C + pIndigo in glucose media with 2 g/L L-tryptophan added after 24 hours: yellow-brown colour, (3) CEN PK 113-11C + pIYC04 in glucose media with 2 g/L L-tryptophan added after 24 hours, (4) CEN PK 113-11C + pIndigo in galactose media with 2 g/L L-tryptophan added after 24 hours: orange-brown colour, (5) 1:4 dilution of CEN PK 113-11C + pIndigo in galactose media with 2 g/L L-tryptophan added after 24 hours: orange-brown colour, (6) CEN PK 113-11C + pIYC04 in galactose media with 2 g/L L-tryptophan added after 24 hours. | (1) CEN PK 113-11C + pIndigo in glucose media with 2 g/L L-tryptophan added after 24 hours: yellow-brown colour, (2) 1:4 dilution of CEN PK 113-11C + pIndigo in glucose media with 2 g/L L-tryptophan added after 24 hours: yellow-brown colour, (3) CEN PK 113-11C + pIYC04 in glucose media with 2 g/L L-tryptophan added after 24 hours, (4) CEN PK 113-11C + pIndigo in galactose media with 2 g/L L-tryptophan added after 24 hours: orange-brown colour, (5) 1:4 dilution of CEN PK 113-11C + pIndigo in galactose media with 2 g/L L-tryptophan added after 24 hours: orange-brown colour, (6) CEN PK 113-11C + pIYC04 in galactose media with 2 g/L L-tryptophan added after 24 hours. | ||
| - | For glucose containing media peaks could be seen at ~400nm and ~520nm while galactose containing media only resulted in dispersion spectrum, which can be seen in Figure | + | For glucose containing media peaks could be seen at ~400nm and ~520nm while galactose containing media only resulted in dispersion spectrum, which can be seen in Figure 25. The dilutions resulted in the same absorption patterns as the respective undiluted supernatants. |
| - | [[File: | + | [[File:Indigospectrum.png|thumb|center|500px|Figure 25: Absorbance spectra of supernatant from (1) CEN PK 113-11C + pIndigo in glucose media with 2 g/L L-tryptophan added after 24 hours,(2) 1:4 dilution of CEN PK 113-11C + pIndigo in glucose media with 2 g/L L-tryptophan added after 24 hours, (3) CEN PK 113-11C + pIYC04 in glucose media with 2 g/L L-tryptophan added after 24 hours, (4) CEN PK 113-11C + pIndigo in galactose media with 2 g/L L-tryptophan added after 24 hours: orange-brown colour, (5) 1:4 dilution of CEN PK 113-11C + pIndigo in galactose media with 2 g/L L-tryptophan added after 24 hours: orange-brown colour, (6) CEN PK 113-11C + pIYC04 in galactose media with 2 g/L L-tryptophan added after 24 hours.]] |
=='''Construction of pFIG1-Indigo'''== | =='''Construction of pFIG1-Indigo'''== | ||
| - | To make the system work as planned, with indigo production as an output signal for detection of hCG, the constitutive PGK1 promoter had to be exchanged with the inducible ''FIG1'' promoter, which is activated by the pheromone pathway. The ''FIG1'' promoter was amplified with yeast colony-PCR. After amplification, the ''FIG1'' PCR fragment and pIndigo were both digested with ''Bam''HI and ''Fse''I and were then ligated with each other. The new plasmid was now called pFIG1-Indigo. Transformation of ''E. coli'' DH5α cells with pFIG1-Indigo was successful and pFIG1-Indigo could afterwards be purified with. Purified pFIG1-Indigo was tested by sequencing but unfortunately the sequencing failed. The pFIG1-Indigo and then used to transform strains [IMFD-73 | + | To make the system work as planned, with indigo production as an output signal for detection of hCG, the constitutive PGK1 promoter had to be exchanged with the inducible ''FIG1'' promoter, which is activated by the pheromone pathway. The ''FIG1'' promoter was amplified with yeast colony-PCR. After amplification, the ''FIG1'' PCR fragment and pIndigo were both digested with ''Bam''HI and ''Fse''I and were then ligated with each other. The new plasmid was now called pFIG1-Indigo. Transformation of ''E. coli'' DH5α cells with pFIG1-Indigo was successful and pFIG1-Indigo could afterwards be purified with. Purified pFIG1-Indigo was tested by sequencing but unfortunately the sequencing failed. The pFIG1-Indigo and then used to transform strains [IMFD-73 Δ''cwp2''::kanMX] + hLHCGR and [IMFD-73 Δ''cwp2''::kanMX] + yLHCGR. We managed to transform the strains with pFIG1-Indigo but the system was never proved to be functional. The ''FIG1'' promoter was then successfully cloned into a BioBrick which was verified by PCR and gel electrophoresis (data not shown). |
| - | + | ||
='''Expression of the gene for the LH/CG receptor in yeast'''= | ='''Expression of the gene for the LH/CG receptor in yeast'''= | ||
| Line 252: | Line 252: | ||
[[File:Finalsystem2.png|thumb|500px|center|Figure 39: Test of the finalized system. A) [IMFD-73+yLHCGR+pFig-Indigo]. hCG was added to the sample to the left, while sample to the left was untreated. B) [IMFD-73+yLHCGR+pIYCO4]. hCG was added to the sample to the left, while sample to the left was untreated.]] | [[File:Finalsystem2.png|thumb|500px|center|Figure 39: Test of the finalized system. A) [IMFD-73+yLHCGR+pFig-Indigo]. hCG was added to the sample to the left, while sample to the left was untreated. B) [IMFD-73+yLHCGR+pIYCO4]. hCG was added to the sample to the left, while sample to the left was untreated.]] | ||
| - | ='''Discussion of results and future perspectives'''= | + | <!-- ='''Discussion of results and future perspectives'''= |
=='''Expression of the gene for the LH/CG receptor in yeast'''== | =='''Expression of the gene for the LH/CG receptor in yeast'''== | ||
| Line 278: | Line 278: | ||
If it turns out that LH/CG successfully has been integrated in the membrane but that the receptor is unable to function properly, we would also like to try to reengineer the receptor. In previous studies deletion of foremost intracellular loops has proven to increase the stability and activity of some GPCRs when expressed in yeast[[#ladds|[6]]]. This might be something that could be applied to the LH/CG receptor as well since it does have several large intracellular loops. | If it turns out that LH/CG successfully has been integrated in the membrane but that the receptor is unable to function properly, we would also like to try to reengineer the receptor. In previous studies deletion of foremost intracellular loops has proven to increase the stability and activity of some GPCRs when expressed in yeast[[#ladds|[6]]]. This might be something that could be applied to the LH/CG receptor as well since it does have several large intracellular loops. | ||
| + | --> | ||
='''References'''= | ='''References'''= | ||
| Line 295: | Line 296: | ||
</div> | </div> | ||
| - | |||
| - | |||
| - | |||
| - | |||
| - | |||
| - | |||
| - | |||
| - | |||
| - | |||
| - | |||
| - | |||
| - | |||
| - | |||
| - | |||
| - | |||
| - | |||
| - | |||
| - | |||
| - | |||
{{Team:Chalmers-Gothenburg/footer}} | {{Team:Chalmers-Gothenburg/footer}} | ||
Latest revision as of 21:01, 26 September 2012
Contents |
Results Summary
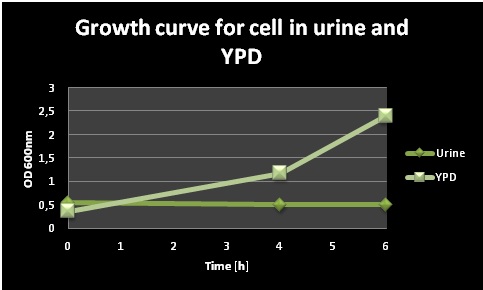
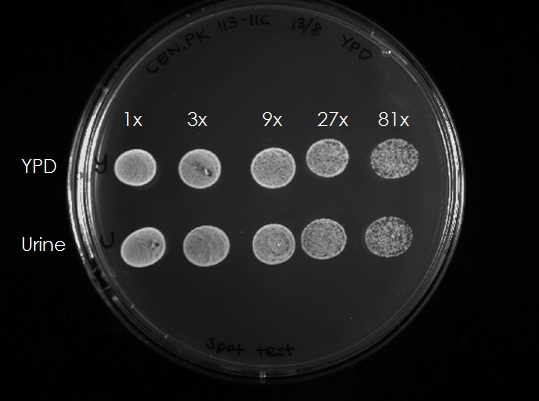
Spot test analysis and growth measurements of yeast in urine were performed in order to test the survival of yeast cells in urinary medium. These initial experiments showed that yeast cells are able to survive in urinary medium which is an important prerequisite for the biosensor.
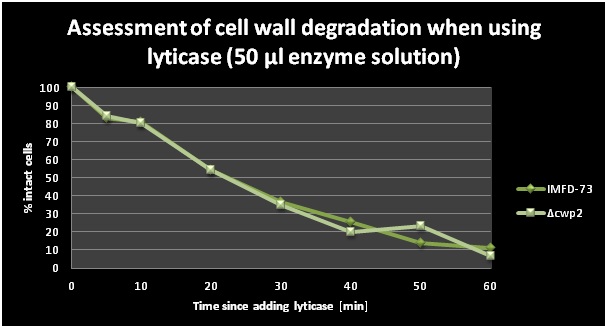
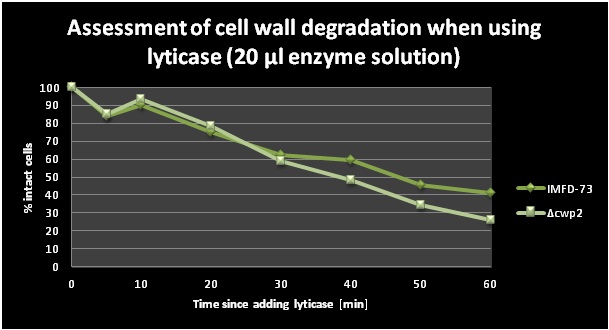
The gene CWP2, encoding a mannoprotein in the cell wall was successfully deleted in the yeast strain IMFD-73. The deletion was confirmed by verification PCR. In addition, a lyticase assay showed that [IMFD-73 Δcwp2::kanMX] was degraded faster than IMFD-73 and this leads us to the conclusion that the cell wall is somewhat weakened in the strains with the deleted cell wall mannoprotein CWP2.
Two different plasmids both containing the receptor gene LHCGR but one with the human signal peptide and the other one with a yeast signal peptide was created. Both plasmids were successfully cloned into IMFD-73 and [IMFD-73 Δcwp2::kanMX] but in neither strains could the receptor be proved as functional in detection of hCG.
The Indigo group managed to obtain different colour changes in different growth media by introducing a plasmid containing the genes tnaA and fmo (pIndigo). For instance, blue bubbles could be seen in one medium and other media turned into different shades of brown. These changes of colour were strictly dependent on the presence of pIndigo and could not be detected in any of the cultures with the strain containing the control plasmid. This indicates an at least partial activity of the pathway. However, we did not manage to confirm the presence of bio-indigo and to determine exactly which compound or reaction that was responsible for the colourful bubbles or colour changes.
[IMFD-73 Δcwp2::kanMX] was successfully transformed with both receptor genes and genes required for bio-indigo production. However, the system was never functional as a pregnancy test kit since it did not give any significant response in the presence of hCG. More detailed analysis of the results are shown in the section below and the discussion can be found here.
Survival of yeast in urine
In order to test if the cells remained alive in the urin, 300 µl of each culture (after 4h) were taken and OD600 was adjusted to 0.5. The samples were diluted 3x, 9x, 27x and 81x and 10 µl aliquots of each dilution were spotted on an YPD plate (Figure 2). The cells from both the YPD and the urine media could grow, this means that the cells survived 4 h in urine and grew normal after being spotted on a YPD plate. Summarizing, yeast cells are unable to proliferate in the urine medium but do survive under these conditions.
Deletion of CWP2 gene
One task of our iGEM project was the deletion of the CWP2 gene, which is encoding a cell wall mannoprotein. By removing it, we aimed for higher cell wall permeability and thus enhanced chances of our ligand hCG to pass the cell wall and to bind to the membrane-bound receptor.
Gene Deletion according to the Bipartite method
The gene deletion was performed according to the bipartite method. The results from the first PCR reactions, in which we amplified the overlapping fragments, can be seen in Figure 3.
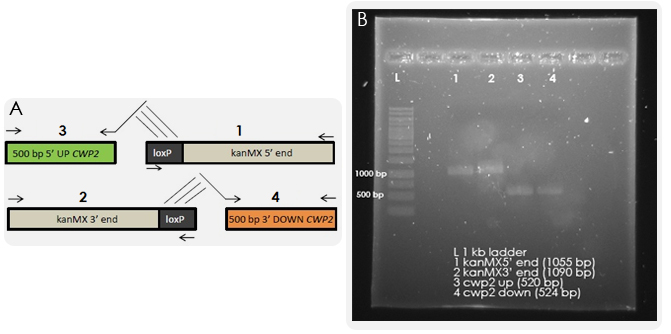
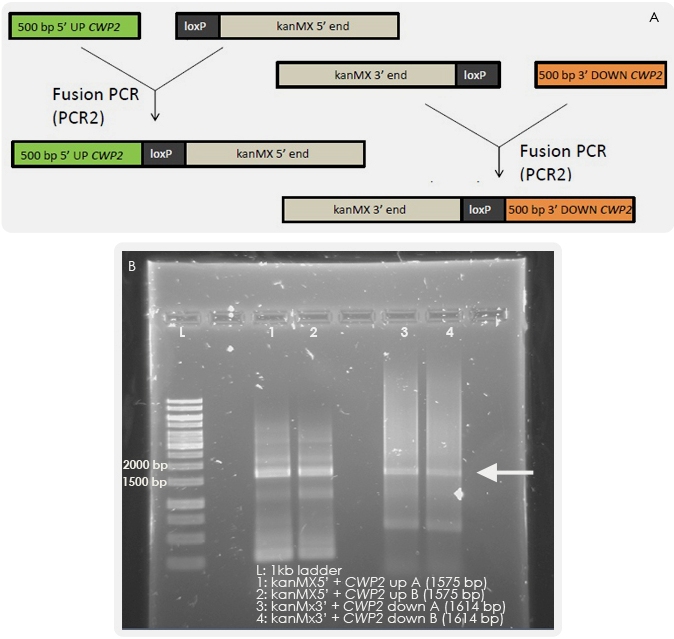
The next step was to fuse together the overlapping fragments. The results of the fusion PCR are shown in the Figure 4. By transforming yeast with these fragments, homologous recombination should occur which will lead to the exchange of the CWP2 gene with the kanMX cassette.
Colony PCR
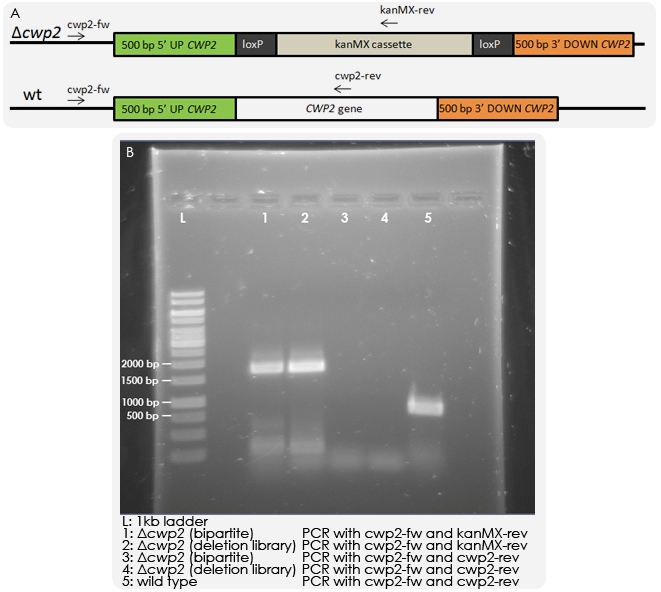
Yeast strain IMFD-73 was transformed with 150 ng of each fragment and grown on G418 plates. Colonies could be observed, which were purified, and colony PCR was then performed in order to test whether the kanMX cassette was integrated randomly in the genome or had replaced the CWP2 gene as desired. PCR was run with a forward primer outside of the inserted region and reverse primers within the CWP2 gene or kanMX cassette respectively. As a control, a wild-type strain and a Δcwp2 strain from a deletion library were also tested. The results of the PCR reactions indicated that the deletion was correct (see Figure 5).
Lyticase assay
A lyticase assay was performed primarily in order to check the activity of lyticase. Another goal was to compare the rapidity of the cell wall degradation between the IMFD-73 and the [IMFD-73 Δcwp2::kanMX] strain. Lyticase was added to the cells and the cell wall degradation (i.e. protoplast formation) could be displayed by adding SDS and then measuring OD at 600 nm (SDS leads to lysis of protoplasts, while cells with intact cell wall remain unaffected). SDS was added and OD values were taken at different time points. The two graphs (Figure 6 and 7) below show the decrease of the amount of intact cells in % over a time period of 1h with two different amounts of lyticase. The percentages of intact cells were calculated as OD600(t=x)/OD600(t=0)*100. One can observe that a slightly smaller amount of cells of the deletion strain were intact between 30 and 60 minutes (except for one outlier at 50 min) which means that the cell wall degraded quicker in the [IMFD-73 Δcwp2::kanMX] strain. This lead to the conclusion that the cell wall is somewhat weakened in the strains with the deleted cell wall mannoprotein gene CWP2.
Introduction of genes for indigo-synthesizing enzymes
Another big tasks in this project was the introducing of two enzymes needed for indigo synthesizes in yeast. In the following sections the construction of the plasmid for indigo production and the testing of the same will be presented.
Construction of pIndigo
To enable production of indigo in yeast, two genes, tnaA and fmo, had to be cloned into the yeast strain. In order to achieve that, a plasmid containing both genes under the control of two different promoters had to be constructed. First we used PCR to amplify the genes. TnaA, encoding the enzyme tryptophanase, was amplified from E. coli genomic DNA by colony-PCR and fmo, encoding the flavin-containg monooxygenase, was amplified by PCR from plasmid kindly provided to us by Si Wouk Kim from Chosun University in South Korea. After a few attempts both genes were successfully amplified. TnaA and fmo were digested with BamHI and XhoI and NotI and PacI respectively and the genes were separately cloned into pIYC04 which had been digested in the same way as respective gene. The plasmids were now called pIYC04-tnaA and pIYC04-fmo. After the ligation E. coli DH5α cells were transformed with pIYC04-tnaA and pIYC04-fmo respectively. Both transformations were successful and the plasmids were purified.
Digested tnaA was ligated with pIYC04-fmo, and digested fmo was ligated with pIYC04-tnaA and the plasmids were now called pIndigo. The reason that pIndigo was constructed in both ways was in order to increase the chances of getting a functional plasmid. DH5α were transformed with pIndigo. The amplification was successful and pIndigo was purified. pIndigo now contained tnaA under control of the constitutive PGK1 promoter and fmo under the control of the constitutive TEF1 promoter. The plasmid was verified by sequencing (data not shown). Sequencing showed that the plasmid contained both tnaA and fmo and there were no signs of mutations. The yeast strain CEN.PK 113-11C was transformed with pIndigo and the presence of the plasmid should theoretically enable the cells to produce indigo, but no blue cells were seen on the plates. To see if the tnaA and the fmo gene had been correctly introduced into the cells, a colony-PCR with a following gel electrophoresis was performed for the genes. The expected bands were approximately 1400 bp for both genes. As one can see on the gel picture in Figure 8, bands with right lengths were present for both genes.
After the CEN PK 113-11C had been transformed with the pIndigo the cells were transferred to SD His- plates along with two controls consisting of CEN PK 113-11C without the plasmid and CEN PK 113-11C with empty plasmid. The control cells that lacked the plasmid were not able to grow on the plates, while the transformed ones did, so the transformation was considered to be successful. After more than one week of cultivation in room temperature and 30 ºC no blue cells were detected. After some time the cells were also transferred to fresh SD His- plates, and further cultivated, but this did not give blue cells on the plate. The strains were also cultivated in SD His- media in room temperature, but no blue colour was obtained.
Test with tryptophan added to media
The CEN PK 113-11C + pIndigo strain was cultivated in liquid media containing tryptophan, the precursor from which Indigo is produced, to see if that would enable the cells to produce indigo. The media volumes were 45 ml and consisted of; 6.9 g/l YNB, 20 g/l glucose, 770 mg/l CSM and X mg/l L-tryptophan. Three different media were prepared and X for these were; 50 mg/l, 100 mg/l respectively 1000 mg/l. The cells had been precultivated overnight in 5 ml SD His- media the main cultures were cultivated in room temperature. After one day of cultivation, the colours of the media in the flasks had not turned blue but interestingly into different shades of brown (data not shown).
Enzymatic assay of tryptophanase
In order to investigate the activity of the tna gene product, tryptophanase, an enzymatic assay was performed. It was focused on the reaction between tryptophan and the enzyme tryptophanase, which forms indole. The general idea was to measure the decrease of tryptophan in a reaction mixture that contained cell free extract of CEN PK 113-11C + pIndigo. The concept of the enzyme essay was to follow the tryptophan concentration by measuring the absorbance at 280 nm. The first attempt failed due to malfunctional spectrophotometer. Two more attempts were performed for the enzymatic assay but the assays did not succeed. The OD was measured for some different concentrations of pure tryptophan solutions and they showed that there were only slight differences in absorbance, even with a 20 time dilution and this was probably the reason that the assay did not work.
Test with indole added to media
A mayor experiment with 20 different cultivations was prepared, in order to study the indigo production of CEN PK 113-11C + pIndigo. The cultivation media had different compositions. In ten flasks the base of the media was 45 ml SD His- and 2% glucose, whilst in the other ten it was 45 ml SD His-, 2% galactose and 0.2% glucose. Amongst these subgroups of ten, 50% of the cultivations were made with CEN PK 113-11C + pIndigo and the others were the control. The cell culture used for the control was CEN PK 113-11C + pIYC04, where pIYC04 is an empty plasmid (negative control). In these subgroups of five, 5 ml L-tryptophan 20 g/l was added to one of the flasks, 5 ml Indole 2 g/l to another, 5 ml L-tryptophan 20 g/l to another after 24 hours of cultivation, 2 drops Indole 2 g/l to another after 24 hours of cultivation and the last flask did not receive an additional chemical.
Two different carbon sources were chosen, since glucose had previously been shown to inhibit tryptophanase. Tryptophan was added as pathway precursor, indole as pathway intermediate in case the monooxygenase, but not the tryptophanase was active.
Day1
During day 1 no major changes in colour were observed for the samples (see Figure 9 and 10). All cultivations had a foggy yellow colour. The samples with added L-tryptophan had initially a slight darker shade of yellow.


Day2
At 9 am on day 2, see Figure 11 and 12, some changes had happened overnight. The culture containing CEN PK 113-11C + pIndigo with 5 ml L-tryptophan 20 g/l added to medium had turned brownish for both galactose and glucose medium. This effect is something that has occurred several times for this type of cultivation after about 24 hours. Another short remark that can be done about these pictures is that the cultivations with the initially added indole are quite clear, an indication that it is harder for the cells to survive in the chosen concentration of indole. In the flasks that indole was added on day 2, CEN PK 113-11C + pIndigo with 2 drops of indole 2 g/l added after 24 hours of cultivation and CEN PK 113-11C + pIYC04 with 2 drops of indole 2 g/l added after 24 hours of cultivation, the solution turned slightly darker after indole addition. Finally it can be said that the result for media containing glucose respectively galactose, after 24 hours, were similar and the controls were unchanged.
At 4 pm on day 2, see Figure 11-13, all colours were preserved from the morning except for the cultivations of CEN PK 113-11C + pIndigo with 5 ml L-tryptophan 20 g/l added after 24 hours of cultivation and CEN PK 113-11C + pIndigo with 2 drops of indole 2 g/l added after 24 hours of cultivation. They had turned brown for the cultivations in galactose, and green for the ones in glucose.


Interestingly, when the two flasks containing CEN PK 113-11C + pIndigo with 2 drops of indole 2 g/l added after 24 hours of cultivation in glucose medium and CEN PK 113-11C + pIndigo in galactose medium were shaken blue bubbles occurred in both flasks (see Figure 14). The bubbles were pipetted from the flasks and were examined under microscope. In between the cells big blue sheets bigger than the cells were observed but we could not figure out what the bubbles consisted of. When the flask was shaken again, new blue bubbles were formed.
Day3
The following pictures show a detailed comparison of the different cultures after 3 days of cultivation. What can be concluded from these results is:
1. A clear colour change was observed in several cultures, which was strictly dependent on the presence of pIndigo and could not be detected in any of the cultures with the strain containing the control plasmid (e.g. comparison figure 17 and 18). This indicates an at least partial activity of the pathway.
2. Clear colour changes only occurred when pathway precursors (tryptophan) or intermediates (indole) were added to the medium (e.g. comparison figure 15 and 17) assuming that they represent a limiting factor in the non-supplemented cultures.
3. A colour difference could be seen between cells grown in glucose and galactose, respectively (figures 19 and 23), which might however be due to differences in cell density.
4. Although the pIndigo cultures showed a colour change none of them exhibited the expected blue colour typical of indigo. We therefore assume that the detected colours we caused by not yet identified pathway intermediates or by-products.


Absorption spectra
In order to try to determine what could have caused the colour change, absorption spectra between 250-700nm were determined for supernatants of cultures from different growth conditions: (1) CEN PK 113-11C + pIndigo in glucose media with 2 g/L L-tryptophan added after 24 hours: yellow-brown colour, (2) 1:4 dilution of CEN PK 113-11C + pIndigo in glucose media with 2 g/L L-tryptophan added after 24 hours: yellow-brown colour, (3) CEN PK 113-11C + pIYC04 in glucose media with 2 g/L L-tryptophan added after 24 hours, (4) CEN PK 113-11C + pIndigo in galactose media with 2 g/L L-tryptophan added after 24 hours: orange-brown colour, (5) 1:4 dilution of CEN PK 113-11C + pIndigo in galactose media with 2 g/L L-tryptophan added after 24 hours: orange-brown colour, (6) CEN PK 113-11C + pIYC04 in galactose media with 2 g/L L-tryptophan added after 24 hours.
For glucose containing media peaks could be seen at ~400nm and ~520nm while galactose containing media only resulted in dispersion spectrum, which can be seen in Figure 25. The dilutions resulted in the same absorption patterns as the respective undiluted supernatants.

Construction of pFIG1-Indigo
To make the system work as planned, with indigo production as an output signal for detection of hCG, the constitutive PGK1 promoter had to be exchanged with the inducible FIG1 promoter, which is activated by the pheromone pathway. The FIG1 promoter was amplified with yeast colony-PCR. After amplification, the FIG1 PCR fragment and pIndigo were both digested with BamHI and FseI and were then ligated with each other. The new plasmid was now called pFIG1-Indigo. Transformation of E. coli DH5α cells with pFIG1-Indigo was successful and pFIG1-Indigo could afterwards be purified with. Purified pFIG1-Indigo was tested by sequencing but unfortunately the sequencing failed. The pFIG1-Indigo and then used to transform strains [IMFD-73 Δcwp2::kanMX] + hLHCGR and [IMFD-73 Δcwp2::kanMX] + yLHCGR. We managed to transform the strains with pFIG1-Indigo but the system was never proved to be functional. The FIG1 promoter was then successfully cloned into a BioBrick which was verified by PCR and gel electrophoresis (data not shown).
Expression of the gene for the LH/CG receptor in yeast
Two different versions of the LH/CG receptor were to be evaluated and expressed in yeast during this project: one with the original human signal peptide fused to the receptor and one with the yeast Ste3 signal peptide fused to the receptor. Both versions were obtained using the gene construct illustrated in Figure 26. The construct was ordered from and synthesized by GenScript.
Obtaining and cloning the yLHCGR and the hLHCGR gene
The yeast signal peptide version of the receptor gene, hereafter referred to as “yLHCGR”, was obtained with PCR using the original gene construct (Figure 26) and 5’ phosphorylated primers (lhcgr-rev and lhcgr-fw), as can be seen in Figure 27 A. The yLHCGR construct was then religated and when cut with restriction enzymes NotI and PacI and run on a gel, the obtained band displayed a correct length of approximately 2100 bp (see Figure 27 C). The band was cut out and the yLHCGR gene was then ligated into the shuttle plasmid pSP-GM1 and amplified in E. coli.
The human signal peptide version of the receptor gene, hereafter referred to as “hLHCGR”, was obtained by digesting the original gene construct with NotI and PacI (Figure 27 B). Gel electrophoresis was run and the obtained fragment displayed a correct length of approximately 2100 bp (see Figure 27 C). The band was cut out, ligated into the pSP-GM1 plasmid and amplified in E.coli.

Saccharomyces cerevisiae strains IMFD-70, IMFD-72, IMFD-73 and IMFD-74 were then successfully transformed with the yLHCGR and hLHCGR expression plasmids respectively. All these strains have been optimized for the coupling of human GPCRs to the pheromone signaling pathway and they differ in their expression of different G alpha proteins. IMFD-70 has the endogenous G alpha protein [1] while the other strains express different versions of yeast/human chimeric G alpha proteins. These chimeric proteins have had the five last amino acid residues of the C terminal end replaced with the corresponding human amino acids [Unpublished data]. IMFD-73 has a chimeric alpha subunit of such type that it should have the best chances of interacting with the LH/CG receptor and was therefore the strain that was mainly used during this project. All strains were kindly provided by the Kondo group at Kobe University, Japan.
Sequencing
In order to confirm that the yLHCGR gene and the hLHCGR gene not only have the correct length but also the correct sequence, the yLHCGR and the hLHCGR plasmid were sent in for sequencing. Results indicated that the sequences were correct for both genes.
Evaluating the functionality of the receptor
The ability of the receptor to detect hCG (i.e to bind the hormone and transmit the signal) when expressed in yeast, was evaluated several times under different conditions. Initial tests were performed by screening for fluorescence after the addition of hCG to the yeast cells. A final test also included screening for indigo production in the completed biosensor system.
Initial tests: Screening for GFP expression
The yeast strains that have been transformed with the gene for the LH/CG receptor have the gene for GFP placed under the control of the pheromone-induced FIG1 promoter. An initial test to see if the LH/CG receptor could detect hCG and activate the pheromone pathway, was therefore done by screening for fluorescence. Below, results from three of these screens are presented.
IMFD-70, IMFD-72, IMFD-73 and IMFD-74, grown at 30°C
One experiment was carried out using all four, IMFD-70, -72, -73 and -74 strains, transformed with yLHCGR, hLHCGR and the empty pSP-GM1 plasmid respectively. Cells were cultivated at 30°C and were treated with lyticase in order to degrade the cell wall. 200 IU of hCG was then added to each strain. Screening for fluorescence was done using a fluorescence microscope. See Figure 28, 29, 30 and 31 for pictures that have been selected as representative of all results obtained during this experiment.


Results obtained for the cells not treated with hCG and cells transformed with the negative control plasmid, indicate that there is relatively high level of background noise of GFP expressions in all IMFD strains. Generally, the fluorescence intensity is approximately equal between samples that have had the hCG hormone added to them and samples that did not have hCG added to them. It was therefore concluded that the LH/CG receptor, when expressed in these yeast strains and tested under the given conditions, is unable to detect hCG or at least that the receptor it is not functioning in a way that produces a sufficiently strong GFP output signal to be distinguished from the background noise.
IMFD-73, grown at room temperature
In a second test, the transformed IMFD-73 strain with either the yLHCGR, hLHCGR or the empty pSP-GM1 plasmid, were cultivated at room temperature. Gron wth at lower temperatures is often used in heterologous protein production since it may improve protein folding. Cells were then treated with cell wall-degrading enzyme lyticase and 200 IU of hCG was added. Results from the fluorescence microscope can be seen in Figure 32, 33 and 34.


Once again, high levels of background fluorescence were present. Results indicated that also when cells are grown at room temperature, the LH/CG receptor is unable to detect hCG or uncapable to produce an output signal that can be distinguished from the background noise in response to detecting hCG.
IMFD-73-ΔCWP2, grown at 30°C
In a third test, the deletion strain IMFD-73-ΔCWP2 transformed with yLHCGR, hLHCGR and the empty pSP-GM1 plasmid respectively was used. The IMFD-73-ΔCWP strain potentially has a weakened cell wall. Cells were grown at 30°C and were not treated with lyticase before the addition of 200 IU hCG. Fluorescence microscope pictures can be seen in Figure 35, 36 and 37.


As previously, the yeast transformed with the LH/CG receptor gene and that had the hCG hormone added to them, did not produce an output signal that could be distinguished from the fluorescence intensity of cells that did not have hCG added to them or that did not contain the LH/CG gene.
Final test of the completed system: screening for color change
One last test was performed using the completed biosensor system: IMFD-73-ΔCWP2+pFig-Indigo+hLHCGR or yLHCGR. The cultures were grown over night before adding hCG in the morning. 3 hours later more hCG was added. From the colorometic assay (see "Results: indigo"), it was concluded that it takes approximately 7 hours for the pIndigo cells to produce a visible color change when grown at 30°C. However, 7 hours after adding hCG to the finalized system, no color change could be observed in any of the cultures (see Figure 38 and 39) and it was concluded that the biosensor did not succeed in detecting the hormone.
References
[1] Togawa F, Ishii J,Ishikura A, Tanaka T, Ogino C, Kondo A. Importance of asparagine residues at positions 13 and 26 on the amino-terminal domain of human somatostatin receptor subtype-5 in signalling. The Journal of Biochemistry. 2010;147(6):867-873. [2] Zhang M, Liang Y, Zhang X, Xu Y, Dai H, Xiao W. Deletion of yeast CWP genes enhances cell permeability to genotoxic agents. Toxicological sciences: an official journal of the Society of Toxicology. 2008;130(1):68-76. [3] Ishii J, Moriguchi M, Hara KY, Shibasaki S, Fukuda H, Kondo A. Improved identification of agonist-mediated Gαi-specific human G-protein-coupled receptor signaling in yeast cells by flow cytometry. Analytical Biochemistry. 2012;426(2):129-133. [4] Fukuda N, Ishii J, Kaishima M, Kondo A. Amplification of agonist stimulation of human G-protein-coupled receptor signaling in yeast. Analytical Biochemistry. 2011;417(2):182-187. [5] Petäja-Repo UE, Merz WE, Rajaniemi HJ. Significance of the carbohydrate moiety of the rat ovarian luteinizing hormone/chorionic-gonadotropin receptor for ligand-binding specificity and signal transduction. The Biochemical Journal. 1993;292(3):839-844. [6] Ladds G, Goddard A, Davey J. Functional analysis of heterologous GPCR signaling pathways in yeast. Trends in Biotechnology. 2005;23(7):367-373
 "
"


