Team:NRP-UEA-Norwich/TheoreticalProjects
From 2012.igem.org
(→Multi-Sensor System) |
(→Multiplication Circuit) |
||
| (61 intermediate revisions not shown) | |||
| Line 5: | Line 5: | ||
[[File:NRPTheoreticalLogo.png | centre]] | [[File:NRPTheoreticalLogo.png | centre]] | ||
| - | + | =Multiplication Circuit= | |
| + | [[File:IGEM_attenuation_diagram_1_12.09.23.png | 250px | right | thumbnail | '''''Figure 1:''''' '' | ||
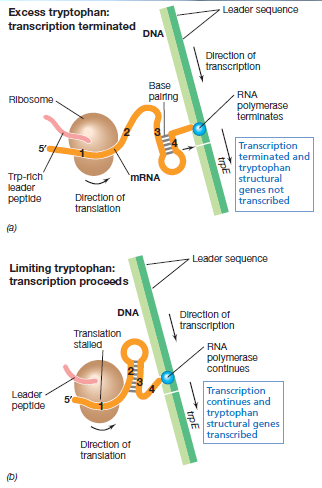
| + | Trytophan operon system a) the effect of excessive tryptophan b) the effect of low tryptophan (Madigan, ''et al.,'' 2012)'']] | ||
| - | + | There are four central mathematical operations: division, multiplication, addition and subtraction; the ability to do each in a cell unleashes massive potential for future applications. | |
| + | A multiplier effect can be produced by using a 'three looped system' that naturally causes attenuation in the tryptophan operon. The leader region (the section of RNA at the start of the mRNA that is not translated but has an effect on translation rate) contains 4 sites which have partial complementation. Region 1 has complementation to region 2, region 2 to 3 and region 3 to 4. When bonding occurs a central strand cannot bind to two strands simultaneously. This is seen in figure 1, where when binding between region 2 and 3 forms, a bond between region 3 and 4 does not form. Bond formation between region 3 and 4 causes transcription termination; it causes RNA polymerase to drop off. The hybridisation of region 2 and 3 prevents binding of 3 and 4. The reason for these different loops forming is due to the presence of rare tryptophan codons in region 1. In the absence of tryptophan, the tryptophan codons have nothing bound to them and the ribosome stalls at the site. Due to stalling of the ribosome, and continuation of transcription, a distance builds up which allows the formation of the 2:3 loop. In the presence of tryptophan, translation occurs until the stop codon is reached and only the 3:4 loop forms. 1:2 and 3:4 loops can form when no translation occurs (Platt, 1986). The reason for the 3:4 loop causing termination and the 2:3 loop not is that there is a difference in the stem and loop pattern. | ||
| + | The removal of the ribosome binding site upstream means that the formation of the stem and loops are no longer dependent on the ribosome. Instead, the team designed a theoretical synthetic gene that would produce a mRNA strand that would complementarily bind to site 1 causing the 2:3 loop to form and thus allowing transcription to occur to the termination codon. The probability of this happening is dependent on the concentration of the complimentary RNAs but also on the transcription initiation rate of the promoter. This creates a multiplier effect where the rate of transcription initiation in the promoter is multiplied by a number between 0 and 1. | ||
| - | |||
| - | |||
| - | |||
| - | |||
| + | '''Theoretical planned lab work''' | ||
| - | + | This idea was taken as far as designing the circuitry DNA. This would need to be synthesised and have promoters whose transcription is dependent upon different ligands. An example would be pBAD (BBa_I0500) and the dual promoter MB (BBa_K774001). In addition to this, fluorescent proteins need to be ligated to the 3’ end of the three loop system leader. Following this, the two fusions can be amalgamated into a single insert within a plasmid and then transformed into E.coli. For ease of characterisation, fluorescent proteins would also be added. | |
| + | |||
| + | Once the circuit is assembled, characterisation studies can be carried out. This would involve growing the cells in a range of concentrations of the different ligand species. Using the example given above, the cells could be grown up in different concentrations of potassium nitrate and arabinose. | ||
| + | |||
| + | [[File:IGEM_multiplicative_write_up_table_1_12.09.23.png | 300px | centre | thumbnail | '''''Table 1:''''' ''data that would indicate the degree of knockdown '']] | ||
| + | |||
| + | |||
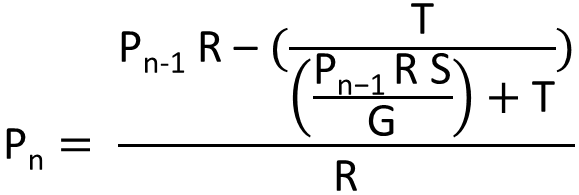
| + | [[File:IGEM_division_equation_1_12.09.24.png | 300px |right | thumbnail | '' '''Figure 2.0:''' Nth term equation for the proportion of transcription of the three loop system RNA that is attenuated by the expression of the complimentary RNA.'']] | ||
| + | |||
| + | [[File:IGEM_simplified_equasion_1_12.09.26.png | 300px |right | thumbnail | '' '''Figure 2.1:''' simplified version of Nth term equation for the proportion of transcription of the three loop system RNA that is attenuated by the expression of the complimentary RNA.'']] | ||
| + | |||
| + | |||
| + | This would indicate the degree of transcriptional repression caused by the expression of the complimentary RNA. It would also confirm the relationship between concentration of RNA complement, transcription initiation rate of promoter (attached to the three loop system) and the rate of RNA transcript synthesis by observing change in fluorescent protein concentration. | ||
| + | |||
| + | '''Mathematical Modelling''' | ||
| + | |||
| + | This equation is in the nth term where each increment represents an increase in concentration of the RNA complement. | ||
| + | |||
| + | Pn = proportion of transcripts that are bound by the complement RNA and attenuated at that level of transcription of the complementary | ||
| + | |||
| + | Pn-1 = at one increment less transcription of R | ||
| + | |||
| + | T = the binding half-life; the mean period for which the two RNAs are annealed | ||
| + | |||
| + | R = the rate of transcription initiation of the section of RNA complementary to site 1 | ||
| + | |||
| + | G = the volume of the cell | ||
| + | |||
| + | S = the speed of RNA complement movement in the cell (temperature dependent) | ||
=Multi-Sensor System= | =Multi-Sensor System= | ||
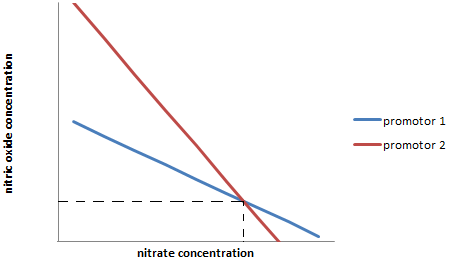
| - | [[File:IGEM_multi_sensor_diagram_1_12.09.23.png | 300px | right]] | + | [[File:IGEM_multi_sensor_diagram_1_12.09.23.png | 300px | right | thumbnail | '''''Figure 3:''''' ''Range of potential concentration ratios indicated by a particular transcription level (arbitrary) of two different promoters (1 and 2).'']] |
| - | + | A serious problem encountered again and again by synthetic biologists is, that for a particular ligand specific promoters do not exist and that it is very difficult to construct a transcription factor that is specific to the required ligand. | |
| + | |||
| + | There are however often broad spectrum (non-specific) promoters for a ligand of interest. These promoters and their transcription factors will induce transcription initiation when exposed to (or not exposed to) the investigated ligand, but also when under influence of other similar ligands. Assuming competitive binding, this is an interesting effect which can be exploited to give specific and accurate concentrations of each of the inducing ligands. | ||
| + | In its simplest form of the Multi-Sensor system, there are two different transcription factors, each of which will cause transcription when exposed to either one or both of two different competitive ligands. | ||
| + | They both posses different active sites, which causes there to be a different bias in both of those for each ligand. This will lead to transcription rates of one of the promoters to indicate a ratio between the two different ligands (for example nitrates and nitrites) as seen in line 1 ("Figure 3."). | ||
| + | Because the two different transcription factors have different binding efficiencies to the two ligands, the line of the other promoter will take a different angle (line 2). The point where these two lines cross, gives the precise concentration of both ligands even though the two different promoters are non-specific. | ||
| + | |||
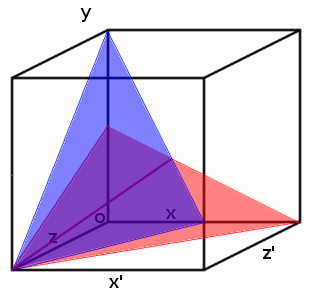
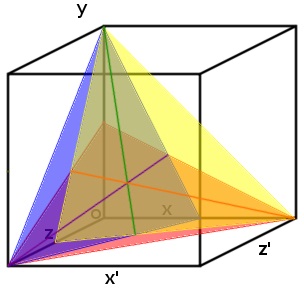
| + | [[File:Two_planes_.png | 250px | right | thumbnail | '''''Figure 4:''''' ''Each plane represents a range of possible concentration ratios of three ligands at a particular transcription rate (arbitrary). The intersection of the two different planes is shown as a purple line. It represents the range of possible ratios when only two planes are observed.'']] | ||
| + | |||
| + | [[File:Three_planes_with_lines_of_intersection_and_point_of_intersection._cropped_1_12.09.25.jpg | 250px | right | thumbnail | '''''Figure 5:''''' ''Each plane represents a range of possible concentration ratios of three ligands at a particular transcription rate (arbitrary). The intersection between each pair of planes is indicated by a line. At the point where these lines intersect is the point where all three planes intersect; this point gives the exact concentration of each of the three different substrates.'']] | ||
| + | |||
| + | This effect can be modelled for more than two substrates. Visually the system can be designed with each concentration being a different access on a graph (which can soon become hyper dimensional). When you add a third ligand it will result in the two lines in ''Figure 5.'' to become two planes which intersect along one line. This means that a third promoter and transcription factor is necessary (the same way that two promoters pinpoint any single point in two-dimensional space, three are needed to triangulate a point in three-dimensional space). | ||
| + | |||
| + | Once the third promoter and transcription factor is added to the graph, the three planes created intersect at a single point which gives the specific concentration of each of the ligands (''Figure 5:''). | ||
| + | When four ligands are used, a hyper dimensional graph of four spatial dimensions with four different plains, each pertaining to a single promoter and transcription factor, will all intersect at a single point. This point will give the specific concentration of each of the four ligands (and so on and so on). | ||
| + | |||
| + | '''Functional construction''' | ||
| + | |||
| + | There are a number of different ways in which this theory could be put into practice. | ||
| + | One would involve each one of the different promoters selected to be be fused to a fluorescent protein and cloned into different cells. | ||
| + | In addition a constitutively expressed fluorescent protein will be used to control for metabolic and cell mass differences. A homogenised sample, split between each of the culture media, containing fluorescent protein with different promoters and | ||
| + | The expression of each fluorescent protein will be measured using fluorometer and the data is to be mathematically analysed (see below). This will give the exact concentrations of each of the ligands. | ||
| - | + | Another possible way of constructing the Multi-sensor system, would be to ligate all promoter - fluorescent sequences into one plasmid and transform this into a single cell. | |
| + | At this point the constitutively synthesised fluorescent protein for control, is no longer necessary because the comparison is made between expressions of different proteins within the same cell. | ||
| + | This system has advantages and disadvantages. Because each cell contains the all promoters necessary for the system, each single cell can give a reading for the chemical concentrations of the ligands investigated. This means in its direct vicinity, that each cell can become a single “ pixel”. This would allow can for an image of chemical concentrations throughout a sample. The useful applications are vast. For example, in environments where diffusion rate is low and chemical concentrations vary e.g. soil, the multi-sensor system would be able to give accurate and locally precise data. It enables exact measurements of concentrations via laser microscopy but an overview of a great amount of data would also be available with just a simple photograph. | ||
| + | |||
| + | '''Future lab work''' | ||
| - | + | Within our project, we decided to work with small nitrogen species. It will be necessary to characterise each promoter incorporated in the system under different concentrations and ratios of each of the ligands it will be measuring. This data is essential to analyse the data that can be recorded. | |
| - | + | ||
| - | + | '''References''' | |
| - | + | ||
| - | + | ||
| - | + | ||
| - | + | Madigan, M T. Martinko, J M. Stahl, D A. clark (2012). Brock biology of microorganisms . 13th ed. London: Pearson. 232. | |
| - | + | Platt, T. (1986) ‘Transcription termination and the regulation of gene expression’, Annual Review of Biochemistry, 55; 339-372. | |
| - | + | ||
Latest revision as of 00:10, 27 September 2012
 "
"

